The latest layout for crude oil today.With geopolitical risks gradually easing, oil prices have deviated significantly from macroeconomic and fundamental guidance. While Iran's situation has shown signs of mitigation, the single-day decline in oil prices was excessive. We believe current oil prices have reached a reasonable range: short positions can still be held, but chasing further shorting is no longer advisable.
On the daily chart, crude oil formed a large bearish candlestick with both no upper and lower shadows, directly breaking below support and continuing to decline. After breaking above the previous high, the breakdown of support indicates that oil prices are falling back again to seek a new trading range. Today, the focus remains on the sustainability of the bearish momentum.
you are currently struggling with losses,or are unsure which of the numerous trading strategies to follow,You have the option to join our VIP program. I will assist you and provide you with accurate trading signals, enabling you to navigate the financial markets with greater confidence and potentially achieve optimal trading results.
Trading Strategy:
sell@68.5-69.0
TP:64.5-64.0
Oil

USOIL Potential UpsidesHey Traders, in tomorrow's trading session we are monitoring USOIL for a buying opportunity around 72.00 zone, USOIL is trading in an uptrend and currently is in a correction phase in which it is approaching the trend at 72 support and resistance area.
Trade safe, Joe.

Crude oil is displaying serious weaknessCrude oil is trapped in a descending triangle after a blow off top. might take some time to play out but target for crude oil based on the triangle is 42-40 crude oil.

Is the oil market signalling de-escalation?After an initial 6% spike at the open, U.S. crude oil futures reversed sharply—falling into negative territory—as markets priced in the possibility that Iran's latest retaliation may be more symbolic than escalatory.
According to President Donald Trump, Iran gave advance notice before launching missiles at a U.S. base in Qatar, allowing defences to intercept the attack and resulting in no reported casualties.
While Tehran publicly described the strike as “devastating and powerful,” the lack of impact on the ground and the pre-warning have fuelled speculation that Iran was aiming to save face without triggering a broader conflict.
The swift reversal in oil prices reflects that sentiment. For now, the market appears to be signaling that escalation may pause here.

Brent Crude still in controlled yr 2025 range ~ 75 - 71 - 63 USThe Brent crude oil price today underwent a technical correction in the D1 / Day time frame as seen from a technical analysis standpoint. It has not yet broken out to indicate Panic in markets of while being within controlled thresholds .
2025 opening price level : USD 75 ;
MAY face support at USD 71 which is JUNE resistance ; can range around this price line
Next drop below June 2025 opening price : USD 63
Experience in markets also say that in order to go Up , markets need a timely Correction (preliminary down move )too !!
Time to Wait and Watch !

WTI CRUDE OIL: Massive 4H MA50 bearish breakout.WTI Crude Oil has turned neutral again on its 1D technical outlook (RSI = 48.933, MACD = 2.900, ADX = 47.682) as it just broke with force under the 4H MA50. Every time this has taken place in the recent past, a strong downtrend followed. The last such selling sequence dropped by -23.71%. The 4H RSI is on the exact same spot as then. We are bearish, TP = 59.00.
See how our prior idea has worked out:
## If you like our free content follow our profile to get more daily ideas. ##
## Comments and likes are greatly appreciated. ##

KOG - OILQuick look at Oil. There is a pivot here in the golden zone around the 70.5 level which we can dip into. Above that level, we would be looking for higher oil with the potential target level on the chart. Note, oil is due a huge pull back, so rejection from one of these resistance levels can give us that pull back in order to get better pricing to long.
We've added the red boxes from the indicator to help you navigate the move.
Please do support us by hitting the like button, leaving a comment, and giving us a follow. We’ve been doing this for a long time now providing traders with in-depth free analysis on Gold, so your likes and comments are very much appreciated.
As always, trade safe.
KOG

Yen slides on oil supply jitters after US attack on IranThe Japanese yen has started the week with sharp losses. In the European session, USD/JPY has jumped 1.2% on the day and is trading at 147.82. The yen has fallen to five-week lows against the US dollar.
The fallout from the US attack on Iranian nuclear facilities over the weekend is being felt in the currency markets. The Japanese yen, traditionally a safe-haven currency, continues to depreciate, in response to rising oil prices.
Oil prices rose to their highest level since January on Monday after the US attack on Iranian nuclear facilities. Iran has threatened to close the Straits of Hormuz, a critical trade route through which 20% of the world's oil supply passes through each day. Oil prices have jumped about 10% since the Israel-Iran war started on June 13 and fears of a disruption to oil supply could further boost oil prices.
As oil prices have climbed, the yen has lost ground, declining 3.0% since the Israel-Iran war started. Japan imports almost all of its oil and the rise in oil prices is hurting Japan's trade balance.
Japan's core inflation rate climbed 3.7% y/y in May, up from 3.5% in April. Core CPI has accelerated for a third straight month and hit its highest level since Jan. 2023. This was above the market estimate of 3.6%. Headline inflation ticked lower to 3.5% from 3.6% in April, below the forecast of 3.6%.
The rise in core CPI supports the case for the Bank of Japan to boost interest rates, but the uncertainty over tariffs and the Israel-Iran war will likely mean that the BoJ will stay on the sidelines in the coming months.
There is resistance at 146.91. Next, USD/JPY is testing resistance at 147.61
146.51 and 145.81 are the next support levels

Brent oilOil prices fell! Trump's tweet sent oil prices lower. But the last three candles were probably because the market was expecting a stronger reaction from Iran, but it is likely that the US will not respond again.

USDJPY H2 Best Level to SHORT/HOLD TP +100/+200 pips🏆USDJPY H2 Market Update H2 chart
📊 Technical Outlook
🔸trading in well defined range
🔸trading near range highs now
🔸range highs set 148.40/148.80
🔸range lows set at 140.80/141.40
🔸strategy: SHORT SELL from resistance
🔸SL 60 pips TP1 +100 pips TP2 +200 pips
🔸swing trade setup for patient traders
🌍 FX Market Snapshot — June 2025
🇪🇺 EUR/USD (~1.1500)
Euro climbs near 1.15 as eurozone inflation cools and ECB turns more dovish.
Stable German sentiment provides support, but softer CPI could limit gains.
🔑 Support: 1.1445 | Resistance: 1.1550
🇬🇧 GBP/USD (~1.3435)
Pound slips toward 1.34 after recent highs, as UK data remains mixed.
Manufacturing picks up, but falling inflation boosts BoE rate cut bets.
🔑 Support: 1.3400–1.3420 | Resistance: 1.3500
🇺🇸 DXY (US Dollar Index, ~99.14)
Dollar edges higher as investors seek safety amid geopolitical tensions.
Mixed US economic signals; eyes on upcoming job data.
🔑 Support: 98.80 | Resistance: 100.00
🇯🇵 USD/JPY (~147.4)
Dollar rallies above 147 as yen weakens; BOJ stays ultra-loose.
Oil price spikes add extra pressure on JPY.
🔑 Support: 145.0 | Resistance: 148.5
📊 Quick View
Pair Rate Support Resistance Key Theme
🇪🇺 EUR/USD ~1.1500 1.1445 1.1550 Dovish ECB, soft CPI
🇬🇧 GBP/USD ~1.3435 1.3400–1.3420 1.3500 Mixed UK data
🇯🇵 USD/JPY ~147.4 145.0 148.5 Yen weakness
🇺🇸 DXY ~99.14 98.80 100.00 Geopolitical risks

Crude Oil Strategy LayoutThe rise in oil prices on Monday will not only push up household daily expenses such as fuel and heating costs, but also increase corporate operating costs, which may in turn suppress consumption and investment activities. Ellen Zentner, Chief Economic Strategist at Morgan Stanley, pointed out in a Sunday analysis that against the backdrop of the Trump administration's high tariff policies, the U.S. economy was already facing pressure from a slowdown in growth, and the further increase in oil prices would exert "powerful pressure" on household consumption capacity. This may not only weaken consumers' willingness to purchase, but also drag down the pace of overall economic growth.
Crude oil showed a gap-up and then decline trend today, falling sharply from around $77.7. Oil prices gradually corrected today, with the lowest point touching around $72.5 and hovering there. Currently, oil prices are hovering above the support level of 72.0, which is expected to be the bottom support of the box movement. Taken together, crude oil is in a high-range consolidation. In terms of operation, it is considered to lay out long positions on pullbacks.
you are currently struggling with losses,or are unsure which of the numerous trading strategies to follow,You have the option to join our VIP program. I will assist you and provide you with accurate trading signals, enabling you to navigate the financial markets with greater confidence and potentially achieve optimal trading results.
Trading Strategy:
buy@72.0-72.5
TP:75.0-75.5

Crude Oil Eyes 3-Year Channel BreakoutCrude Oil trades between Israel-Iran-Conflict supply risks, overbought momentum, and the potential for a 3-year channel breakout.
While upside risks from a possible Strait of Hormuz closure remain uncertain, a firm hold above $78 could extend gains toward $80 and $83.50, keeping oil on a bullish edge for H2 2025.
A pullback into the channel may ease inflation concerns and reassert bearish pressure below the $80 mark. Key support lies at $72 for a potential downside resumption.
- Razan Hilal, CMT

Crude Oil Prices Rocketing amid geopolitical risks
NYMEX:CL1! NYMEX:MCL1! NYMEX:BZ1!
Macro:
Geopolitical tensions remain high and markets are now likely to price in our scenario discussing ongoing air and missile war, given one-off intervention from the US thus far. According to Reuters, the U.S. now assesses that Iranian retaliation could occur within the next two days.What happens next is anybody’s guess but as traders, it is important to navigate these uncertainties with scenario planning and/or reduce risk to account for increased volatility.
We also get Services and Manufacturing PMI data today and PCE Price Index on Friday. Chair Powell is set to testify on Tuesday 9am CT.
Key levels:
Jan 2025 High: 76.57
2025 High: 78.40
2025 CVAH(Composite Value Area High): 75.68
Key LIS zone: 73.50-73.15
We anticipate the following scenarios in crude oil:
Scenario 1:
Prices remain elevated as tensions remain high, despite limited retaliation, however, the situation overall now escalated beyond return to diplomacy.
Scenario 2:
Any push towards de-escalation, unlikely in our analysis, but given the headline risk, crude prices may remain volatile and come off the highs.
Given our key LIS (Line in Sand) zone above, we favor longs above this and shorts below this zone.

USOIL Is Very Bullish! Long!
Take a look at our analysis for USOIL.
Time Frame: 1D
Current Trend: Bullish
Sentiment: Oversold (based on 7-period RSI)
Forecast: Bullish
The market is on a crucial zone of demand 73.546.
The oversold market condition in a combination with key structure gives us a relatively strong bullish signal with goal 79.365 level.
P.S
We determine oversold/overbought condition with RSI indicator.
When it drops below 30 - the market is considered to be oversold.
When it bounces above 70 - the market is considered to be overbought.
Disclosure: I am part of Trade Nation's Influencer program and receive a monthly fee for using their TradingView charts in my analysis.
Like and subscribe and comment my ideas if you enjoy them!

WTI Crude Oil (USOIL) Technical Analysis: Bullish Reversal FacesOf course. Here is a detailed analysis of the provided financial chart for USOIL (WTI Crude Oil).
### Executive Summary
This is a **weekly (1W) Heikin Ashi chart** for CFDs on WTI Crude Oil (USOIL). The chart displays a long-term view, with a prominent downtrend from a peak in 2022. However, there has been a very strong bullish reversal in the most recent weeks. The analysis points to a critical juncture where the price is testing a key long-term resistance level. The bullish momentum is strong, but it faces significant hurdles ahead.
### Detailed Breakdown
#### 1. Asset and Chart Type
* **Asset:** USOIL (WTI Crude Oil), traded as a Contract for Difference (CFD).
* **Timeframe:** 1W (Weekly). Each candle represents one week of price action. This chart is used for analyzing long-term trends.
* **Chart Type:** Heikin Ashi. Unlike standard candlesticks, Heikin Ashi candles are calculated using averages, which smooths out price action and makes trends easier to identify. Long green candles with no lower wicks indicate strong buying pressure, while long red candles with no upper wicks indicate strong selling pressure.
#### 2. Current Price Action
* The last visible candle is a **strong green Heikin Ashi candle**, indicating significant bullish momentum during that week.
* The data for this candle shows: **Open 69.22, High 77.10, Low 69.22, Close 75.41**. This represents a gain of **+4.19%** for the week.
* The price has bounced sharply from a recent low and is now in its third consecutive week of gains.
#### 3. Key Technical Indicators
**a) Fibonacci Retracement:**
* This tool is drawn from a significant low (marked as 1 at **$68.01**) to a major high (marked as 0 at **$123.24**). It's used to identify potential support and resistance levels.
* The price has been trading between the 0.618 and 1 levels for a prolonged period.
* The recent low was found just below the `1` level ($68.01), indicating a potential double-bottom or failure to break lower.
* The price has since reclaimed the `0.786` level ($79.83) and is currently trading around the **$75.41** mark. The next major resistance levels based on this tool are:
* **0.786:** $79.83
* **0.618:** $89.11
* **0.5:** $95.63
**b) Moving Average (MA):**
* A **50-period Moving Average (MA 50)** is present on the chart (the blue line), with a current value of **69.89**.
* On a weekly chart, the 50-week MA is a critical long-term trend indicator.
* The price has been consistently below the 50-week MA since late 2022, confirming the long-term bearish trend.
* **Crucially, the current price is attempting to break above this moving average.** A sustained close above the 50-week MA would be a strong bullish signal. Conversely, if this level acts as resistance and the price is rejected, it could signal a continuation of the downtrend.
**c) Relative Strength Index (RSI):**
* The RSI (14) is shown at the bottom. The purple line (RSI) is currently at **63.33** and its moving average (yellow line) is at **41.95**.
* The RSI is pointing upwards and has decisively crossed above its moving average, indicating **building bullish momentum**.
* It is not yet in the "overbought" territory (typically above 70), which suggests there could be more room for the price to move higher before becoming extended.
**d) Fibonacci Time Zones:**
* The vertical blue lines numbered 0, 1, 2, 3, 5, 8 are Fibonacci Time Zones. They are used to forecast potential turning points in the market based on time intervals.
* The recent major low occurred very close to the "8" time zone marker, which may have contributed to the timing of this reversal.
### Synthesis and Potential Scenarios
* **Bullish Scenario:** The combination of strong green Heikin Ashi candles, a rising RSI, and a bounce from a key long-term low points to strong short-term bullish momentum. If the price can decisively break and hold above the **50-week MA (around $70)** and the **Fibonacci 0.786 level ($79.83)**, the next major target would be the **0.618 level at $89.11**.
* **Bearish Scenario:** The long-term trend remains bearish as long as the price is below the 50-week MA. This level, combined with the psychological resistance at $80, could prove to be a formidable barrier. If the price fails to break through, it could be rejected back down to test recent lows around the **$68.00** area.
In conclusion, the chart shows a classic battle between short-term bullish momentum and a long-term bearish trend. The price's interaction with the **50-week moving average** in the coming weeks will be critical in determining the next major directional move for WTI Crude Oil.

#USOIL - CUT n REVERSE region, still holds??#USOIL.. well guys in first go market perfectly holds our region then again n again..
Now again. Market is in our resistance region and if market hold again then again drop expected.
But
Keep in mind that above that region new will go for cut n reverse on confirmation .
Good luck
Trade wisely

Oil Price Surges at Monday Open Amid US Strikes on IranOil Price Surges at Monday Open Amid US Strikes on Iran
As shown on the XBR/USD chart, the Brent crude oil price formed a bullish gap at the opening of financial markets this Monday, surpassing last week’s high.
Only three days ago, we drew attention to Donald Trump’s statement that a decision regarding US involvement in the Iran-Israel conflict would be made within two weeks – yet over the weekend, US aircraft dropped bombs on Iran’s nuclear facilities.
Now oil prices are likely to be affected by Iran’s potential move to block shipping traffic through the Strait of Hormuz. According to Reuters, analysts suggest that in such a scenario, the oil price could climb to $100.
Technical Analysis of the XBR/USD Chart
The ascending channel plotted last week remains valid.
The fact that the price is pulling back (as indicated by the arrow) from the high set at the market open suggests the market had already priced in a significant risk of US involvement in the Iran-Israel military conflict.
Key points:
→ Technical support in the near term may be provided by the area where the lower boundary of the blue channel intersects with the $76 level (which acted as resistance at the end of last week).
→ Ultimately, fundamental factors and official statements will play a decisive role in oil price movements. It’s worth noting that, following the strikes on its territory, Iran is threatening retaliation against the US.
This article represents the opinion of the Companies operating under the FXOpen brand only. It is not to be construed as an offer, solicitation, or recommendation with respect to products and services provided by the Companies operating under the FXOpen brand, nor is it to be considered financial advice.

WTI(oil)For oil, what I have in mind, considering the conditions we are in, if the Strait of Hormuz is not closed, we will remain at the same prices, that is, $75 to $80. But if the Strait is closed 100%, the price will go up to $130 and $150 in the short term.

What Is the Base Price or Long-term Support for Crude Oil?What is the base price for oil? Specifically, today we will discuss crude oil, and we can apply this understanding to other commodities as well.
I won't go into too much technical detail about the difference between the base price and the cost price for crude oil, but for most people, it helps to see the title as “Is there a bottom-line price or support level for crude oil?”
My answer is yes, and this is due to inflation. Over time, we tend to pay higher prices for food, gas and many others that we consume.
The cost of goods varies between producers and merchants, and then from merchants to end consumers. However, it all starts with the producer. Before a producer acquires oil for refining, they reference crude oil prices as a benchmark to decide whether to make a purchase or hold back.
So, “Is there a bottom-line price or support level for crude oil?”
As we can see from the yearly chart, in every few years the base price of crude oil keeps adjusting higher; in levels and stages.
There is also this parallel channel formed by joining across its troughs and mirror it to its prominent resistance, we can observe crude oil prices range bound between this broad uptrend over time.
We can try to apply this analysis to other commodities; we will find a similar broad uptrend across most of them. But why? Because of inflation.
Regarding the bottom-line support for crude oil, we observed that it was at $10 from the 1980s until the turn of the millennium. Over time, accounting for inflation, this support level shifted upward to around $30 from the early 2000s until 2020, the year of COVID-19. And now we can see there is a new support at $60 since the start of 2020.
How to explain this break below $30 base price and went to -$40?
In technical analysis, this break is considered a false break, because, at the close of that year, on this yearly chart, prices settled above the support line at $30.
The story behind this is that when COVID hit, airlines were grounded, leading to storage issues for large quantities of oil. It cost more to store the oil than its selling price, which caused prices to drop below zero, reaching as low as -$40. But prices ultimately found its equilibrium and settle at a fair value at $48 that year.
Where is the support for crude oil, and what is its current direction?
This was a video analysis on Sep 2024, in this weekly chart, we can see a wedge pattern. Then I believe if the price breaks above this downtrend line, it suggests that we may see higher crude oil prices. And this analysis is taking shape today.
We can see prices initially broke above this trendline, but shortly sink below and broke this support line at $66 to $55. And today we are at $73 after the renewal of the Middle East tension.
How should I interpret the move to the recent low around $55?
I would encourage to always discover the development with different time frame as time progress.
Switching to the yearly chart, we observed that crude oil is still supported above $60 that year.
Please also make a point to adjust this downtrend line from time to time as market dynamic changes.
Watch the full video:
WTI Crude Oil Futures & Options
Ticker: MCL
Minimum fluctuation:
0.01 per barrel = $1.00
Disclaimer:
• What presented here is not a recommendation, please consult your licensed broker.
• Our mission is to create lateral thinking skills for every investor and trader, knowing when to take a calculated risk with market uncertainty and a bolder risk when opportunity arises.
CME Real-time Market Data help identify trading set-ups in real-time and express my market views. If you have futures in your trading portfolio, you can check out on CME Group data plans available that suit your trading needs www.tradingview.com
Trading the Micro: www.cmegroup.com
www.cmegroup.com

WTI Oil H4 | Multi-swing-low support at 61.8% Fibo retracementWTI oil (USOIL) is falling towards a multi-swing-low support and could potentially bounce off this level to climb higher.
Buy entry is at 72.92 which is a multi-swing-low support that aligns with the 61.8% Fibonacci retracement.
Stop loss is at 69.10 which is a level that lies underneath a swing-low support.
Take profit is at 77.60 which is a multi-swing-high resistance.
High Risk Investment Warning
Trading Forex/CFDs on margin carries a high level of risk and may not be suitable for all investors. Leverage can work against you.
Stratos Markets Limited (tradu.com ):
CFDs are complex instruments and come with a high risk of losing money rapidly due to leverage. 63% of retail investor accounts lose money when trading CFDs with this provider. You should consider whether you understand how CFDs work and whether you can afford to take the high risk of losing your money.
Stratos Europe Ltd (tradu.com ):
CFDs are complex instruments and come with a high risk of losing money rapidly due to leverage. 63% of retail investor accounts lose money when trading CFDs with this provider. You should consider whether you understand how CFDs work and whether you can afford to take the high risk of losing your money.
Stratos Global LLC (tradu.com ):
Losses can exceed deposits.
Please be advised that the information presented on TradingView is provided to Tradu (‘Company’, ‘we’) by a third-party provider (‘TFA Global Pte Ltd’). Please be reminded that you are solely responsible for the trading decisions on your account. There is a very high degree of risk involved in trading. Any information and/or content is intended entirely for research, educational and informational purposes only and does not constitute investment or consultation advice or investment strategy. The information is not tailored to the investment needs of any specific person and therefore does not involve a consideration of any of the investment objectives, financial situation or needs of any viewer that may receive it. Kindly also note that past performance is not a reliable indicator of future results. Actual results may differ materially from those anticipated in forward-looking or past performance statements. We assume no liability as to the accuracy or completeness of any of the information and/or content provided herein and the Company cannot be held responsible for any omission, mistake nor for any loss or damage including without limitation to any loss of profit which may arise from reliance on any information supplied by TFA Global Pte Ltd.
The speaker(s) is neither an employee, agent nor representative of Tradu and is therefore acting independently. The opinions given are their own, constitute general market commentary, and do not constitute the opinion or advice of Tradu or any form of personal or investment advice. Tradu neither endorses nor guarantees offerings of third-party speakers, nor is Tradu responsible for the content, veracity or opinions of third-party speakers, presenters or participants.

OIL: THE CHART THAT COULD TIP THE WORLDWTI Crude just bounced hard off the $65 channel support, tagging resistance at $76 — and what happens next isn’t just about price. It’s about power.
Zoom into this chart:
We're sitting at a directional pivot with two possible outcomes:
1️⃣ If this was a truncated 5th wave, the structure is complete. Any further war escalation could be the catalyst for oil to break resistance — dragging down risk assets, including CRYPTOCAP:BTC and equities.
2️⃣ If wave 5 isn’t done, we’ll likely see one more sharp leg down before oil launches. Either way, this is a high-stakes Elliott Wave setup with global macro consequences.
Chart with FIB Levels:
You'll see the wave I’ve marked (3) is messy, and on lower timeframes, that may hint at a truncated move worth watching.
Why this matters:
Over 20% of global oil flows through the Strait of Hormuz, a critical chokepoint controlled by Iran. If conflict escalates, that line gets squeezed… and oil price explodes.
Price to watch:
$76 resistance.
If oil breaks, the markets will react fast.
If it fails, we might get one more correction and maybe some relief from the sideways pain we’ve seen across risk assets.
Remember the COVID Crash?
Oil literally went below zero in April 2020. That wasn't just a chart anomaly, it was a global demand collapse. Traders were paying to get rid of oil because there was nowhere to store it. That moment marked a generational low, and what followed was a powerful multi-year 5 wave up.
Now look where we are:
That same COVID low helped form the base of the current Elliott Wave structure. The fact we’re back testing levels that once sparked global panic is no coincidence.
If you’ve been here before, you’ll see the signs. The charts always leave traces. And if this is the end of wave 5, it could be the start of a whole new macro move.
TLDR:
Stop trading headlines.
Trade the structure.
This chart is telling us everything.

Trump’s “ambiguous” statement, where will oil prices go?
💡Message Strategy
Trump's remarks are repeated, and the geopolitical premium still limits the downward space of oil prices
Trump said that the United States "may or may not" join Israel's actions against Iran. Analysts pointed out that if the United States is officially involved in the conflict, oil prices may rise by $5; if peace talks are launched, they may fall by the same amount.
The geopolitical focus is still on the Strait of Hormuz
Iran produces 3.3 million barrels of oil per day, but more importantly, about 19 million barrels of crude oil are transported through the Strait of Hormuz. The escalation of the conflict may threaten the safety of the waterway.
The Fed's policy turn to dovish failed to effectively support oil prices
Although the Fed hinted that it may cut interest rates twice this year, Chairman Powell emphasized that the decision still depends on inflation data, and Trump's upcoming new round of import tariffs may push up prices and limit the boost in oil demand brought about by loose policies.
📊Technical aspects
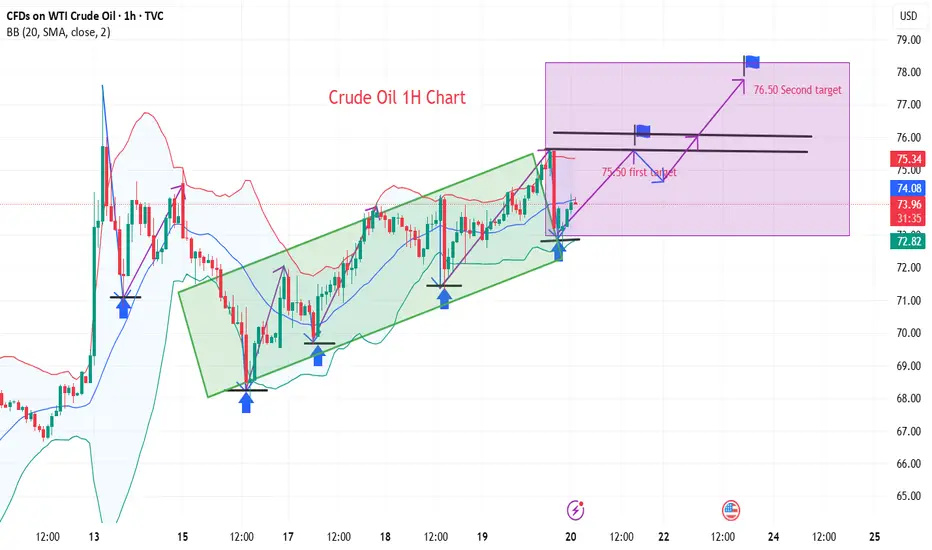
From the daily chart level, crude oil prices in the medium term broke through the upper resistance of the range and tested a new high of 75.50. The moving average system is in a bullish arrangement, and the medium-term objective trend is in the direction.
The current trend is in the upward rhythm of the main trend. The MACD indicator fast and slow lines overlap with the bullish column above the zero axis, indicating that the bullish momentum is currently full, and it is expected that the medium-term trend is expected to usher in a wave of rising rhythm.
💰Strategy Package
Long Position:73.00-73.50,SL:72.50
The first target is around 75.50
The second target is around 76.50
If the situation in the Middle East escalates, the room for crude oil to rise will be enlarged
Weekly Market Forecast: Wait To Buy S&P, NAS, & OIL!In this Weekly Market Forecast, we will analyze the S&P 500, NASDAQ, DOW JONES, Gold and Silver futures, for the week of June 22-28th.
The tensions in the Middle East take center stage, as Iran has signaled they are willing to discuss limitations on there Uranium enrichment program. This could allow outflows from safe havens and inflows to risk assets.
Keep and eye on Silver for shorts, in the near term, though.
Let's see if the market tilts its hand early next week. Monday should bring clarity.
Wait for confirmations before entering trades. A break of structure would be ideal! Enter on the pullback to that structure point.
Enjoy!
May profits be upon you.
Leave any questions or comments in the comment section.
I appreciate any feedback from my viewers!
Like and/or subscribe if you want more accurate analysis.
Thank you so much!
Disclaimer:
I do not provide personal investment advice and I am not a qualified licensed investment advisor.
All information found here, including any ideas, opinions, views, predictions, forecasts, commentaries, suggestions, expressed or implied herein, are for informational, entertainment or educational purposes only and should not be construed as personal investment advice. While the information provided is believed to be accurate, it may include errors or inaccuracies.
I will not and cannot be held liable for any actions you take as a result of anything you read here.
Conduct your own due diligence, or consult a licensed financial advisor or broker before making any and all investment decisions. Any investments, trades, speculations, or decisions made on the basis of any information found on this channel, expressed or implied herein, are committed at your own risk, financial or otherwise.
