WTI Oil H1 | Overlap resistance at 61.8% Fibonacci retracementWTI oil (USOIL) is rising towards an overlap resistance and could potentially reverse off this level to drop lower.
Sell entry is at 76.02 which is an overlap resistance that aligns closely with the 61.8% Fibonacci retracement.
Stop loss is at 78.00 which is a level that sits above a multi-swing-high resistance.
Take profit is at 71.40 which is a swing-low support that aligns closely with the 78.6% Fibonacci retracement.
High Risk Investment Warning
Trading Forex/CFDs on margin carries a high level of risk and may not be suitable for all investors. Leverage can work against you.
Stratos Markets Limited (tradu.com ):
CFDs are complex instruments and come with a high risk of losing money rapidly due to leverage. 63% of retail investor accounts lose money when trading CFDs with this provider. You should consider whether you understand how CFDs work and whether you can afford to take the high risk of losing your money.
Stratos Europe Ltd (tradu.com ):
CFDs are complex instruments and come with a high risk of losing money rapidly due to leverage. 63% of retail investor accounts lose money when trading CFDs with this provider. You should consider whether you understand how CFDs work and whether you can afford to take the high risk of losing your money.
Stratos Global LLC (tradu.com ):
Losses can exceed deposits.
Please be advised that the information presented on TradingView is provided to Tradu (‘Company’, ‘we’) by a third-party provider (‘TFA Global Pte Ltd’). Please be reminded that you are solely responsible for the trading decisions on your account. There is a very high degree of risk involved in trading. Any information and/or content is intended entirely for research, educational and informational purposes only and does not constitute investment or consultation advice or investment strategy. The information is not tailored to the investment needs of any specific person and therefore does not involve a consideration of any of the investment objectives, financial situation or needs of any viewer that may receive it. Kindly also note that past performance is not a reliable indicator of future results. Actual results may differ materially from those anticipated in forward-looking or past performance statements. We assume no liability as to the accuracy or completeness of any of the information and/or content provided herein and the Company cannot be held responsible for any omission, mistake nor for any loss or damage including without limitation to any loss of profit which may arise from reliance on any information supplied by TFA Global Pte Ltd.
The speaker(s) is neither an employee, agent nor representative of Tradu and is therefore acting independently. The opinions given are their own, constitute general market commentary, and do not constitute the opinion or advice of Tradu or any form of personal or investment advice. Tradu neither endorses nor guarantees offerings of third-party speakers, nor is Tradu responsible for the content, veracity or opinions of third-party speakers, presenters or participants.
Oil

Crude oil------Buy around 74.00, target 75.00-76.50Crude oil market analysis:
Crude oil has been strong recently, and it is also because of the support of fundamentals and inventory data that crude oil has begun to strengthen. Today's idea is still bullish on crude oil. Continue to buy after the retracement. The daily moving average has begun to diverge. The small support for buying has reached around 72.00. The suppression position is around 74.00 and 77.60. I estimate that it will form a small shock and then break through and rise again. If it does not break 70.00, it is still strong. Buy crude oil around 74.00 today.
Fundamental analysis:
The interest rate results announced by the Federal Reserve last night remained unchanged at 4.25%-4.50%, and the fourth consecutive meeting remained unchanged, which was in line with market expectations. The uncertainty of the United States about the future has led to no major changes in monetary policy in the near future.
Operational suggestions
Crude oil------Buy around 74.00, target 75.00-76.50

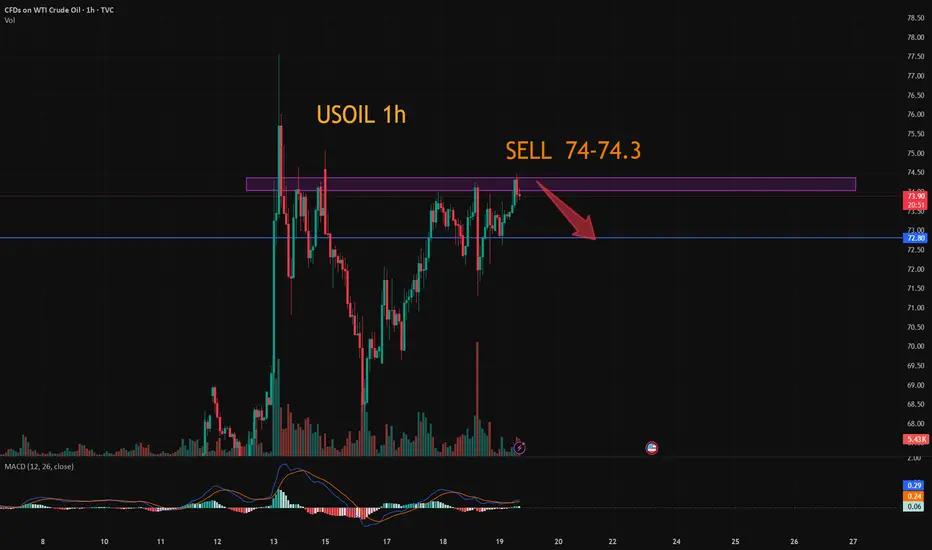
USOIL:The trading strategy of going short
USOIL: Consider shorting for now, as there are signs of a top above 74.5, but I think this is only a short-term high and will continue to surge higher. The trading idea is to sell short today and wait for the right position to be long.
Trading Strategy:
SELL@74-74.3
TP: 73.2-72.7
↓↓↓ More detailed strategies and trading will be notified here ↗↗↗
↓↓↓ Keep updated, come to "get" ↗↗↗
Will oil prices fall after the sharp surge in crude oil?Oil prices corrected under the dual pressure of news-driven factors and inventory data. Brent crude oil futures traded in a narrow range, reaching $76.38 per barrel, while WTI July contracts edged down to $73.35 per barrel. With intensified geopolitical uncertainties, market sentiment remains dominated by wait-and-see attitudes. The unexpected increase in EIA crude oil inventories dampened market optimism. According to the latest data from the U.S. Energy Information Administration (EIA), crude oil inventories in the U.S. increased by 2.6 million barrels for the week ending June 14, far exceeding the market expectation of a 1.1 million barrel decline, indicating weak demand. The rebound in inventories has exerted downward pressure on oil prices.
Oil prices have repeatedly crossed the moving average system, with the short-term objective trend showing a range-bound rhythm. In terms of momentum, the MACD indicator is intertwined near the upper side of the zero axis, reflecting weak bullish momentum. It is expected that crude oil prices will mainly maintain a consolidative pattern, with the trading range between 79.00 and 73.00.
you are currently struggling with losses,or are unsure which of the numerous trading strategies to follow,You have the option to join our VIP program. I will assist you and provide you with accurate trading signals, enabling you to navigate the financial markets with greater confidence and potentially achieve optimal trading results.
Trading Strategy:
buy@75.0-76.0
TP:78.0-79.0

The wealth code of crude oil is: low and long
💡Message Strategy
According to market research, Iran's crude oil export infrastructure has not been directly hit yet, and most of the impact is still concentrated on shipping. However, analysts pointed out that once the conflict spreads to the entire region, oil prices are likely to rise further.
The Strait of Hormuz has become the market's biggest concern. It is the throat of about one-fifth of the world's crude oil supply. Although there is no sign that Iran is trying to block the channel, any escalation of the situation may pose a serious threat to the global energy supply chain.
"Trump's threat to Iran's supreme leader shows that diplomatic channels are no longer effective," said Charu Chanana, chief investment strategist at Saxo Financial Markets Ltd. in Singapore. "If Iran's exports are interrupted, or even in the worst case scenario such as the Hormuz blockade, oil prices may soar rapidly."
The rise in geopolitical risks has also triggered turmoil in financial markets, with investors turning to safe-haven assets such as gold, and the volatility of the crude oil market has hit a three-year high. At the same time, crude oil producers have stepped up hedging operations, and futures and options trading volumes have surged.
The latest API crude oil inventory data showed that U.S. crude oil inventories fell sharply last week, further reinforcing market expectations of tight supply. According to data released by the American Petroleum Institute (API) in the early hours of June 18, U.S. crude oil inventories fell by 11 million barrels in the week ending June 14, far exceeding market expectations of a decline of 2.5 million barrels, marking the largest weekly drop since August last year.
📊Technical aspects
From a technical perspective, the daily chart of US crude oil (WTI) shows a clear bullish trend. After breaking through the previous high of $72, the price quickly rose and stabilized above $75, showing strong upward momentum. The current K-line has closed with long positive lines, and the red column of the MACD indicator has expanded, and the fast and slow lines have crossed, indicating that the bullish momentum continues to increase.
At the same time, the price has moved away from the 20-day and 50-day moving averages. There is a possibility of a technical correction in the short term, but the overall trend is still upward. If the geopolitical situation continues to be tense, the target may be raised to $77.5 or even the integer mark of $80, and the support will focus on the vicinity of $72.50.
💰 Strategy Package
Crude oil has reached our upward target of 74.00 yesterday and fell back. The current upward pressure on crude oil is around 75.50. If it breaks through upward, it will soon reach our second target of 77.50.
rend: Upward trend
Support: Around 72.50
Resistance: Around 75.50
Long Position:72.00-72.50,SL:71.50
The first target is around 75.00
The second target is around 77.50

Bullish momentum to extend?WTI Oil (XTI/USD) has bounced off the pivot and could potentially rise to the 1st resistance.
Pivot: 73.40
1st Support: 71.46
1st Resistance: 76.64
Risk Warning:
Trading Forex and CFDs carries a high level of risk to your capital and you should only trade with money you can afford to lose. Trading Forex and CFDs may not be suitable for all investors, so please ensure that you fully understand the risks involved and seek independent advice if necessary.
Disclaimer:
The above opinions given constitute general market commentary, and do not constitute the opinion or advice of IC Markets or any form of personal or investment advice.
Any opinions, news, research, analyses, prices, other information, or links to third-party sites contained on this website are provided on an "as-is" basis, are intended only to be informative, is not an advice nor a recommendation, nor research, or a record of our trading prices, or an offer of, or solicitation for a transaction in any financial instrument and thus should not be treated as such. The information provided does not involve any specific investment objectives, financial situation and needs of any specific person who may receive it. Please be aware, that past performance is not a reliable indicator of future performance and/or results. Past Performance or Forward-looking scenarios based upon the reasonable beliefs of the third-party provider are not a guarantee of future performance. Actual results may differ materially from those anticipated in forward-looking or past performance statements. IC Markets makes no representation or warranty and assumes no liability as to the accuracy or completeness of the information provided, nor any loss arising from any investment based on a recommendation, forecast or any information supplied by any third-party.

WTI(20250619)Today's AnalysisMarket news:
Fed's June meeting - kept interest rates unchanged for the fourth time in a row, and the dot plot showed two rate cuts this year, but the number of officials who expected no rate cuts this year rose to 7, and the rate cut expectations for next year were cut to 1. Powell continued to call for uncertainty, and the current economic situation is suitable for waiting and watching. He also expects tariff-driven inflation to rise in the coming months.
Technical analysis:
Today's buying and selling boundaries:
72.69
Support and resistance levels:
75.60
74.51
73.81
71.58
70.88
69.79
Trading strategy:
Upward breakthrough of 73.81, consider entering the market to buy, the first target price is 74.51
Downward breakthrough of 72.69, consider entering the market to sell, the first target price is 71.58
Strait of Hormuz risk priced in—or not yet?Iran has repeatedly threatened to block the Strait of Hormuz during periods of heightened tension with the U.S., notably in 2011, 2018, and 2020. The Strait is considered the world’s most critical oil chokepoint, with nearly 20 million barrels passing through daily.
Several banks warn that a full closure could push crude prices above $120–$150 per barrel, or higher if the disruption is prolonged. Still, most analysts view a complete shutdown as unlikely, since Iran also depends on the Strait to export its own oil.
Technically, recent WTI candles suggest that the risk premium may be fading. Price action near $74 shows hesitation, raising the risk of a developing double top—particularly if support at $70 fails. Unless tensions escalate materially, such as the U.S. becoming more directly involved, WTI may consolidate between $70–$74.

What Is the Base Price for Oil?What is the base price for oil? Specifically, today we will discuss crude oil, and we can apply this understanding to other commodities as well.
I won't go into too much technical detail about the difference between the base price and the cost price for crude oil, but for most people, it helps to see the title as “Is there a bottom-line price or support level for crude oil?”
My answer is yes, and this is due to inflation. Over time, we tend to pay higher prices for food, gas and many others that we consume.
WTI Crude Oil Futures & Options
Ticker: MCL
Minimum fluctuation:
0.01 per barrel = $1.00
Disclaimer:
• What presented here is not a recommendation, please consult your licensed broker.
• Our mission is to create lateral thinking skills for every investor and trader, knowing when to take a calculated risk with market uncertainty and a bolder risk when opportunity arises.
CME Real-time Market Data help identify trading set-ups in real-time and express my market views. If you have futures in your trading portfolio, you can check out on CME Group data plans available that suit your trading needs www.tradingview.com
Trading the Micro: www.cmegroup.com
www.cmegroup.com

WTI CRUDE OIL: There is no better time to sell that this.WTI Crude Oil has turned overbought on its 1D technical outlook (RSI = 71.048, MACD = 2.830, ADX = 41.529) and this is technically the most efficient level to sell on the long term. Not only is that the top of the dotted Channel Down but last week the price got very close to the 1W MA200, which has produced the last 3 major rejections since the week of August 12th 2024. Technically the market still has some room to move upwards and test it but since it rose purely on the latest Middle East conflict, it is more likely than not to see an equally quick price deflation and rebalancing. The earlier bearish waves (September 2023 onwards), initially targeted the 0.786 Fibonacci level and then bounced. That translates to TP = 61.00 (at least) towards the end of the year.
See how our prior idea has worked out:
## If you like our free content follow our profile to get more daily ideas. ##
## Comments and likes are greatly appreciated. ##

Crude oil---Buy near 72.00, target 72.90-74.90Oil market analysis:
Recently, the daily crude oil line has started to pull up, and buying has begun to rise. The retracement is our opportunity to buy again. The moving average support of the daily crude oil line has begun to move up, and the pattern has reached around 69.60. Today's idea is to buy at 72.00. The pattern is difficult to see, just buy repeatedly. The fight between Iran and Israel is a great support for crude oil. In addition, there is EIA crude oil inventory data today.
Fundamental analysis:
Previously, we have been paying attention to geopolitical factors in the fundamentals. Indeed, the situation in the Middle East has also changed the way of gold and crude oil. Today we focus on the monetary policy of the Federal Reserve, and Chairman Powell's speech during the US trading time.
Operational suggestions:
Crude oil---Buy near 72.00, target 72.90-74.90

Analysis of the latest crude oil market trendCrude oil prices stabilized after a sharp rise on Tuesday, with the market keeping a close eye on the potential escalation of conflicts in the Middle East. According to market surveys, Iran's crude oil export infrastructure has not been directly hit so far, and most of the impacts are still concentrated on shipping. However, analysts point out that if the conflict spreads to the entire region, oil prices are likely to rise further significantly. The current rise in crude oil prices is not only dominated by actual supply and demand but is highly influenced by geopolitics. Market sentiment is extremely vulnerable to disturbances from external events. As the global energy artery, the stability of the Strait of Hormuz provides strong support for oil prices. When the uncertainty of the geopolitical situation intensifies, attention should be paid to the release of U.S. official inventory data and the development of diplomatic processes.
Technical analysis of crude oil: The moving average system is in a bullish arrangement, and the medium-term objective trend direction is upward. The current trend is in the rhythm of the main upward trend. The fast and slow lines of the MACD indicator coincide with the bullish columns above the zero axis, indicating that the bullish momentum is currently full. It is expected that the medium-term trend is expected to usher in a rising rhythm.
you are currently struggling with losses,or are unsure which of the numerous trading strategies to follow,You have the option to join our VIP program. I will assist you and provide you with accurate trading signals, enabling you to navigate the financial markets with greater confidence and potentially achieve optimal trading results.
Trading Strategy:
buy@72.0-72.5
TP:74.0-74.5

WTI drops as Trump keeps markets guessing Despite a huge draw in US crude inventories - not that this was going to move the market given the focus being firmly fixated on the Middle East situation - oil prices fell as Trump kept markets guessing about US military involvement in Iran. The US president said: "I may do it. I may not do it. Nobody knows what I’m going to do." The US president also revealed that he told Israel PM Netanyahu to keep going, but has not given an indication that the US will provide more help. Meanwhile, Iran has issued an evacuation warning for residents of Haifa, Israel. This suggests that the conflict is far from over. But for now at least, the US is not getting involved, if one can believe Trump.
Anyway, WTI is now back at short-term support here, around the $72 handle. If it goes back above $73.00 again then we may see momentum build up again to the upside, especially if the war between Iran and Israel escalates.
By Fawad Razaqzada, market analyst with FOREX.com

Oil Traders Brace for Impact: US War or Pullback?WTI Crude Oil – Intraday Update: Tension Builds Inside Rising Channel
1H Technical Outlook — June 18, 2025
🧭 Current Market Structure:
WTI is currently trading at $72.54, holding above key support but struggling to break through a strong intraday supply zone around $73.80–74.00. Price has formed a rising channel, gradually climbing with higher highs and higher lows—often a pre-breakout structure.
Momentum on the Stochastic oscillator is turning, suggesting the market is preparing for a strong directional move.
📊 Key Technical Levels:
Resistance Zones:
$74.00 – intraday supply
$76.00 – swing high zone
$78.00+ – war-driven extension target
Support Zones:
$70.00 – mid-channel & psychological level
$68.00 – previous breakout zone
$66.00 – bearish continuation target if war is ruled out
🔺 Scenario 1: US-Iran War Escalates (Bullish Breakout)
If the U.S. launches airstrikes or there is confirmed military escalation:
Expect immediate breakout above $74.00.
Price likely to test $76.00, followed by an impulsive move toward $78.00+.
Intraday traders should watch for breakout retest setups on lower timeframes (M15/M5).
🛢️ Market could price in a $5–$10 geopolitical premium per barrel within hours if conflict begins.
🔻 Scenario 2: No War / De-escalation (Bearish Breakdown)
If headlines signal de-escalation or diplomacy:
Rising channel may break to the downside.
WTI could fall back to test $70.00, and if broken, flush toward $68.00–66.00 support.
Watch for bearish engulfing candles, divergence, or momentum fading.
📉 Oil often unwinds risk premium quickly when fear fades — beware sharp selloffs.
🔁 Neutral Intraday Note:
Price currently consolidating between $72.00–74.00 inside an ascending channel.
Break above or below this range will dictate momentum.
Wait for confirmation candle close before entering breakout trades.
🛡️ Risk Management:
Avoid large overnight positions — news headlines can cause gaps or whipsaws.
Use tight stops if trading breakout/down; volatility is news-driven.
Consider options strategies for limited risk exposure (calls above $74 / puts below $70).
📢 If you found this analysis valuable, kindly consider boosting and following for more updates.
⚠️ Disclaimer: This content is intended for educational purposes only and does not constitute financial advice.

Massive Oil Move Incoming? Only One Thing Can Stop ItOIL – Overview
Oil Rallies to 5-Month High as Israel-Iran Tensions Escalate
Oil prices surged to a five-month high early Wednesday amid escalating conflict between Israel and Iran. The ongoing airstrikes between the two nations, along with reports that the Trump administration is considering military involvement, have intensified concerns over a broader regional war.
Since Israel launched a surprise strike on Iran last week targeting nuclear sites, oil has risen nearly 10%, fueled by fears of potential supply disruptions. President Trump has publicly called for Iran's "unconditional surrender," signaling heightened geopolitical risk.
Despite the ongoing conflict, Iran's oil exports remain largely unaffected, and the country has not yet disrupted shipping through the Persian Gulf — a critical route supplying around 20% of global oil demand. However, markets remain on edge over the potential for further escalation that could directly impact supply.
Technical Outlook:
Oil maintains bullish momentum as long as it trades above 72.21, with upside targets at:
➡️ 77.21
➡️ 79.50 — key breakout level
➡️ 85.40 — next resistance zone
➡️ Potential extension to 88.40 if momentum continues
🔻 A shift to bearish sentiment is only likely if negotiations begin between Iran and Israel, signaling potential de-escalation.
Key Levels:
• Pivot: 73.20
• Resistance: 77.21 / 79.50 / 85.40
• Support: 69.55 / 68.33 / 66.03
Caution: Any signs of de-escalation or negotiations between Iran and Israel could quickly reverse the trend.

Crude Oil Futures: Navigating Geopolitical Risk and VolatilityMarket Context:
NYMEX:CL1! COMEX:GC1! CBOT:ZN1! CME_MINI:ES1! CME_MINI:NQ1! CME:6E1!
Implied volatility (IV) in the front weeks (1W and 2W) is elevated, and the futures curve is in steep backwardation. This indicates heightened short-term uncertainty tied to geopolitical tensions, particularly in the Middle East involving Iran and Israel. The forward curve, however, suggests the market is not fully pricing in sustained or escalating conflict.
We evaluate three possible geopolitical scenarios and their implications for the Crude Oil Futures market:
Scenario 1: Ceasefire Within 1–2 Weeks
• Market Implication: Short-term geopolitical premium deflates.
• Strategy: Short front-month / Long deferred-month crude oil calendar spread.
o This position benefits from a reversion in front-month prices once the risk premium collapses, while deferred months—already pricing more stable conditions—remain anchored.
o Risk: If the ceasefire fails to materialize within this narrow window, front-month prices could spike further, causing losses.
Scenario 2: Prolonged War of Attrition (No Ceasefire, Ongoing Missile and Air War)
• Market Implication: Front-end volatility may ease slightly but remain elevated; deferred contracts may begin to price in more geopolitical risk.
• Strategy: Long back-month crude oil futures.
o The market is currently underpricing forward-looking risk premiums. A persistent conflict, even without full-scale escalation, may eventually force the market to adjust deferred pricing upward.
o Risk: Time decay and roll costs. Requires a longer holding horizon and conviction that the situation remains unresolved and volatile.
Scenario 3: Full-Scale Regional War
• Market Implication: Severe market dislocation, illiquidity, potential for capital flight, and broad-based risk-off sentiment across global assets.
• Strategy: Avoid initiating directional exposure in crude. Focus on risk management and capital preservation.
o In this tail-risk scenario, crude oil could spike sharply, but slippage, execution risk, and potential exchange halts or liquidity freezes make it unsuitable for new exposure.
o Alternative Focus: Allocate to volatility strategies, defensive hedging (e.g., long Gold, long VIX futures), and cash equivalents.
o Risk: Sudden market shutdowns or gaps may make exit strategies difficult to execute.
Broader Portfolio Considerations
Given the crude oil dynamics, there are knock-on effects across other markets:
• Gold Futures: Flight-to-safety bid in Scenarios 2 and 3. Long positioning in Gold (spot or near-month futures) with defined stop-loss levels is prudent as a hedge.
• Equity Index Futures (E-mini Nasdaq 100 / S&P 500): Vulnerable to risk-off flows in Scenarios 2 and 3. Consider long volatility (VIX calls or long VX futures) or equity index puts as portfolio hedges. In Scenario 1, equities could rally on resolution optimism—especially growth-heavy Nasdaq.
• Currency Futures: USD likely to strengthen as a safe haven in Scenarios 2 and 3. Consider long positions in Dollar and Short 6E futures.
• Bond Futures: Risk-off flows theoretically should support Treasuries in Scenarios 2 and 3. Long positions in 10Y or 30Y Treasury futures could serve as a defensive allocation. Yields may retrace sharply lower if escalation intensifies. However, given the current paradigm shift with elevated yields, higher for longer rates and long end remaining high, we would not bet too heavily on Bond futures to act as safe haven. Instead, inflows in Gold, strengthening of Chinese Yuan and Bitcoin will be key to monitor here.
Scenario-based planning is essential when markets are pricing geopolitical risk in a non-linear fashion. Crude oil currently reflects a consensus expectation of de-escalation (Scenario 1), which opens the door for relative value and mean-reversion strategies in the front-end of the curve.
However, given the asymmetric risks in Scenarios 2 and 3, prudent exposure management, optionality-based hedges, and a flexible risk framework are imperative. A diversified playbook; leveraging volatility structures, calendar spreads, and cross-asset hedges offers the best path to opportunity while managing downside risk.

WTI(20250618)Today's AnalysisMarket news:
World Gold Council: 95% of central banks expect gold reserves to rise in the next 12 months.
Technical analysis:
Today's buying and selling boundaries:
72.29
Support and resistance levels:
76.53
74.95
73.92
70.66
69.63
68.04
Trading strategy:
If the price breaks through 73.92, consider buying, the first target price is 74.95
If the price breaks through 72.29, consider selling, the first target price is 70.66

USOIL:Go short before you go long
The idea of crude oil is still to go long. Today, the more appropriate entry point is 72-72.3, there is still a little space at present, if you consider selling short first, then the more appropriate short point is 73-73.3 range. Give to the point to do, to wait to do more.
Trading Strategy:
SELL@73-73.3
TP: 72-72.3
BUY@72-72.3
TP: 73.7-74
↓↓↓ More detailed strategies and trading will be notified here ↗↗↗
↓↓↓ Keep updated, come to "get" ↗↗↗

USOIL BEARS WILL DOMINATE THE MARKET|SHORT
USOIL SIGNAL
Trade Direction: short
Entry Level: 73.10
Target Level: 68.31
Stop Loss: 76.29
RISK PROFILE
Risk level: medium
Suggested risk: 1%
Timeframe: 3h
Disclosure: I am part of Trade Nation's Influencer program and receive a monthly fee for using their TradingView charts in my analysis.
✅LIKE AND COMMENT MY IDEAS✅

USOIL:A long trading strategy
Oil prices also fell sharply under the stimulus of the news, and then completed the correction rebound in the sub-session, and now back to around 71 again. The current trend is in the upward rhythm of the main trend, and it is expected that the trend of crude oil will be mainly in the form of shock consolidation.
Trading ideas than yesterday did not change too much, adjust the appropriate profit point.
Trading Strategy:
BUY@70.5-70.8
TP: 71.8-72.3
↓↓↓ More detailed strategies and trading will be notified here ↗↗↗
↓↓↓ Keep updated, come to "get" ↗↗↗

USOIL 1 - Hour Chart AnalysisUSOIL 1 - Hour Chart Analysis
Key Levels
Support: ~69.50 (short - term), 67.70 (critical backup).
Resistance: 73.50 (major hurdle, tested before).
Trend, Pattern & Middle East Conflict
Price oscillates between support/resistance, with a potential “V - shaped reversal”. Middle East conflicts add high uncertainty:
Escalation: Fears of supply cuts could push price above 73.50 rapidly.
De - escalation: May pressure price down, but 67.70/69.50 still get support from lingering supply - risk worries.
Trading Strategies
Bullish: If 69.50 holds (e.g., long lower shadows/bullish candles), small - size long. Target 73.50; stop - loss ~69.20. Watch for sudden conflict news.
Bearish: If 69.50 breaks (consecutive closes below), short. Target 67.70; stop - loss ~69.80. Stay alert to conflict updates.
Note: Oil prices hinge on supply - demand, Middle East tensions, and the USD. Combine tech/fundamental analysis; manage risk strictly.
⚡️⚡️⚡️ USOil ⚡️⚡️⚡️
🚀 Buy@ 70.50 - 71.00
🚀 TP 73.00 - 74.00
Accurate signals are updated every day 📈 If you encounter any problems during trading, these signals can serve as your reliable guide 🧭 Feel free to refer to them! I sincerely hope they'll be of great help to you 🌟 👇

WTI Oil H1 | Falling toward a pullback supportWTI oil (USOIL) is falling towards a pullback support and could potentially bounce off this level to climb higher.
Buy entry is at 73.31 which is a pullback support that aligns with the 38.2% Fibonacci retracement.
Stop loss is at 70.90 which is a level that lies underneath a swing-low support and the 61.8% Fibonacci retracement.
Take profit is at 77.60 which is a swing-high resistance.
High Risk Investment Warning
Trading Forex/CFDs on margin carries a high level of risk and may not be suitable for all investors. Leverage can work against you.
Stratos Markets Limited (tradu.com ):
CFDs are complex instruments and come with a high risk of losing money rapidly due to leverage. 63% of retail investor accounts lose money when trading CFDs with this provider. You should consider whether you understand how CFDs work and whether you can afford to take the high risk of losing your money.
Stratos Europe Ltd (tradu.com ):
CFDs are complex instruments and come with a high risk of losing money rapidly due to leverage. 63% of retail investor accounts lose money when trading CFDs with this provider. You should consider whether you understand how CFDs work and whether you can afford to take the high risk of losing your money.
Stratos Global LLC (tradu.com ):
Losses can exceed deposits.
Please be advised that the information presented on TradingView is provided to Tradu (‘Company’, ‘we’) by a third-party provider (‘TFA Global Pte Ltd’). Please be reminded that you are solely responsible for the trading decisions on your account. There is a very high degree of risk involved in trading. Any information and/or content is intended entirely for research, educational and informational purposes only and does not constitute investment or consultation advice or investment strategy. The information is not tailored to the investment needs of any specific person and therefore does not involve a consideration of any of the investment objectives, financial situation or needs of any viewer that may receive it. Kindly also note that past performance is not a reliable indicator of future results. Actual results may differ materially from those anticipated in forward-looking or past performance statements. We assume no liability as to the accuracy or completeness of any of the information and/or content provided herein and the Company cannot be held responsible for any omission, mistake nor for any loss or damage including without limitation to any loss of profit which may arise from reliance on any information supplied by TFA Global Pte Ltd.
The speaker(s) is neither an employee, agent nor representative of Tradu and is therefore acting independently. The opinions given are their own, constitute general market commentary, and do not constitute the opinion or advice of Tradu or any form of personal or investment advice. Tradu neither endorses nor guarantees offerings of third-party speakers, nor is Tradu responsible for the content, veracity or opinions of third-party speakers, presenters or participants.

The best opportunity is when crude oil falls
💡Message Strategy
Crude oil futures fell in the European session on Monday (June 16), giving up earlier gains, as a new round of hostilities between Israel and Iran had limited impact on oil production and exports.
WTI briefly rebounded to $77.49, close to last week's high, which was also our second profit target, but failed to break through the key resistance level near $78.09.
Oil prices surged 7% on Friday, driven by geopolitical risks, pushing crude to its highest level since January. However, Monday's reversal reflected the lack of immediate threats to supply routes, especially the strategically important Strait of Hormuz.
If Iran's production drops sharply due to the conflict, the global oil supply buffer will be quickly exhausted and oil prices may usher in a new round of surges. Faced with this complex situation, investors, oil-producing countries and consumers need to be prepared to meet the possible energy storm.
This is also the reason why we repeatedly emphasize that crude oil should be long when it falls. We can foresee its upward momentum, and the pullback is only in a moment without any signs.
📊Technical aspects
The short-term (1H) trend of crude oil continued to fluctuate upward, and the price near 74 was tested. The moving average system relies on the bullish arrangement of oil prices, and the short-term objective trend direction remains upward.
In the morning, the oil price hit a new high near 75.30, and then fell back and closed with a negative real candlestick. The short-term momentum is still bullish, and it is expected that the trend of crude oil will continue to maintain a high-level oscillating upward rhythm.
💰 Strategy Package
Long Position:69.50-70.50
The first target is around 73.00
The second target is around 75.00
