Liquidity Hunt: Crude Oil's Next TargetFenzoFx—Crude Oil remains below the $64.19 resistance level. The Stochastic Oscillator is in overbought territory, and RSI 14 signals bearish divergence, suggesting a possible price dip.
Oil could briefly surpass $64.19 to grab liquidity before facing selling pressure. In this case, a drop toward the $61.72 support level may occur to fill the bullish fair value gap.
However, if Oil stabilizes above $64.19, the bearish outlook becomes invalid.
>>> Trade Crude Oil without swap and low spread at FenzoFx
Oil

WTI Crude Returns to $63Over the past two trading sessions, WTI crude oil has gained more than 5%, as confidence has temporarily returned to the market following the latest OPEC+ announcements. The organization recently announced a new production increase of 411,000 barrels per day starting in July, but the volume was lower than anticipated, which has been interpreted as a positive signal for short-term price behavior. This has helped sustain a consistent bullish bias in recent sessions.
Bearish Trend Remains Intact
Since early January, crude oil has followed a steady bearish trend. Currently, the price is approaching the resistance marked by the trendline, and if buying pressure holds in the short term, the bearish formation could come under threat in the upcoming trading sessions.
MACD
At the moment, the MACD histogram shows slight oscillations above the neutral line (0), but it has not yet indicated a decisive market impulse. As a result, a strong sense of short-term neutrality persists, as the price approaches key resistance levels.
RSI
The Relative Strength Index (RSI) is showing a similar pattern: the line is starting to rise, but it is flattening out, which could be weakening the current buying momentum and signaling a possible sideways movement in the short term.
Key Levels to Watch:
$63 – Current Barrier: Aligns with the bearish trendline and could be where price indecision intensifies, leading to continued consolidation.
$57 – Major Support: A recent low. If the price returns to this level, it could reactivate the bearish trend and lead to a deeper sell-off.
$68 – Key Resistance: Located around the 200-period moving average. A breakout above this level could mark the beginning of a new long-term bullish trend.
Written by Julian Pineda, CFA – Market Analyst

CRUDE OIL TO HIT $160?!Oil prices broke down lower in the past few weeks, after a much needed LQ grab, following a 2 year consolidation. We’ve seen a ‘5 Wave Complex Correction’, which should now be followed by price recovery.
Wait for buyers to BREAK ABOVE our ‘buying confirmation’ level, followed a by a retest before buying, otherwise leave it❗️

$USO to $29-42 before a bottom is inAMEX:USO broke down from a long term that started in March 2020 and is now breaking down below support at $67.
The most likely outcome is a continuation down to the lower support levels at $29-33.
I won't rule out the possibility of one more retest of the trend line ($73-75) before continuing down further. An invalidation of the short would be a break over the $83 level.
Otherwise, downside is the most likely outcome from here.
Let's see how it plays out over the coming months.

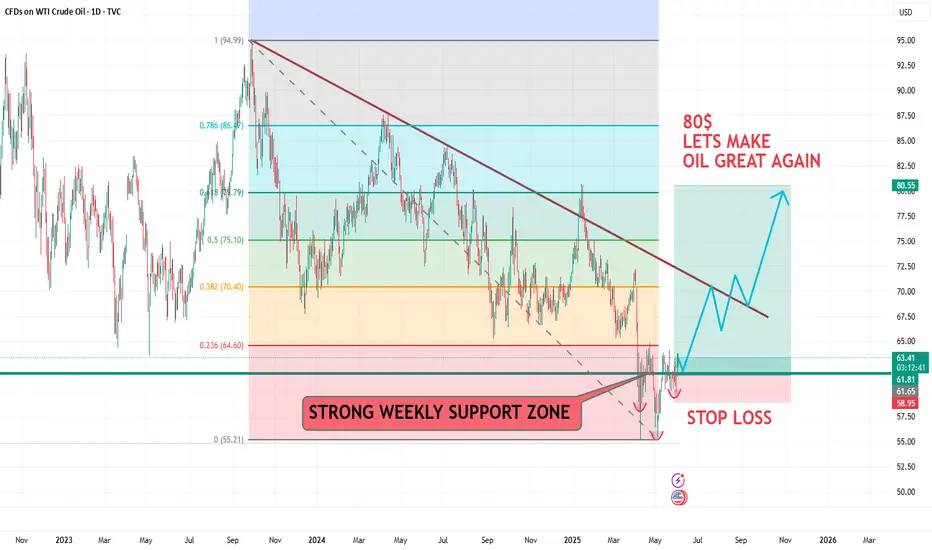
USOIL LETS MAKE OIL GREAT AGAIN TO 80$HELLO TRADERS
As i can see USOIL it formaing H & S pattrent and now trading above a strong Weekly horizontal Support zone if prices hold above 65$ then given Tp can be easy target if we see a higher demand and tight supply with the War going on around the world its a huge possibilty that pricce can shoot up we have to monitor the 65$ price zone which is importat to hold bull cycle on smaller TF 4HR it is creating Wickoff pattren too and we can see Fibo levels golden ratio can hit our targers or risk reward is great for us becaus we was buying the dip in May it is just starting chart is crystal clear its just a trade idea share your thoughts we appriciate ur comments and support Stay tuned for more updates
Crude oil surges stronglyInternational oil prices rose in early Asian trading on Tuesday, primarily driven by heightened risks of supply disruptions. Iran is expected to reject a U.S.-proposed nuclear deal proposal that could have paved the way for easing sanctions on Iranian oil exports. Additionally, wildfires in Alberta, Canada, have suspended part of oil and gas production, exacerbating market concerns about supply. Brent crude rose 0.85% to $65.18 per barrel, while U.S. West Texas Intermediate (WTI) crude gained 0.75% to $62.97, extending a nearly 3% rally from the previous session.
The current oil price surge reflects the effect (superimposition) of multiple factors, including geopolitical uncertainties and sudden natural disasters. Notably, the market’s reaction to the OPEC+ production increase strategy highlights its high sensitivity to supply-side control. The Iran and Canada incidents have further underscored the short-term vulnerability of the global oil market. If U.S.-Iran negotiations completely collapse or wildfires continue to spread, oil prices may sustain their upward momentum.
Technically, the K-line chart has repeatedly formed bullish candlesticks with long lower shadows and small real bodies, indicating strong buying support at lower levels. Short-term intraday crude oil is expected to retain further upside potential.
Humans need to breathe, and perfect trading is like breathing—maintaining flexibility without needing to trade every market swing. The secret to profitable trading lies in implementing simple rules: repeating simple tasks consistently and enforcing them strictly over the long term.
Trading Strategy:
buy@62.0-62.5
TP:63.5-64.0

CRUDE OIL Swing Short! Sell!
Hello,Traders!
USOIL keeps growing
And Oil is locally overbought
So after the price hit a very
Strong resistance level
Around 65.00$ we will be
Expecting a pullback and
A local bearish correction
Sell!
Comment and subscribe to help us grow!
Check out other forecasts below too!
Disclosure: I am part of Trade Nation's Influencer program and receive a monthly fee for using their TradingView charts in my analysis.

USOIL:Go long
Crude oil prices rose due to ongoing tariff uncertainty as well as ongoing geopolitical tensions in the Middle East.
From the chart, the K line has repeatedly appeared long lower shadow small solid positive line, indicating that the lower buying long support is strong. Expected intraday crude oil short - term trend still exists a wave of upward space.
Trading Strategy:
BUY@62.5-62.6
TP: 63.5-64
↓↓↓ More detailed strategies and trading will be notified here ↗↗↗
↓↓↓ Keep updated, come to "get" ↗↗↗

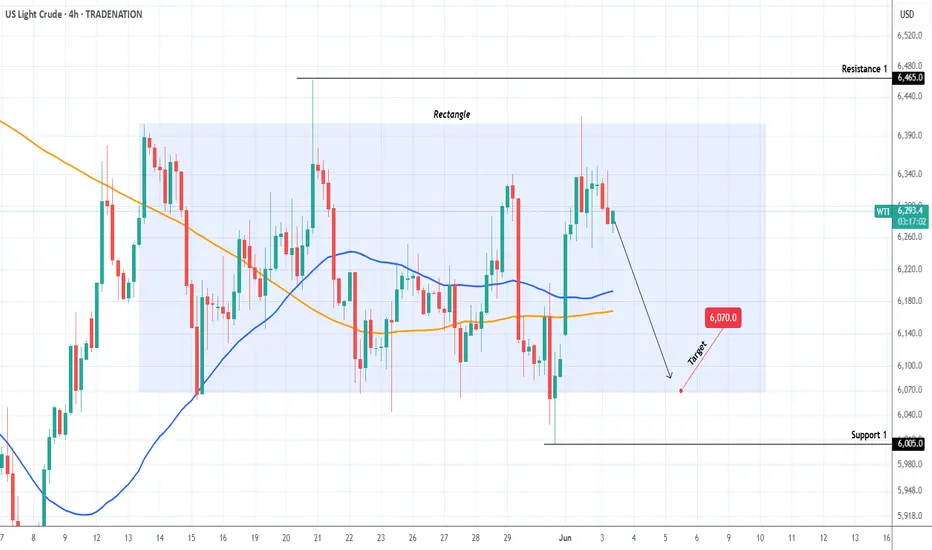
WTI OIL The perfect scalping Rectangle.WTI Oil (USOIL) has been trading within a 3-week Rectangle pattern since the May 13th High and yesterday it got rejected on its top. This is a technical sell signal, with it natural target being the bottom of the pattern at $60.70.
-------------------------------------------------------------------------------
** Please LIKE 👍, FOLLOW ✅, SHARE 🙌 and COMMENT ✍ if you enjoy this idea! Also share your ideas and charts in the comments section below! This is best way to keep it relevant, support us, keep the content here free and allow the idea to reach as many people as possible. **
-------------------------------------------------------------------------------
Disclosure: I am part of Trade Nation's Influencer program and receive a monthly fee for using their TradingView charts in my analysis.
💸💸💸💸💸💸
👇 👇 👇 👇 👇 👇
Weekly Market Forecast: Monday UPDATES!How accurate were the forecasts for S&P 500, NASDAQ, DOW JONES, Gold and Silver futures given in the Weekly Market Forecast for this week?
BULLSEYE!
Enjoy!
May profits be upon you.
Leave any questions or comments in the comment section.
I appreciate any feedback from my viewers!
Like and/or subscribe if you want more accurate analysis.
Thank you so much!
Disclaimer:
I do not provide personal investment advice and I am not a qualified licensed investment advisor.
All information found here, including any ideas, opinions, views, predictions, forecasts, commentaries, suggestions, expressed or implied herein, are for informational, entertainment or educational purposes only and should not be construed as personal investment advice. While the information provided is believed to be accurate, it may include errors or inaccuracies.
I will not and cannot be held liable for any actions you take as a result of anything you read here.
Conduct your own due diligence, or consult a licensed financial advisor or broker before making any and all investment decisions. Any investments, trades, speculations, or decisions made on the basis of any information found on this channel, expressed or implied herein, are committed at your own risk, financial or otherwise.

There remains a risk of further downside for crude oil prices.During Monday's US trading session, international oil prices rebounded strongly. The main US crude contract surged 2.5% at one point to $62.31 per barrel, while the August Brent crude futures also rose more than 2% to $64.12 per barrel. Two key drivers underlie this rally: OPEC+'s maintenance of a "modest production increase" strategy at its weekend meeting, and Ukraine's surprise attack on a Russian military airfield. The crude oil market is currently in a dual game of "policy and geopolitics": OPEC+ seeks to balance the market with "modest production increases," while Ukraine's raid serves as a reminder that black swans are never far away.
Short-term Outlook:
US oil prices may remain range-bound between $60-$64 per barrel.
However, if the Russia-Ukraine conflict deteriorates or internal rifts within OPEC+ deepen, a new round of violent volatility (sharp rallies or crashes) cannot be ruled out.
Technical Analysis:
Early trading saw oil prices consolidate in a narrow range near $61, reflecting a secondary rhythm.
The MACD indicator is bearishly diverging below the zero axis with strong bearish momentum, suggesting a risk of continued downward movement in crude oil prices during the session.
Trading Strategy:
sell@63.5-64.0
TP:61.6-62.0

Market Analysis: WTI Crude Oil Price Could Gain Bullish PaceMarket Analysis: WTI Crude Oil Price Could Gain Bullish Pace
WTI Crude Oil is gaining bullish momentum and might even test $62.75.
Important Takeaways for WTI Crude Oil Price Analysis Today
- WTI Crude Oil climbed above the $60.50 and $60.80 resistance levels.
- There was a break above a key bearish trend line with resistance at $60.80 on the hourly chart of XTI/USD at FXOpen.
WTI Crude Oil Price Technical Analysis
On the hourly chart of WTI Crude Oil at FXOpen, the price started a fresh upward move from $59.45 against the US Dollar. The price gained bullish momentum after it broke the $60.00 resistance.
The bulls pushed the price above the 50% Fib retracement level of the downward move from the $62.76 swing high to the $59.45 low. The price even climbed above the 50-hour simple moving average. Besides, there was a break above a key bearish trend line with resistance at $60.80.
It tested the $61.50 resistance zone and the 61.8% Fib retracement level of the downward move from the $62.76 swing high to the $59.45 low.
The RSI is now near the 50 level and the price could aim for more gains. If the price climbs higher again, it could face resistance near $62.00. The next major resistance is near the $62.75 level. Any more gains might send the price toward the $63.45 level or even $65.00.
Conversely, the price might correct gains and test the $60.80 support level. The next major support on the WTI Crude Oil chart is near the $59.45 zone, below which the price could test the $58.00 zone.
If there is a downside break, the price might decline toward $56.50. Any more losses may perhaps open the doors for a move toward the $55.50 support zone.
This article represents the opinion of the Companies operating under the FXOpen brand only. It is not to be construed as an offer, solicitation, or recommendation with respect to products and services provided by the Companies operating under the FXOpen brand, nor is it to be considered financial advice.

WTI Oil H1 | Falling toward an overlap supportWTI oil (USOIL) is falling towards an overlap support and could potentially bounce off this level to climb higher.
Buy entry is at 61.52 which is an overlap support that aligns with the 38.2% Fibonacci retracement.
Stop loss is at 59.60 which is a level that lies underneath a multi-swing-low support.
Take profit is at 63.00 which is a swing-high resistance.
High Risk Investment Warning
Trading Forex/CFDs on margin carries a high level of risk and may not be suitable for all investors. Leverage can work against you.
Stratos Markets Limited (tradu.com ):
CFDs are complex instruments and come with a high risk of losing money rapidly due to leverage. 63% of retail investor accounts lose money when trading CFDs with this provider. You should consider whether you understand how CFDs work and whether you can afford to take the high risk of losing your money.
Stratos Europe Ltd (tradu.com ):
CFDs are complex instruments and come with a high risk of losing money rapidly due to leverage. 63% of retail investor accounts lose money when trading CFDs with this provider. You should consider whether you understand how CFDs work and whether you can afford to take the high risk of losing your money.
Stratos Global LLC (tradu.com ):
Losses can exceed deposits.
Please be advised that the information presented on TradingView is provided to Tradu (‘Company’, ‘we’) by a third-party provider (‘TFA Global Pte Ltd’). Please be reminded that you are solely responsible for the trading decisions on your account. There is a very high degree of risk involved in trading. Any information and/or content is intended entirely for research, educational and informational purposes only and does not constitute investment or consultation advice or investment strategy. The information is not tailored to the investment needs of any specific person and therefore does not involve a consideration of any of the investment objectives, financial situation or needs of any viewer that may receive it. Kindly also note that past performance is not a reliable indicator of future results. Actual results may differ materially from those anticipated in forward-looking or past performance statements. We assume no liability as to the accuracy or completeness of any of the information and/or content provided herein and the Company cannot be held responsible for any omission, mistake nor for any loss or damage including without limitation to any loss of profit which may arise from reliance on any information supplied by TFA Global Pte Ltd.
The speaker(s) is neither an employee, agent nor representative of Tradu and is therefore acting independently. The opinions given are their own, constitute general market commentary, and do not constitute the opinion or advice of Tradu or any form of personal or investment advice. Tradu neither endorses nor guarantees offerings of third-party speakers, nor is Tradu responsible for the content, veracity or opinions of third-party speakers, presenters or participants.

BRIEFING Week #22 : Still waiting for OilHere's your weekly update ! Brought to you each weekend with years of track-record history..
Don't forget to hit the like/follow button if you feel like this post deserves it ;)
That's the best way to support me and help pushing this content to other users.
Kindly,
Phil

Weekly Market Forecast: Stocks, Gold, Silver & Crude OilIn this Weekly Market Forecast, we will analyze the S&P 500, NASDAQ, DOW JONES, Gold and Silver futures, for the week of June 2 - 6th.
Stock Indices are looking more bullish than bearish. Valid buys only!
Gold is moving sideways. Wait for confirmation before a buy/sell signal.
Oil prices may tick lower. Trade carefully.
Enjoy!
May profits be upon you.
Leave any questions or comments in the comment section.
I appreciate any feedback from my viewers!
Like and/or subscribe if you want more accurate analysis.
Thank you so much!
Disclaimer:
I do not provide personal investment advice and I am not a qualified licensed investment advisor.
All information found here, including any ideas, opinions, views, predictions, forecasts, commentaries, suggestions, expressed or implied herein, are for informational, entertainment or educational purposes only and should not be construed as personal investment advice. While the information provided is believed to be accurate, it may include errors or inaccuracies.
I will not and cannot be held liable for any actions you take as a result of anything you read here.
Conduct your own due diligence, or consult a licensed financial advisor or broker before making any and all investment decisions. Any investments, trades, speculations, or decisions made on the basis of any information found on this channel, expressed or implied herein, are committed at your own risk, financial or otherwise.

USOIL: Bullish Forecast & Bullish Scenario
The price of USOIL will most likely increase soon enough, due to the demand beginning to exceed supply which we can see by looking at the chart of the pair.
Disclosure: I am part of Trade Nation's Influencer program and receive a monthly fee for using their TradingView charts in my analysis.
❤️ Please, support our work with like & comment! ❤️

Natural Gas | Oil | Dollar | Silver | Gold Price ForecastNatural Gas | Oil | Dollar | Silver | Gold Price Forecast
NYMEX:NG1! NYMEX:CL1! COMEX:GC1! COMEX:SI1!

Gold 01.06.2025, SundayExpecting bullish price delivery on gold to make a All Time Highs. Before the meltdown on the quarterly Fair Value Gap

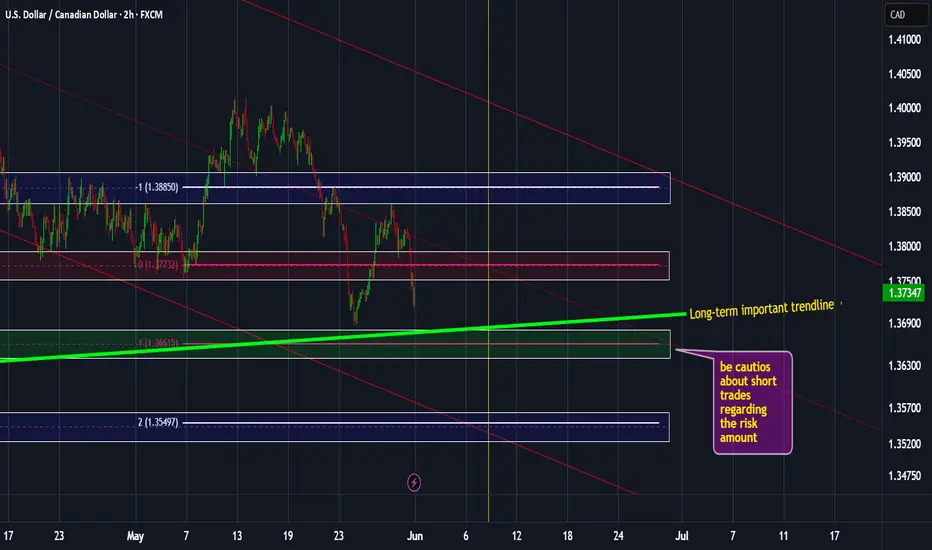
USDCAD weekly analysis: Jun 1, 2025 – Jun 7, 2025Most important news and situations are for this pair.
1st, BOC rate decision week!
2nd, Iran-US negotiations that could make a real difference to oil markets.
3rd, The relatively strong long-term bullish trendline.
*******************************************************************
The indicated levels are determined based on the most reaction points and the assumption of approximately equal distance between the zones.
Some of these points can also be confirmed by the mathematical intervals of Murray.
You can enter with/without confirmation. IF you want to take confirmation you can use LTF analysis, Spike move confirmation, Trend Strength confirmation and ETC.
SL could be placed below the zone or regarding the LTF swings.
TP is the next zone or the nearest moving S&R, which are median and borders of the drawn channels.
*******************************************************************
Role of different zones:
GREEN: Just long trades allowed on them.
RED: Just Short trades allowed on them.
BLUE: both long and short trades allowed on them.
WHITE: No trades allowed on them! just use them as TP points
The bears continue to dominate!Oil prices fluctuated lower this week, primarily pressured by the repeated U.S. tariff policies and expectations of OPEC+ production increases. During Friday's Asian session, Brent crude oil futures fell 0.41% to $63.89 per barrel, while U.S. WTI crude oil futures declined 0.44% to $60.67. The Brent July futures contract is set to expire on Friday. The tariffs imposed by U.S. President Trump were originally suspended, but the U.S. Federal Appellate Court temporarily reinstated them on Thursday, overturning the trade court's suspension ruling made on Wednesday. This legal volatility caused oil prices to plummet by more than 1% on Thursday.
The crude oil market this week has shown high sensitivity, influenced not only by legal rulings but also by dual pressures from geopolitical tensions and internal coordination imbalances within the organization. Under the intertwined effects of tariffs and production expectations, oil prices have struggled to achieve directional breakthroughs. If OPEC+ fails to reach an agreement on production control and demand from Asian countries and other major consumers has not recovered, oil prices are likely to maintain a weak oscillating pattern in the coming weeks. The MACD indicator is opening downward below the zero axis, with strong bearish momentum, suggesting a risk of further downside for crude oil during the day.
Overall, for next week's crude oil trading strategy, He Bosheng recommends focusing on bearish trades on rebounds, complemented by bullish trades on pullbacks.
Humans need to breathe, and perfect trading is like breathing—maintaining flexibility without needing to trade every market swing. The secret to profitable trading lies in implementing simple rules: repeating simple tasks consistently and enforcing them strictly over the long term.
Trading Strategy:
sell@61.5-62,0
TP:59.5-60.0

#202522 - priceactiontds - weekly update - wti crude oil futuresGood Day and I hope you are well.
comment: 3 weeks inside a tight range but market keeps getting rejected under the weekly 20ema and it’s consecutive bear bars now. Below 59.8 I favor the bears for more downside.
current market cycle: monthly time frame is a broad bear channel - weekly tf is a bear wedge - daily is a trading range
key levels: 55 - 64
bull case: Bulls need a daily close above 64 to retest the bear trend line of this big bear wedge from the January high 78.1. That’s the whole story for now. Market oscillates around 61 without any momentum, so buy low, sell high until it stops working.
Invalidation is below 59.8.
bear case: Bears need a daily close below 59.8 for more downside but market has been pretty much in balance for 3 weeks around 61. Problem for the bulls is, that we closed lower again and the tails above the weekly bars are much bigger than the ones below bars. So bears are slightly favored but only very slightly.
Invalidation is above 64.4
short term: Neutral. Playing the range until it stops working but mostly only small scalps. Market is likely waiting for an end to the tariff madness which might not come.
medium-long term - Update from 2025-05-25: Need a clear break of the trading range 54 - 64 before we can come up with new targets. Bear trend (wedge) is valid until the trend line breaks.

WTI Support & Resistance LevelsThese zones have been generated using a custom-built software tool, developed and refined over an extended period of time. The tool is the result of dedicated effort and research, aiming to identify high-probability support and resistance areas with precision.

USOIL: Target Is Down! Short!
Today we will analyse USOIL together☺️
The in-trend continuation seems likely as the current long-term trend appears to be strong, and price is holding below a key level of 60.844 So a bearish continuation seems plausible, targeting the next low. We should enter on confirmation, and place a stop-loss beyond the recent swing level.
❤️Sending you lots of Love and Hugs❤️
