WTI on high time frame
"Hello traders, focusing on WTI crude oil, the price surged to $78 but sharply retreated to the $65 zone. Over the last five days, the price has consolidated. I believe that the signals from the recent 4-hour candle suggest a potential move towards higher prices, with the next target possibly being around $72. I will be monitoring the price action around $72 closely for a potential rejection or continuation towards even higher prices."
If you need further assistance or have additional insights to share, feel free to let me know.
Oil

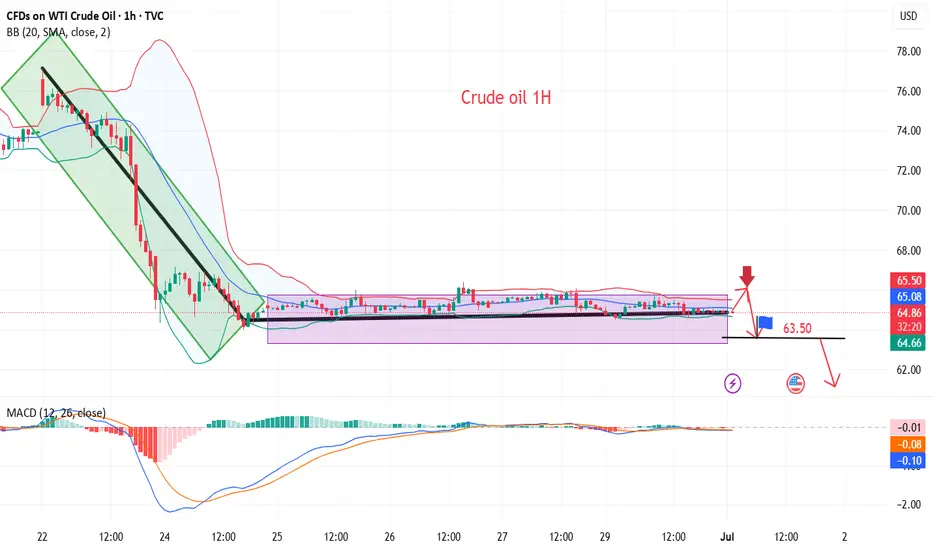
#USOIIL #WTI 1H📈 #USOIL 1H Buy Setup – Liquidity Sweep in Play
Crude Oil is consolidating after a sharp decline, forming a potential setup for a liquidity sweep below the current range, followed by a bullish reversal. We're anticipating a fakeout move to grab sell-side liquidity before price targets the Fair Value Gap (FVG) and premium supply zone above.
🟩 Buy Limit: 64.50 / 64.00
🎯 Targets: 70.00 → 72.00+
❌ Stop Loss: 63.00
This setup offers high risk-to-reward potential if the liquidity sweep plays out as expected. Monitor price action closely at the buy zone.
#CrudeOil #WTI #SmartMoney #TradingStrategy

Crude oil continues to correct, short-term ideas
💡Message Strategy
WTI crude oil prices recovered from a two-week low but remained about $12 below the previous Monday's high as upside was limited by Middle East peace and expectations that OPEC+ countries will agree to increase supply again this week.
📊Technical aspects
From the daily chart level, crude oil fluctuates upward in the medium term and tests around 75. The K-line closes with a large real negative line, which has not yet destroyed the moving average system and is still supported. The medium-term objective upward trend remains unchanged.
However, from the perspective of momentum, the MACD indicator crosses downward above the zero axis, indicating that the bullish momentum is weakening. It is expected that the medium-term trend of crude oil will fall into a high-level oscillation pattern.
The short-term trend of crude oil (1H) continues to fluctuate in a narrow range, and the oil price falls back to the lower edge of the range. Pay attention to the support strength of 64. In terms of momentum, the MACD indicator is at the zero axis position, and the long and short forces are equal. It is expected that the trend of crude oil will maintain a fluctuating consolidation pattern during the day.
💰Strategy Package
Short Position:65.50-66.50,SL:67.50,Target: 64.00-63.00
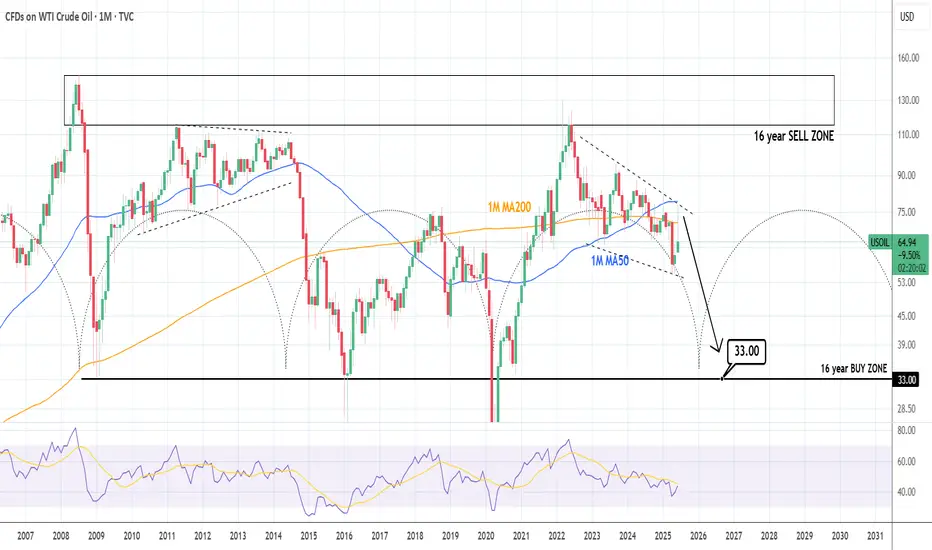
WTI CRUDE OIL: Brutal collapse expectedWTI Crude Oil has turned bearish again on its 1D technical outlook (RSI = 44.990, MACD = 0.310, ADX = 38.289) and is expected to accelerate the effect as based on the 16 year Cycles, late 2025 and most of 2026 should experience a price collapse. The most optimal Buy Zone starts at $33.00, it could go lower but that's a solid base from which to expect a bounce back above $110.00 by 2028.
## If you like our free content follow our profile to get more daily ideas. ##
## Comments and likes are greatly appreciated. ##
Latest Long - Short Trading Recommendations for Crude OilDuring Monday's Asian trading session, international oil prices fell, primarily due to the combined impact of eased geopolitical tensions in the Middle East and expectations of OPEC+ production increases, which raised market supply outlooks. Although the two major benchmark oil prices recorded their largest weekly decline since March 2023 last week, they are still set to post consecutive monthly gains for June, with increases exceeding 5% each. The market had previously surged due to Middle East tensions. Since Israel struck Iranian nuclear facilities on June 13, the situation rapidly deteriorated, and the U.S. subsequently air-raided Iranian nuclear targets, pushing Brent prices to briefly surge above $80 per barrel. Current oil price movements are clearly constrained by a dual influence of geopolitics and supply expectations. While geopolitical conflicts have temporarily eased, the long-term stability of the Middle East situation remains uncertain. On the other hand, the game between OPEC+'s orderly production increase and insufficient U.S. shale oil production momentum will determine the direction of oil price fluctuations in the coming months. Against the backdrop of a moderate global economic recovery, oil prices maintaining a range of $60-70 per barrel may become a short-term norm.
you are currently struggling with losses,or are unsure which of the numerous trading strategies to follow,You have the option to join our VIP program. I will assist you and provide you with accurate trading signals, enabling you to navigate the financial markets with greater confidence and potentially achieve optimal trading results.
Trading Strategy:
sell@66.3-66.9
TP:63.1-63.3

Crude Oil Weekly OutlookNYMEX:CL1! NYMEX:MCL1!
With Nasdaq futures hitting all-time highs, our attention now turns to Crude Oil, which has seen a sharp pullback over the past week.
All-time highs in equity indices present a unique challenge:
There are no historical reference points—no prior price or volume data to lean against. Traders typically turn to tools like Fibonacci extensions, measured moves, or rely on market-generated information and emerging intraday levels before making decisions.
What Has the Market Done?
Crude Oil Futures (CL) posted a record drop last week, falling sharply from a Sunday open high of $78.40 to a Monday close low of $64.38—a $14.02 decline.
This sharp sell-off followed developments suggesting a potential Iran–Israel ceasefire and the end of a two-week conflict, prompting markets to rapidly unwind the geopolitical risk premium.
What is it trying to do?
CL Futures have since consolidated around the 2025 mid-range. The market appears to be in a balancing phase, digesting the removal of war-related premiums and recalibrating based on fundamentals.
How Good of a Job Is It Doing?
Having effectively priced out war risk, the market is now refocusing on fundamentals.
The global demand outlook is improving, driven in part by progress in trade deals.
OPEC’s June Monthly Oil Market Report (MOMR) forecasts global oil demand growth of 1.3 mb/d for 2025.
This transition from headline risk to fundamental drivers indicates market maturity and resilience, albeit within a still-volatile regime.
What Is More Likely to Happen From Here?
Today marks the final trading day of the month, and seasonal demand will become increasingly relevant.
Summer weather and travel activity are expected to drive demand for jet fuel and gasoline.
These seasonal tailwinds, if sustained, could help stabilize price action around key technical zones.
Key Levels:
yOpen: 67.65
pHi: 66.09
pIB Hi: 66
2025 mid-range: 65.39
pLow: 64.80
Overnight Low: 64.55
Naked VPOC: 64.50
Scenario 1: Continued Consolidation (Balance Holds)
Crude oil maintains range-bound behavior.
Strategy: “Outside-in” trading—fade moves at range extremes until new directional information emerges.
Scenario 2: Break from Balance
If directional conviction builds, price could break the current consolidation.
Upside target: Yearly open near $67.65.
Downside risk: March 2025 low if $64.40 fails.
All intraday levels noted above should be monitored for structure and participation.

USOIL:Sharing of the Latest Trading StrategyAll the trading signals last week have resulted in profits!!! Check it!!!👉👉👉
Fundamental Analysis:
The ceasefire agreement between Israel and Iran has eased tensions in the Middle East, the primary factor behind the recent decline in oil prices. Meanwhile, market rumors suggest the U.S. may ease sanctions on Iran, which—if realized—would raise expectations of increased crude supply and further pressure oil prices.
Additionally, OPEC+ plans to continue increasing production by 411,000 barrels per day in July, with supply growth expectations exerting long-term downward pressure on oil.
Technical Analysis (4-Hour Chart):
USOIL prices have pulled back from highs and currently hover near $65.20, approaching the S2 pivot point at around $64.69 and the 4-hour 200-period moving average. The prior appearance of a long candlestick may signal short-term support.
Notwithstanding, the current market remains in a bearish trend, so the strategy prioritizes buying on rebounds.
Trading Strategy:
Sell@67-66
TP:65-64

OIL |Bearish Pressure Builds as OPEC+ Prepares Fresh Output Hike OIL | Market Overview
Oil prices edged lower on Monday despite strong seasonal demand, as the market prepares for an increase in supply. OPEC+ is set to raise production by 411,000 barrels per day starting Tuesday, marking the fourth monthly increase in output. Another similar hike is reportedly under consideration for August, which may further pressure prices.
Technical Outlook
The price remains within the bearish zone and is expected to continue its decline as long as it trades below the pivot level at 65.83.
A daily candle close above 65.83 is required to confirm a potential bullish reversal.
Until then, the bearish trend remains intact, targeting 63.47, 61.83, and potentially 60.16.
Key Levels
Pivot: 65.83
Support: 63.47 / 61.83 / 60.16
Resistance: 68.33 / 69.55

Market Analysis: Oil Slides — Traders Eye Macro TriggersMarket Analysis: Oil Slides — Traders Eye Macro Triggers
WTI Crude oil is down over 15% and remains at risk of more losses.
Important Takeaways for WTI Crude Oil Price Analysis Today
- WTI Crude oil extended losses below the $68.00 support zone.
- A major bearish trend line is forming with resistance near $65.60 on the hourly chart of XTI/USD at FXOpen.
Technical Analysis of WTI Crude Oil Price
On the hourly chart of WTI Crude Oil at FXOpen, the price struggled to continue higher above $77.00 against the US Dollar. The price formed a short-term top and started a fresh decline below $72.00.
There was a steady decline below the $70.00 pivot level. The bears even pushed the price below $68.00 and the 50-hour simple moving average. Finally, the price tested the $63.70 zone. The recent swing low was formed near $63.69, and the price is now consolidating losses.
On the upside, immediate resistance is near the $65.60 zone. There is also a major bearish trend line forming with resistance near $65.60. The next resistance is near the $66.80 level or the 23.6% Fib retracement level of the downward move from the $76.93 swing high to the $63.69 low.
The main resistance is $70.30 and the 50% Fib retracement level. A clear move above the $70.30 zone could send the price toward $71.90.
The next key resistance is near $76.90. If the price climbs further higher, it could face resistance near $78.00. Any more gains might send the price toward the $80.00 level.
Immediate support is near the $63.70 level. The next major support on the WTI Crude Oil chart is near $62.00. If there is a downside break, the price might decline toward $60.00. Any more losses may perhaps open the doors for a move toward the $55.00 support zone.
This article represents the opinion of the Companies operating under the FXOpen brand only. It is not to be construed as an offer, solicitation, or recommendation with respect to products and services provided by the Companies operating under the FXOpen brand, nor is it to be considered financial advice.

WTI Oil H1 | Rising into an overlap resistanceWTI oil (USOIL) is rising towards an overlap resistance and could potentially reverse off this level to drop lower.
Sell entry is at 66.82 which is an overlap resistance that aligns closely with the 23.6% Fibonacci retracement.
Stop loss is at 70.90 which is a level that sits above the 50% Fibonacci retracement and a pullback resistance.
Take profit is at 62.51 which is a multi-swing-low support.
High Risk Investment Warning
Trading Forex/CFDs on margin carries a high level of risk and may not be suitable for all investors. Leverage can work against you.
Stratos Markets Limited (tradu.com ):
CFDs are complex instruments and come with a high risk of losing money rapidly due to leverage. 63% of retail investor accounts lose money when trading CFDs with this provider. You should consider whether you understand how CFDs work and whether you can afford to take the high risk of losing your money.
Stratos Europe Ltd (tradu.com ):
CFDs are complex instruments and come with a high risk of losing money rapidly due to leverage. 63% of retail investor accounts lose money when trading CFDs with this provider. You should consider whether you understand how CFDs work and whether you can afford to take the high risk of losing your money.
Stratos Global LLC (tradu.com ):
Losses can exceed deposits.
Please be advised that the information presented on TradingView is provided to Tradu (‘Company’, ‘we’) by a third-party provider (‘TFA Global Pte Ltd’). Please be reminded that you are solely responsible for the trading decisions on your account. There is a very high degree of risk involved in trading. Any information and/or content is intended entirely for research, educational and informational purposes only and does not constitute investment or consultation advice or investment strategy. The information is not tailored to the investment needs of any specific person and therefore does not involve a consideration of any of the investment objectives, financial situation or needs of any viewer that may receive it. Kindly also note that past performance is not a reliable indicator of future results. Actual results may differ materially from those anticipated in forward-looking or past performance statements. We assume no liability as to the accuracy or completeness of any of the information and/or content provided herein and the Company cannot be held responsible for any omission, mistake nor for any loss or damage including without limitation to any loss of profit which may arise from reliance on any information supplied by TFA Global Pte Ltd.
The speaker(s) is neither an employee, agent nor representative of Tradu and is therefore acting independently. The opinions given are their own, constitute general market commentary, and do not constitute the opinion or advice of Tradu or any form of personal or investment advice. Tradu neither endorses nor guarantees offerings of third-party speakers, nor is Tradu responsible for the content, veracity or opinions of third-party speakers, presenters or participants.

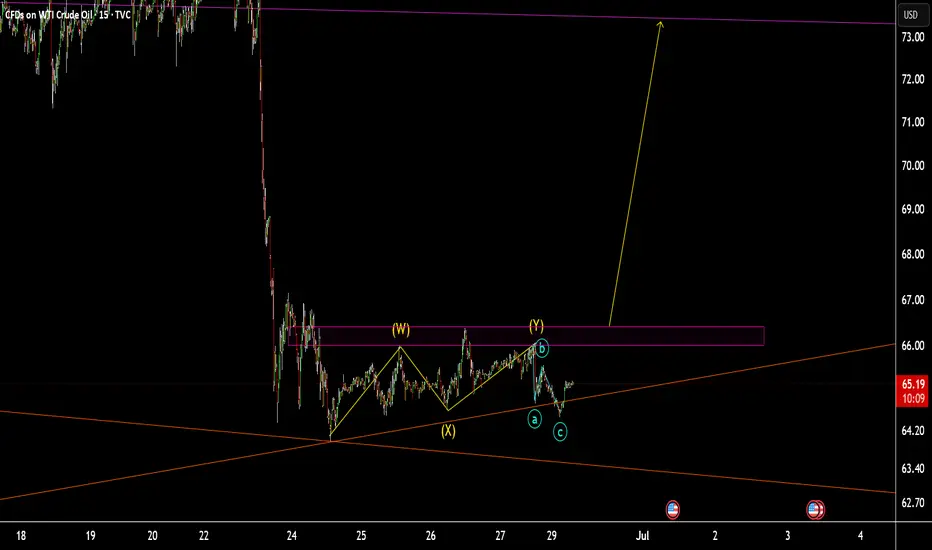
USOIL TVC:USOIL :
if it break above the purple line and shows a accumulation. so I am going to buy it.
but if it doesn't I will not open trade on it.
Risk On! Buy Stock Indices, Sell Gold, Silver.In this Weekly Market Forecast, we will analyze the S&P 500, NASDAQ, DOW JONES, Gold and Silver futures, for the week of June 29 - July 4th..
Stock Indices are pointed to the all time highs. Take advantage of the "risk on" environment while it lasts!
Gold and Silver have seen the outflows and profit taking... so look for lower prices this week.
Oil ... be patient. After a huge dump in prices when the tensions eased up between Israel/US and Iran, price is moving sideways in consolidation. I suspect lower prices to come, but I urge patience! Wait for the signature of price to show it intends to move lower. A sweep of the range highs and a run of the range lows right after... is the signal to sell.
Enjoy!
May profits be upon you.
Leave any questions or comments in the comment section.
I appreciate any feedback from my viewers!
Like and/or subscribe if you want more accurate analysis.
Thank you so much!
Disclaimer:
I do not provide personal investment advice and I am not a qualified licensed investment advisor.
All information found here, including any ideas, opinions, views, predictions, forecasts, commentaries, suggestions, expressed or implied herein, are for informational, entertainment or educational purposes only and should not be construed as personal investment advice. While the information provided is believed to be accurate, it may include errors or inaccuracies.
I will not and cannot be held liable for any actions you take as a result of anything you read here.
Conduct your own due diligence, or consult a licensed financial advisor or broker before making any and all investment decisions. Any investments, trades, speculations, or decisions made on the basis of any information found on this channel, expressed or implied herein, are committed at your own risk, financial or otherwise.

#202526 - priceactiontds - weekly update - wti crude oil futuresGood Day and I hope you are well.
#mcl1 - wti crude oil futures
comment: Yeah I don’t know about this one. Your guess is as good as mine. I could even see this touching 63 before going higher again. Most erratic and extreme price action the past 2 weeks, so maybe wait a bit before jumping the train here.
current market cycle: trading range
key levels: 63 - 80
bull case: Bulls don’t have much. They could not close one decent bar at the high since 2025-06-11 and despite all the bull spikes, we only sold afterwards and are back below 65 where the extreme breakout happened. Best guess here is that we stay above 63 and go sideways. Sideways up to where? No idea. Could be 68, could be 70.
Invalidation is below 63
bear case: Too extreme. Both sides have to take quick profits or the next spike will take them away again. So most likely sideways in a range until a newsbomb hit again. Range could be 63 - 68.
Invalidation is above 79
short term: Neutral. Not touching this unless someone threatens me with a gun.
medium-long term - Update from 2025-06-22: Let’s leave this as “todo” for now. No read on this and I won’t make stuff up just to post something.

Gold | Oil | Dollar | Silver | Natural Gas Price Forecast.Gold | Oil | Dollar | Silver | Natural Gas Price Forecast.
NYMEX:NG1! COMEX:GC1! AMEX:UNG COMEX:SI1!

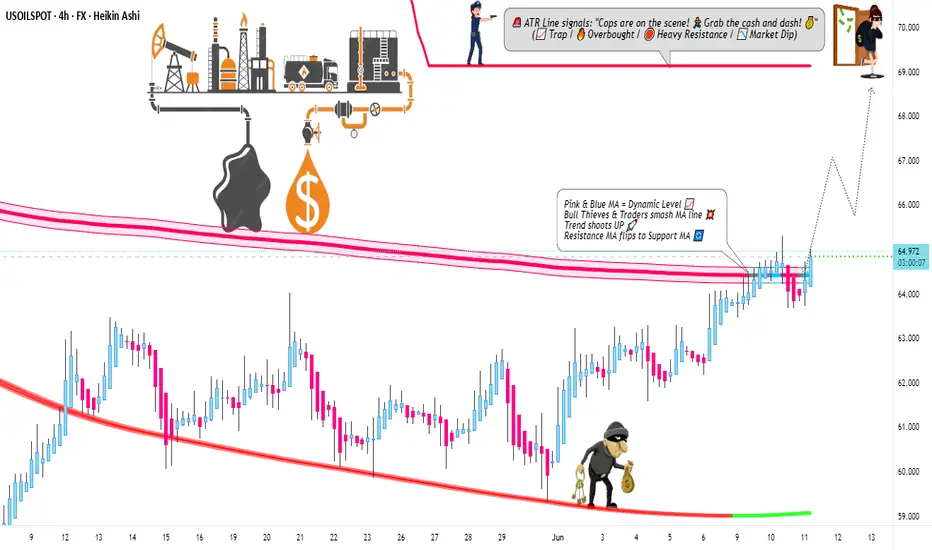
Bulls on the Loose: US Oil Spot/WTI Heist Strategy! 🚨💰 THE OIL VAULT HEIST: US OIL SPOT/WTI TRADING STRATEGY 💸🔫
🌟Hi! Hola! Ola! Bonjour! Hallo! Marhaba!🌟
Dear Money Makers & Robbers 🤑💰💸✈️
Based on our 🔥Thief Trading style analysis🔥 (both technical and fundamental), here’s the master plan to heist the US Oil Spot/WTI Energy Market. Follow the blueprint carefully—this strategy focuses on long entries, with a daring escape planned near the high-risk Red ATR line Zone where bearish robbers and consolidation traps await. 🏆💸 Take your profit and treat yourself, fellow traders—you earned it! 💪🏆🎉
🕵️♂️ Entry 📈
💥 The vault is wide open! Time to swipe that bullish loot—heist is on!
Place buy limit orders within the 15 or 30-minute timeframe, near swing lows/highs for pullback entries.
🛑 Stop Loss 🛑
📍 Thief’s SL—recent swing low and below the moving average (4H timeframe) for day/swing trades.
📍 Adjust SL based on risk, lot size, and number of orders.
🎯 Target
🏴☠️💥 69.000 (Aim for the big loot!) OR escape before the target
🔥 Market Heist Overview
The UK Oil Spot/Brent market is currently showing bullishness 🐂, driven by key factors—perfect for a day/scalping trade robbery! ☝☝☝
📰 Additional Tools & Analysis
📊 Get the Fundamental, Macro, COT Report, Quantitative Analysis, Sentiment Outlook, Intermarket Analysis, Future Targets—check our bi0 liinks 👉👉👉🔗🔗
⚠️ Trading Alert: News Releases & Position Management
📰 News can rattle the vault! 💥
✅ Avoid new trades during news releases.
✅ Use trailing stop-loss orders to protect profits.
💖 Supporting our heist plan?
💥 Smash the Boost Button 💥 to empower the robbery team.
Let’s make money every day in this market with the Thief Trading Style! 🏆💪🤝❤️🎉🚀
👀 Stay tuned for the next robbery plan, thieves! 🤑🐱👤🤗🤩
USOIL The Target Is UP! BUY!
My dear friends,
USOIL looks like it will make a good move, and here are the details:
The market is trading on 65.03 pivot level.
Bias - Bullish
Technical Indicators: Supper Trend generates a clear long) signal while Pivot Point HL is currently determining the overall Bullish trend of the market.
Goal - 68.89
Recommended Stop Loss - 63.01
About Used Indicators:
Pivot points are a great way to identify areas of support and resistance, but they work best when combined with other kinds of technical analysis
Disclosure: I am part of Trade Nation's Influencer program and receive a monthly fee for using their TradingView charts in my analysis.
———————————
WISH YOU ALL LUCK

USOIL HEIST ALERT: Thief Entry Loaded – Target Locked!🚨 The Ultimate US OIL / WTI Heist Plan – Thief Trading Style 🎯💸
Hey Money Makers, Hustlers, Market Bandits! 🌍
Hola, Ola, Bonjour, Hallo, Marhaba! 👋🌟
We’re back with a slick WTI energy market heist based on our 🔥Thief Trading Style🔥—powered by a mix of technical & fundamental strategies. The vault is wide open and the bullish loot awaits!
🗺️ Strategy Brief:
We’re aiming for a clean bullish getaway near the high-risk MA zone—where traps are set and bearish robbers lurk. Watch out for overbought zones, trend reversals, and consolidation ambushes.
📈 Entry Point:
“The vault is open! Enter the bullish heist at will.”
Look to place Buy Limit Orders around swing highs/lows or pullback levels on the 15m–30m timeframe.
🛑 Stop Loss:
Set your Thief SL around the recent swing low using the 3H timeframe (example: 60.300).
Adjust based on your risk appetite, lot size, and number of entries.
🎯 Target: 65.200
That's where we celebrate the score, traders! 🥂💸
📊 Heist Justification (Fundamentals + Sentiment):
The WTI market is currently bullish, fueled by a mix of:
✅ Macro economics
✅ COT data
✅ Seasonal trends
✅ Intermarket signals
✅ Inventory & storage dynamics
📌 For full analysis and future target breakdowns, check the linkk in our profilee 🔗👀
⚠️ Important Alert – Manage Your Risk During News:
🚫 Avoid fresh entries during major news releases
✅ Use trailing stops to protect running gains
Stay sharp, stay safe.
💥 Hit the Boost Button if you support the Thief Strategy!
Join the crew, ride the wave, and let’s rob the market like pros 💼🕶️💰
📅 Stay tuned for the next master plan. Another heist is always around the corner.
Until then – steal smart, win big! 🐱👤🔥

Analysis of Crude Oil's Opening Market Strategy on MondayWTI crude oil futures stabilized for the second consecutive day, maintaining fluctuations within the broad range of Tuesday and oscillating around the key level of $65.12. A sustained break below this level would confirm the resurgence of selling pressure, and a breach of $64.00 could trigger a decline toward $61.90. On the upside, if the price holds above $65.12, it may drive a short-term rebound to $67.44, and if momentum strengthens, it could further test $71.20.
Crude oil prices remain range-bound, but downward pressure is building. Robust U.S. demand provides support, yet macroeconomic caution and uncertainties over OPEC+ intentions are suppressing market sentiment. A decisive break below $65.12 would confirm the bearish trend, with bears targeting $61.90. Conversely, if this level holds, neutral-to-bullish logic remains valid, though upside potential remains constrained unless supply-demand signals converge overall.
you are currently struggling with losses,or are unsure which of the numerous trading strategies to follow,You have the option to join our VIP program. I will assist you and provide you with accurate trading signals, enabling you to navigate the financial markets with greater confidence and potentially achieve optimal trading results.
Trading Strategy:
buy@63.1-63.3
TP:66.3-69.9

Brent Oil – Bearish Break or Bounce from Long-Term Support?Brent Oil is hovering just above critical support near 66.00, with a clear bearish structure visible across timeframes:
🔎 15m & 1h:
Price action is consolidating near the ascending support trendline drawn from early June lows. Short-term price structure shows lower highs and lower lows, suggesting continued downside pressure.
📉 4h & 1D:
The recent sell-off from above 78.00 has pushed Brent back into the lower region of the broad descending channel. Daily and 4h charts show price testing confluence between the horizontal support at ~66.00 and a long-term rising trendline. A confirmed close below this level could accelerate bearish momentum towards 64.00 or even 62.00.
⚠️ Key Levels:
• Support: 66.00, 64.00, 62.00
• Resistance: 67.00, 69.00
• Bias: Bearish – price remains in a clear downtrend unless buyers reclaim above 67.50 with strong volume.
📌 Outlook:
As long as Brent holds below 67.00 and the descending trendline caps rallies, my bias is bearish. A breakdown of 66.00 on higher timeframes would open the door for a move towards lower channel support levels. However, if buyers defend and push back above 67.50, we could see a short-term relief rally.

USOIL: Long Trading Opportunity
USOIL
- Classic bullish pattern
- Our team expects retracement
SUGGESTED TRADE:
Swing Trade
Buy USOIL
Entry - 65.03
Stop - 62.60
Take - 69.73
Our Risk - 1%
Start protection of your profits from lower levels
Disclosure: I am part of Trade Nation's Influencer program and receive a monthly fee for using their TradingView charts in my analysis.
❤️ Please, support our work with like & comment! ❤️

BRIEFING Week #26 : Are we going for a Bubble ?Here's your weekly update ! Brought to you each weekend with years of track-record history..
Don't forget to hit the like/follow button if you feel like this post deserves it ;)
That's the best way to support me and help pushing this content to other users.
Kindly,
Phil

USOIL: Next Move Is Up! Long!
My dear friends,
Today we will analyse USOIL together☺️
The recent price action suggests a shift in mid-term momentum. A break above the current local range around 65.100 will confirm the new direction upwards with the target being the next key level of 65.468 and a reconvened placement of a stop-loss beyond the range.
❤️Sending you lots of Love and Hugs❤️

Cautious — this Chart is Slippery!Hello TradingView Family / Fellow Traders. This is Richard, also known as theSignalyst.
🛢️After surging by over 35% in the past two weeks, USOIL took a hit following Trump's announcement of a ceasefire between Iran and Israel.
However, from a technical perspective, USOIL is approaching a strong daily support zone marked in red.
As long as this support holds, the bulls remain in control.
📊The next bullish impulse will be confirmed upon a break above the last minor high marked in blue.
In such a scenario, a move toward the supply zone (also marked in red) would be expected.
📚 Always follow your trading plan regarding entry, risk management, and trade management.
Good luck!
All Strategies Are Good; If Managed Properly!
~Rich
