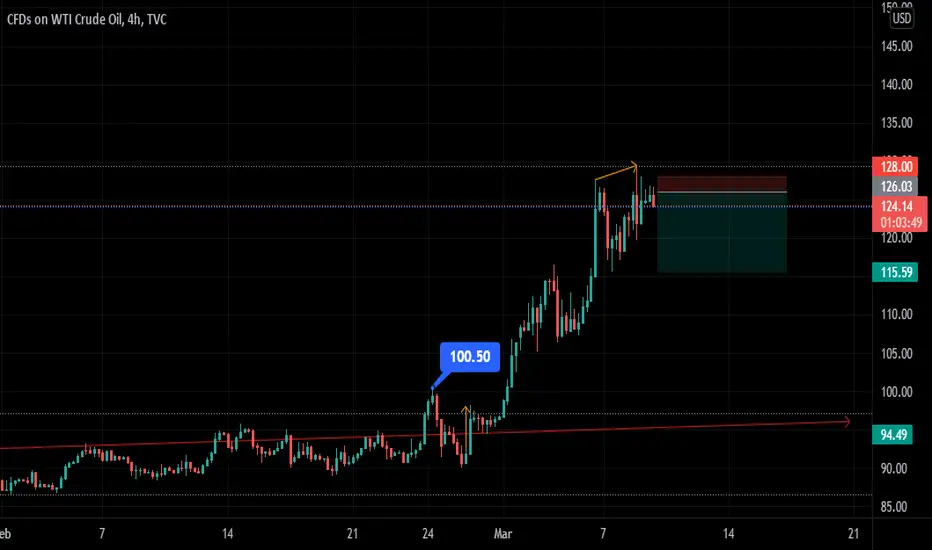
OIL ANALYSIS (SHORT TERM) Helloooooooooo PIPPIN PEEPS!! Scalping opportunity. 1:5 risk to reward. Trade with care.
Oilanalysis
Oil Analysis: Oil may test above $107/Barrel
The crude oil price broke the history in April 2020 and moved back to $00.barrel less than two years ago though the crude oil price is now $92 / barrel.
Due to the Corona effect, crude oil prices have been low for a long time, but crude oil prices have been rising steadily since April 2020 due to rising demand.
However, there is no doubt that crude oil has risen sharply in recent weeks due to the Russia-Ukraine issue because Russia is the largest energy supplier to Europe.
Although Russia is not a member of OPEC, it is one of the world's largest exporters of crude oil. The Middle East crisis also has been responsible for the volatile oil market for years.
Crude oil prices have plummeted due to the smuggling of special ISIS oil stealing. The US also has given economic sanctions on Iran. That's why it has forced Iran to sell crude oil at much lower prices to several countries, including China.
The international community has deliberately destabilized the oil market. The oil price is much higher now, so it was natural for oil-exporting countries to increase supply, but crude oil prices are not falling due to several geopolitical issues.
However, if this geopolitical problem is not resolved in the foreground, the price of crude oil may soon exceed $100 per barrel.
Oil price is directly involved in inflation. If the price of crude oil goes up worldwide, the price of every goods and service will go up in the developed world. Commodity prices can create hyperinflation when the purchasing power of the ordinary person goes out. In that case, it is not uncommon for the world to move towards another economic recession.
Technical Analysis:
The current crude oil price is $92 / barrel. The market has dropped a bit from last week's trendline resistance. And from the current rate, the trendline support price is $85.63 / barrel.
If next week the Russia-Ukraine issue declines or does not rise further, there is a possibility of a slight drop in crude oil price correction. But until then, crude oil prices won't drop much.
However, if the price of crude oil falls below $85/barrel for some reason, the market will first test $77.50/ barrel. And the next target is 65/62 dollars/barrel.
However, Crude prices can only drop if the geopolitical problem resolves or an announcement from OPEC increases oil extraction. Although so far, no such symptoms have been seen.
On the other hand, if the Russia-Ukraine problem escalates further, the market will test $97 / barrel again. The next target is $100 / barrel, and the last $107 / barrel is more likely to be tested this year.
However, for some reason, it is better to stay in buy mode on crude oil, especially if it is available at $75/73 / barrel. It may be better to stay in buy mode with a few pips stop loss.
.
Because as the days go by, the global crisis continues to grow, and oil prices have been low for a long time because of Covid-19. Many countries have not been able to import oil. That is why there is so much demand for crude oil right now, and the demand for crude oil will probably continue to increase throughout 2022.
You have to remember resistance level should never be a good choice for buying crude oil. When the crude price comes to a support level after correction, it would be better to stay in buy mode from the support level.

RUSSIA VS UKRAINE Hello every one i said about oil 2 weeks ago now i updated this chart and added new idea about oil
ok. as you see Oil can see higher prices and after reaching the specified points can fill its inefficiencies and come down on the other hand because in this chart in the weekly time frame we have meditation and all areas of demand have been consumed can fall well after the Ukraine-Russia war
But as I said, this chart wants to experience prices from $ 105 to $ 120 and then come down.
I wish you a good day.

OILhello dear treaders any news from oil ? ok.. let me read the chart oil. first of all lets take look at the oil chart We see that oil is rising sharply Now at what price can this price increase continue? No one knows But the traces of investors can be understood from the chart. Of course, one of the factors that has oil rising in this way is the tension between Russia and Ukraine.
In the oil chart, I see resistance from $ 100 to $ 105 even higher, but it is also possible that all of this will be broken because of the Russia-Ukraine war.
But if nothing happens and there is no war, the high resistances that you see in the chart can be activated and the price will fall.
If the price falls, it falls well because there is no demand area to keep the price because they are all consumed.
At the moment, in this political crisis, I can neither signal buying nor selling, I just have to combine all of these so that I can give you the right analysis.
Good luck.

stong probabality that oil reverses down after small riseHello,
Stong probabality that oil reverses down to reach 54 $ after small rise until 74 $. otherwise, this critical prise can be the starting point to grow up.
As we said, always, we don't have a cristal ball predicting markets future but we try to be more efficient and rational when we trade.
thank you

oil we published this idea yesterday and we are gonna hit the TB soon every thing is running very great more than 400 pips in one trade in one day have a look at the idea below Congratulations to all and see you in other successful deals as we have been used to

Oil Short SetupOIL Short Setup
🔵 Entry Level: $79.76
🟢 Take Profit: $74.73 (2.92)
⛔ Stop Loss: $81.48
Reasoning:
1) Upper trendline in a descending channel
2) Support-resistance flip

Oil Short SetupOIL Short Setup
🔵 Entry Level: $82.90
🟢 Take Profit: $78.42 (2.17)
⛔ Stop Loss: $84.96
Reasoning:
1) Currently an overbought level, expecting a slight cool down after which a new move up should follow, taking us to the entry target.
2) If this setup turns out to be valid, the price should print lower high on the indicator, while making a higher high on the chart.
3) Level is coordinated with previous support, which should act as resistance now.
4) Upper trendline on a descending channel.

Oil weekly MovementHellooo...My Dragon Friends
Oil Movement, need some reversal movement.
to make another higher
Lets See
Happy Trading
Smart Trading
Money Management
Risk Management
Disclaimer On

#OIL SHORT TERM SELL OPPORTUNITYAlright first off price is in bullish Daily trend but it reached 161% of Fibonacci extension ratio and as a result of that we saw a bearish engulfing candle which tells us participants who were long in oil are probably busy with profit taking actions and as a result it is possible that we see a bearish corrective move.
If you are with me so far now lets see how we can trade oil in short time.
In 4H time frame we saw an impulsive bearish move which shifted the 4H time frame structure to bearish for the first time in long time, after that bearish impulsive move we have a bullish corrective move which you can see in 1H time frame. Now price has reached an important res area with RSI indicator divergence and also we can see 1H bearish engulfing candle which shows us price has an intention for down side move also we kind of see that in 1H time frame price also couldn't create HH and we can see a Double top formation which is another confluence for bearish move.
Now in case of trading you can probably wait for the price to come below double top neckline which is around 82.050 and then wait for the retest or you can trade it with your strategy at any given time. But it is important to remember this is a counter trend trading and the overall trend is bullish.
For targeting first target obviously would be around 80.500 and after that its kind of risky to hold the position because as I said its against the main trend.
Wish you all the best


USOIL SellAs we saw the movement on the prices of oil the last week we saw strong bullish momentum and high demand on oil during the last week
and on our opinion the OIL may make strong retracement to the south to the level of 76.50 at the level of 61.8% Fibonacci expansion
and then we might see pullback one more time to the current levels at 78.5 from that we may see continuation to the downside with high volatility
and our stop loss will be fixed above the last highest high of the whole bullish movement at the number of 80
and our targets will be 75.50 and 73.50 in sequence
use money management and don't move or remove your stop loss
trade safe

OIL weekly movement (05-12 October)hellooo...My Dragon Friends
i see OIL will going to 80 after that will correction down fast.
cause we can see some sign with Bearish Divergence at RSI and Stocastic.
Lets See
Happy Trading
Smart Trading
Money Management
Risk Management
Disclaimer On

OIL Running In 300 Pips From Last Entry , New Entry Added This is an educational + analytic content that will teach why and how to enter a trade
Make sure you watch the price action closely in each analysis as this is a very important part of our method
Disclaimer : this analysis can change at anytime without notice and it is only for the purpose of assisting traders to make independent investments decisions

OIL weekly Movement (28/09 - 05/10)Hellooo...My Dragon Friends
OIL go Uptrend...
Lets See
Happy Trading
Smart Trading
Money Management
Risk Management
Disclaimer On

USOIL Full Analysis , 2 Short Setups Valid To Catch 500 Pips !This is an educational + analytic content that will teach why and how to enter a trade
Make sure you watch the price action closely in each analysis as this is a very important part of our method
Disclaimer : this analysis can change at anytime without notice and it is only for the purpose of assisting traders to make independent investments decisions

OIL Breaking out of the bull flag or another fakeout?Hello and welcome to my post !
OIL is still in a strong uptrend and we are just breaking out from a bullflag.
We are getting strong resistances from EMA100 and MA200.
Something worth mentioning is the purple boxes on the chart, they are indicating previously fake out areas, a think that might happen if the price action dosent break the previously mentioned resistances.
If we continue from here the break of the bull flag strongly the target is 72$.
Indicators: The combination of the overbought SRSI and the mid level RSI suggest a strong momentum for the bulls.
Don't forget to protect yourself with proper Risk Management.
Information provided is only educational and should not be used to take action in the market !
Feel free to ask anything in the comments or send me a message !
Thank you for reading my post,if you liked the idea you can support with a like and a follow have a great day !

Crude Trend analysisDue to a supply scarcity, rising gas and coal prices are gradually driving utilities to convert from gas and coal to fuel oil. Oil-fired power stations have started up in Sweden. Oil demand will be boosted further by the United States' announcement that the travel ban for fully immunized international visitors would be abolished in November. This could result in a big recovery in jet fuel consumption by the end of the year. "US oil producers are battling to regain output, "The Mars and Ursa platforms in the Gulf of Mexico will be shut down until the end of2021, according to Royal Dutch Shell. According to Bloomberg projections, this would cut supplies by about 300,000 barrels."

OIL movement for this week (14-21 september 2021)Hellooo...my Dragon Friends
I see Oil Have Bearish Divergence dan i see this resistance still strong HOLD.
it will back down soon.
Lets See
Happy Trading
Smart Trading
Money Management
Risk Management
Disclaimer On

CL futures. Good level practice 70$2 days since my last idea about Oil.It gave good trade with short stop loss .With risk 20 cent we earn more than 1 dollar.Our level 70 was placed right becouse we can se that price cinfirm this level many times , byers still trying to protect this level.The main now is look where price will close today, if it will close near 70$ its not good sign, becouse all who buy over 70 have stop loss under this price.

USOIL a possible breakout soon Hello everyone, as we all know the market action discounts everything :)
_________________________________Make sure to Like and Follow if you like the idea_________________________________
The Crude Oil market has shown itself to be resilient as we had initially pulled back but now are turning around to show signs of life again.
In the last 2 weeks, the market has been moving sideways between a Resistance located between 70.40 - 71.04 and a Support of 68.27 - 66.79.
The price has increased from the last drop that happened last month in August by 15% where the market was trading near the 61$ range.
Could this movement be the start of a Bearish long-term trend ??
Notice on the chart that for the last couple of months we've been having lower Tops and lower Bottoms, So if we look at the big picture of the market right now it seems that the market is having a corrective wave at the moment but a certain drop will most likely happen soon.
But Technical Analysis shows that the market is still in a Bullish state.
Possible Scenarios for the market :
Scenario 1 :
The market is having its corrective wave right now and trading near the resistance zone extended from 70.40 - 71.04, If the Bulls were able to group up and gather their power then we might see a breakout happening in that zone which could lead the market back up to the 73.84 resistance level.
The market has formed 3 Outside up candlestick pattern (Strong Bullish Sign).
Scenario 2 :
Looking at the chart we notice that we are having some kind of a Bearish trend (It Could be Small it Could be BIg) and the price has reached the edge of the resistance zone, which could indicate that the bounce down from that zone will happen and it will drop the price to the 68.27 Level, Where the support zone start. A battle will happen between the Bulls and Bears and the Bears will win if it turns out that the bearish move is big, and a further drop will happen which could lead the market back to the 60$ level in the next 2 months.
Technical indicators show :
1) The market is above the 5 10 20 50 100 and 200 MA and EMA (Strong Bullish sign)
2) The RSI is at 56.00 showing strength in the market. No divergences were found between the indicator and the market.
3) The MACD is above the 0 line which indicates that the market is in a Bullish state, With a positive crossover between the MACD line and the Signal line.
Daily Support and Resistance :
support Resistance
1) 69.76 1) 70.40
2) 69.35 2) 70.63
3) 69.12 3) 71.04
Weekly Support and Resistance :
support Resistance
1) 68.27 1) 70.63
2) 66.79 2) 71.51
3) 65.91 3) 72.99
Fundamental point of view :
At the beginning of the week, OPEC ( Organization of the Petroleum Exporting Countries ) will release the latest monthly oil market report. WTI crude oil prices have been weakening since July. This comes amid concerns about the global growth outlook as the Covid Delta variant has been sapping demand woes. US retail sales may also stir volatility, especially if Covid shows increasing signs of making its way into the economy.
Earlier this week OPEC decided to increase output by 400,000 barrels per day (bpd) for the month of October, in line with its gradual plan to reintroduce supply into international markets after drastically withdrawing supply at the start of the pandemic. According to Dailyfx
This is my personal opinion done with technical analysis of the market price and research online from fundamental analysts for The Fundamental point of view, not financial advice.
If you have any questions please ask and have a great day !!
Thank you for reading.

OIL TRADE IDEAas for oil i like to see a breakout below $67 before jump into the market..
any failed a breakout $67 its time to long on oil
My trading strategy isn't intended to be used as a signal service. It's a process of gaining knowledge of market structure and improving my trading abilities.
Like and subscribe and happy trading to all

GTEAppears to be in some sort of on going complex correction. With WTI prices looking to bounce I think GTE will take an impulsive 5wave count up to form a possible higher degree B wave in the primary trend. We are long form .39c
