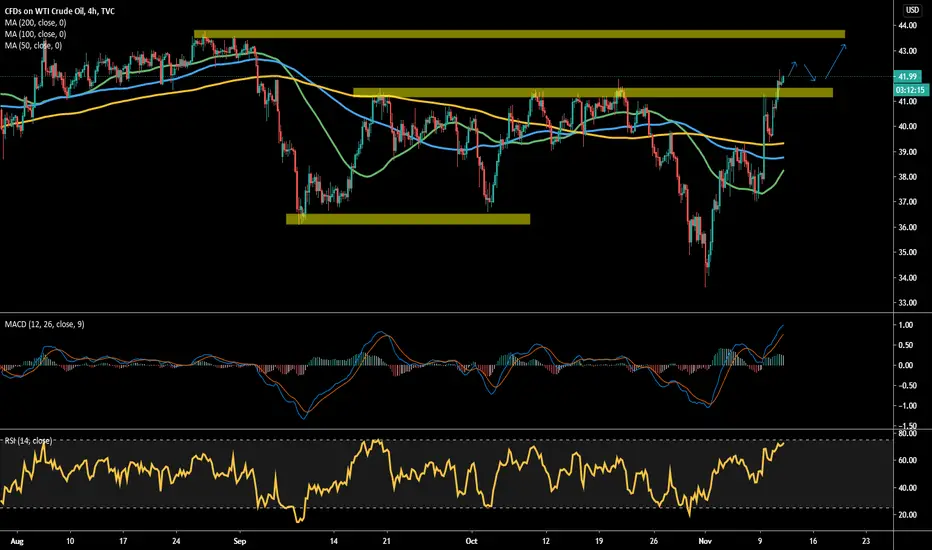
OIL crossed the short term resistanceIt is possible to see the uptrend of the OIL reaching the next level above 43, probably after a short consolidation
Oilanalysis
Oil New Analysis And Free 400 Pips Are Waiting !This is an educational + analytic content that will teach why and how to enter a trade
Make sure you watch the price action closely in each analysis as this is a very important part of our method
Disclaimer : this analysis can change at anytime without notice and it is only for the purpose of assisting traders to make independent investments decisions

Oil Buy Zone Near 37.50 price Zone, Next Target 43.00Oil Buy Limit n@ 37.50
Sl: 36.50
TP1: 39.00
TP2: 40.50
TP3: 41.50
TP4: 43.00


WTI & BRENT OUTLOOKlooking for strong bounce near the previous support zone.
stop level : wti <36$ , brent <38$


Oil could get down to support before moving further upsideOil Still looks Bullish to me. But, I think it needs to get down to support before it's going further highs.
Apparently, Hedge funds have decreased their long position in OIL in recent days. It doesn't straight mean it will fall and scenario changes to bearish.
I would rather be a buyer for a longer-term target of 45$-49$ when it gets to some support which could be 41.50 or even to 40.00. Eventually, Oil will get higher sooner or later.
Happy Trading.
This is not financial advice.
We will not be liable if any losses occur.
Trading in the financial market carries risks.
Make sure to maintain proper money management to maintain the risk.

WTI > POSSIBLE COUNTER TREND?oil seems way oversold.
expecting price to go up very fast , if markets can recover once again.
Oil USDWTI 4H Long SetupOil setup.
Expecting Oil to finally break and reach $45.
Follow for more setups.

USDWTI Oil 4H Long SetupHello traders this is my analysis for a long setup on Oil.
I'm expecting a retracement to previous resistance followed by a bullish move to previous highs.
Target may be adjusted if this has long term potential.
I will update as necessary.
If you like this analysis please follow for more ideas.

US OIL Long SetupWaiting to see if price can hold above 40USD on Monday, then look for a buy signal.
The triangle pattern forming looks very bullish.
Please also look at my char attached for a long term view on how I think oil prices will develop.

OIL WEEKLY FORECAST 22/6/2020IN OIL WE ARE EXPECTING BEARISH MOMENTUM IN THIS WEEK NOW 40.5/41$ LEVEL IS IMPORTANT FOR DOWN SIDE TARGET 37/34$.
THANKS

OIL MARKET RECOVERY STALLED BY UNCERTAINTIES AND GEOPOLITICAL TUWith June right at the corner, and this month staging 87% recovering in the black gold market, prices have unfortunately found a strong level at the $34 handle. The WTI index has struggled to cheer the USD's weakness and is currently trading in red in the Asian session with a correction of 1.5% from the Thursday session. Investors' sentiment is dampened amid heightening uncertainties with the current situation in Asia with the latest signal from the US of a possible change in its long-standing policy towards China and its internal affair within Hong Kong.
Technically speaking, the price action had a seesawing week, consolidating between $30 and $34 handle. Although trading above the smaller EMA 18 & 50, MACD is finally showing diminished bullish momentum, turning a bit sour with the intention to form a sell signal. RSI condition is moving far from its overbought level. Investors should consider further movement in the price action before placing their bets.
Any unexpected situation can quickly tarnish the positive momentum in the market. Yesterday's report about the massive buildup in the US crude inventories where the levels rose to 7.9 M barrels from a forecast of -2.5 M, instead of dropping the price, actually gave additional support to the market. It does not look right; the continued appearance of positive momentum and this rebalance faster than expected might be more artificial than real. However, by June is expected a 4 Mb/d increase in demand and cuts in the supply of about 12 MB/d could bring the market into balance.

CPE - No Brainer #3All,
Same setup as DNR and QEP... and this one just re tested support marked on my chart. Still of the three I would go with QEP due to how badly it beat EPS thats a really strong sign they have made adjustments and are going for it in my mind.

UCO OIL Is Going To Pump Short TermI would put a stoploss around 1.70
Long positions should be put from 187-175.
Like and Follow the post, for long long term targets.


OIL, accurate entry places for long - term buy You will learn the best place where we can trade OIL at low risk.
Write in the comments all your questions and instruments analysis of which you want to see.
Friends push the like button if you like the idea - that would be the best THANK YOU.
Thank you for your support, I Love it.

GBPCHF high probable bullish setupprofessionals adding long positions in gbp, while chf all the time high resistance area and suspect medium term bearish reversal in chf.

UKoil Brentwith breaking of resistance the next line of resistance could be the next target even as Convid-19 is still rampaging and affecting oil imports in china.
thank you for your likes kindly comment on your views

USOIL: An interesting lookHappy New Year oil traders! I hope everyone had a profitable 2019 and will have an even more profitable 2020! I started looking at USOIL in different chart views instead of the normal 15 minute chart or daily chart. Looking at the 1 hour chart I see this nice climb in price and then this huge rounding over. I also see a divergence between the Stoch RSI and Moneyflow. Considering tomorrow is Thursday and the first trading day of the year, I am expecting that this rounding will continue to roll over as investors take profits from 2019. I put in a small position at $61.30 on Tuesday and am looking to take a small profit around $60.90 unless this goes into free fall, in which I will add to the position. I am putting a stop loss in around $62.00. This should go prior to the market open on Thursday. We'll see.
Please click the thumbs up if you agree or if this is a help to you! Thanks and have a blessed 2020!!!

Crude oil poised for a rally up to $85 OR down to $33???Crude oil has been on a good uptrend since the large 2018 retrace, the price has slowly trickled up and there is an indication that it continues. ONLY IF certain conditions are met. There is an equal likelihood that we could see a large dump...
Support structure is holding really well after a broke high on a larger scale at $53.00-$53.50. As of recent price has gone up a lot in the winter month due to high demand but could this be temporary seasonal inflation?
The Bull case: Price has been holding upside market structure over the past few weeks and months holding support at the $53.00-53.50 area, the trend is holding well and the downside volume has been decreasing. We need to see price break above $64.00 on a longer perspective on strong volume into the $70.00 area or so then retrace and hold that broken peak at the $64.00 as support. We want to see price then move through the $73.50-73.60 level.
The Bear case: Price overall is looking bearish based on the monthly candles lower lows lower highs from 2013 even, the impulse high that has to hold is at $73.60. As long as price remains beneath that level we could see a press lower. The buy volume is looking really weak as well to the swings higher, which means this could be seasonal buying of crude which could evaporate. If price breaks below $53.00-53.50 and holds it as resistance on the retrace we might see a move even lower down to the $33.00 area and even below that.
Disclaimer: This is a trade idea for educational purposes only. This does not constitute as investment or trading advice. TRADEPRO Academy is not responsible for any market activity.

Crude oil hits our target area, is there more? $62.00??Oil has been on a tear this week and its mainly due to a lot of OPEC/OPEC+ talk. The upside came out on news of production cuts hitting the system shortly and we were anticipating price hitting the $60.00 area or near at least. That target was easily hit this week and now we have to question where could it go from here?
There are two possibilities:
1) The price could regulate and drop back below $58.70 and remain in the $57.00 area based on the weaker volume on these last moves higher and also the fact that the production cut news has already been priced in. It may be deemed overpriced by market participants and we can identify that if the $58.20 level breaks which is the impulse that brought price higher and price continues to drop below that holding it resistance on rotations.
2) Oil prices could continue going up and our target is $62.00. This is based on the current market structure of a strong uptrend. Higher highs and higher lows, for this to continue we can experience a pullback to
$58.60-58.70 based on the previous broken high and then continued move higher.
Disclaimer: This idea is for educational purposes only this does not constitute as investment or trading advice. TRADEPRO Academy is not responsible for any market activity.
