Lower oil pricesConsidering the price ceiling of Russia and the stagnant inflation of the United States, it seems that we will end this winter with a lower price than expected.
Oilanalysis

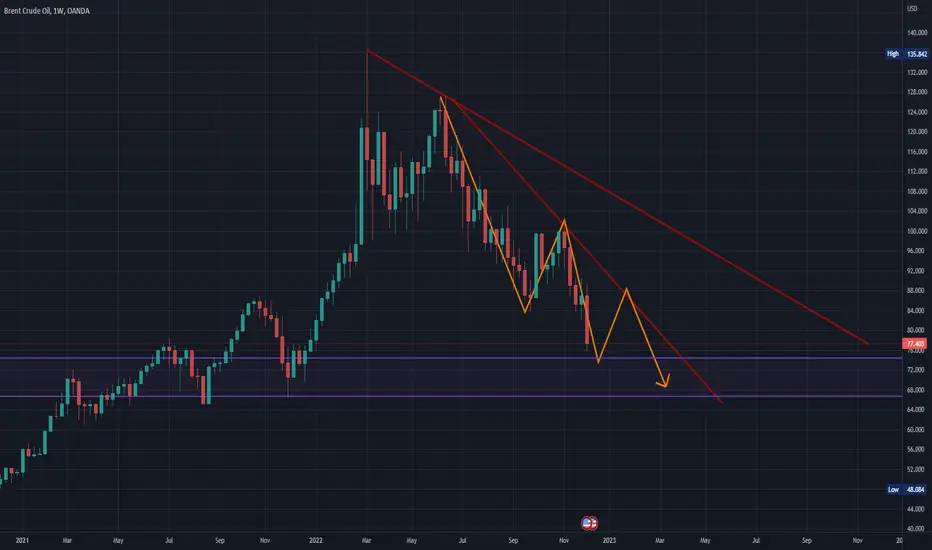
BOCOUSD-Brent OilBrent Oil: I don't think the downtrend is finished; I believe we will see lower prices on Brent Oil. However, I think the price has a correction or pullback to the trend line.
Brent crude bearish sentiment Commentary:
Despite the optimism around the reopening of China from COVID restrictions, oil prices remain vulnerable to fears of a global economic slowdown. The EU’s price cap at $60 per barrel while OPEC+ is expected to maintain existing production targets adds towards the bearish outlook on price.
Brent crude : Last weeks gains can be viewed as a “corrective” bounce off the $81 support; since price has pierced below the September 26th lows at $82.30 may serve to keep alive the bearish price sentiment; downside potential spotted near the $79.7s while upside seems limited to $89.2 in the short term (5-25 days).
Not investment advice. Past performance is not indicative of future results.

OIL-WTICOUS-Correct analysisTrue analysis. Tast's an update. Based on my analysis for OIL on Aug 2.
To know about analysis, follow me and contact me if you have any comments or questions. (I will answer whenever I have time).

Brent Crude Oil Simple Chart AnalysisBrent Crude Oil - Seem supported if we draw a 2 red arrow there. If this area indeed supported & rebound, we will see our KLSE energy moved. Might retest 100 as resistance here.
Risk side, it might just be a technical rebound here cause there are no red chip aggressively appearing.

USOIL Long term forecast Don't forget From December, the EU and G7 also want to cap the price countries pay for Russian oil. They are telling importers of Russian crude oil that western insurers will not cover oil shipments if they pay more than the cap. and also we have OPEC meeting in the beginning of December

Crude prices under downside pressureCrude prices under downside pressure on the back of weaker demand outlook
The recent break below the $92 short term support level has opened up the prospects for a further decline towards a test of the September 30th lows near $84, the bearish outlook can be technically supported by the fact that current price is below its 20 and 50 day simple moving averages, as well as the fact that the 14 day relative strength index has crossed below its respective signal line (bearish). Short positions can therefore be technically supported provided price is unable to push back above the recent support now turned resistance at $92. Short sellers may be looking for $84 and $81 as potential downside targets, while longs may be aiming for a retest of the $92 area with $93.54 in extension.

USOIL Forecast: Position Trade IdeaHey trader,
As you can the price is currently bearish running in the head and shoulders level 2, and below the 50 and bearish crossed short-term MAs. It is preparing to drop for the patterns L3 together for the 200 MA (that's visible on the MT4 chart). But that bias will be fully confirmed once the price has bearish closed and retested below the Daily Neckline and 8 MA (1st trade) or 3rd Weekly Key Lvl (2nd trade), to trigger what I call the "H&S C-E.1 & E.2 signals". However if the price decides to bullish rally to break and retest the 3rd Monthly Key Lvl and 8 MA, the bias will be rejected.
With that said, take the trades at your own risk, because this is not financial advice. I'm just sharing my point of view, which you also can do in the comments section below. I don't mind if you do so; I'd love to know your thoughts!
That's it for today. I hope you found value from this article. If you wish to see more content on trade ideas and psychology, click the posts linked below. You won't regret it.
Trade Safe,
Sphatrades.

Oil reverses losses. Could we see a push higher? Hi TradingView community, today’s focus is on oil as price has, for now, reversed seller momentum and could be starting to form a support bounce.
Overall the price remains range-bound between 93.50 and 83.65. But price continues to trade outside of the last major downtrend, and we have two higher lows after the September low.
Today sellers took control in the Asian session, but with a risk asset recovery into the LON session, we have also seen oil’s fortunes reverse back to the buyer side.
We can see a solid area for demand from and below support, which lines up with the higher lows. Today’s reversal maintains 85.40 support and will continue to back up yesterday’s higher low if we see a higher close today. These are all good signs, and if buyers can continue, we will be looking to see if they can retest the supply area. A break of supply could set off a new leg higher that we hope could retest resistance.
If buyers fail today and we see a new move back below 85.40 support, this will keep us on the lines as we wait to see if supply can continue to hold.
EIA crude inventories are due Thursday morning at 2:30 am AEDT.
Have a great Wednesday and good trading


Crude Oil Swing TradeThe idea here is about Crude Oil Swing Trade:
I am bullish on short term for crude oil due to the below observed technical factors.
1. Support established on a daily chart at the point of falling wedge as per below:
2. Deep Crab Harmonic pattern completed on a daily chart as per below:
3. Leonardo Harmonic pattern completed on a weekly chart as per below:
4. Trading below 20 & 200 EMA on daily chart & weekly chart.
5. RSI is at 34.67 on a Daily Chart & 34.36 on a weekly chart at the time of publishing.
6. MACD below signal line on daily & weekly chart .
Projected targets as per Deep Crab & Leonardo Harmonic provided in the chart & Weekly Image attached as above.
Stop Loss: provided in chart.
Disclaimer: “The above is an Educational idea only and not any kind of financial or investment advice. So please do your own DD (Due Diligence) before any kind of investment”.
Do you like my TA & ideas!!
Want to keep yourself updated with current market action? Then don’t forget boost & to subscribe for more analysis. Do leave your valuable feedback & comments for any improvisations.
Cheers.

WTI CRUDE OIL POSSIBLE TO GO DOWN
AronnoFX will not accept any liability for loss or damage as a result of
reliance on the information contained within this channel including
data, quotes, charts and buy/sell signals.
If you like this idea, do not forget to support with a like and follow.
Traders, if you like this idea or have your own opinion about it,
write in the comments. I will be glad.

Long opportunity for CL Long opportunity for CL
Entry : 77.85
SL : 76.12
TP1 : 86.58
TP2 : 89.75
TP3 : 93.86
If You Like My Idea Support me With Like :)

🟢 USOIL - 3D (06.10.2022)🟢 USOIL
TF: 3D
Side: Long
Pattern: Bull Flag
SL: $76.28
TP 1: $96.58
TP 2: $102.85
TP 3: $109.12
Oil has broken out of the Bull Flag. If the retest is successful it could be a great buy to hold for the coming weeks.

WTI analysis: Will OPEC+ cuts boost crude to $100?OPEC+ has taken a tough stance, slashing output by 2 million barrels per day (bpd) beginning in November 2022, the largest reduction in crude oil production since March 2020.
In addition to production extending the agreement through 2023, oil producers have agreed to hold semiannual rather than monthly meetings.
WTI oil briefly spiked to $87/bbl following the OPEC+ announcement. It then broke through that level in response to disappointing US crude oil inventory data (-1.36 million barrels vs. 2.05 expected) and a strong US ISM Services PMI, which delayed recessionary warning signs following the weak ISM Manufacturing PMI earlier this week.
The move by OPEC+ risks putting renewed pressure on crude oil’s global supply-demand balance in the coming months, potentially resulting in a price floor at pre-OPEC+ meeting levels.
On a technical level, WTI crude and (also Brent) prices are currently testing a key resistance area, defined by the 50-day moving average and the 23.6% Fibonacci retracement level of the range between September lows and June highs.
A sharp break above this resistance zone and then the $90/bbl level (September highs) could put additional upward pressure on an extension towards the 50% of the Fibonacci level ($98.6/bbl) and then $100/bbl.
Idea written by Piero Cingari, forex and commodity analyst at Capital.com

OIL BEARISH DOWNTREND $$$Oil has been consistently declining since its last top, trading in a descending channel with lower highs and lower lows. I've highlighted the key areas of support and resistance for oil to help you see the broader picture. You may take advantage of this if you want to swing trade in the channel.

USOIL | Price Is Falling Despite The Energy CrisisUSOIL | Price Is Falling Despite The Energy Crisis
It is strange that despite the energy crisis that all the countries are facing
and the high inflation the USOIL is still very strong.
It looks like it is moving down to the previous price levels close to $60 on the
bigger picture.
The market is still speculating a lot about the problem that with the economic recession
the OIL price should decrease
However, never knows what really is happening after the USOIL considering that it has been all the time
on the opposite direction with the fundamental perspective.
Thank you and Good Luck!

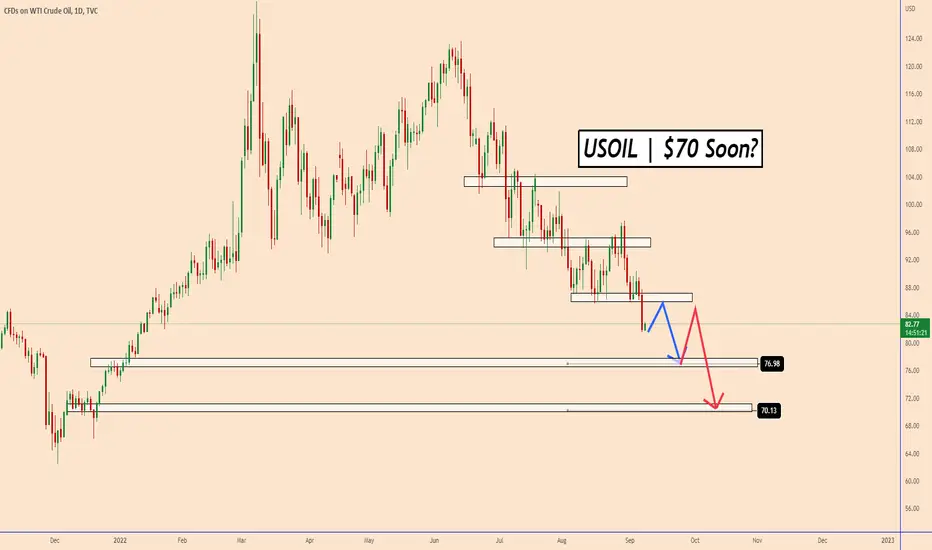
USOIL | Will The Price Test $70 Soon?OIL | Will the price test $70 soon?
Despite the energy crisis that the whole world is suffering from, we can see strangely that oil is falling in value.
One of these problems is addressed to the possible economic recession that
with this comes the decrease in oil consumption in general.
However, despite that speculation, from a technical point of view
we can see that the price is moving down on the daily chart.
After each breakout of the structure, we can see that the price consolidated a lot of days before the next bearish move.
The same thing can happen again up to $70
Thanks and good luck!
USOIL Previous analysis succeeded ✅We gained more than 600 pips of oil from our previous analysis. ✨
Congratulations to all my traders 🎉
Stay tuned for more accurate analysis ✅

WTI oil - An indecisive moment in the oil marketWe warned about the possibility of a downtrend correction in the middle of August 2022. Indeed, we said that the breakout above the sloping support/resistance would lead to such action. Then shortly after that, USOIL rose from its lows and broke above the resistance, halting its rise at 97.65 USD per barrel.
Since then, the price fell back below the 90 USD price tag. However, the drop stopped slightly above the sloping support, which is bullish. Accordingly, we are bullish on oil for as long as the price stays above the support. However, an alternative position can be taken (with a tight stop-loss) on the breakout below the support.
In the short-term future, we will pay close attention to OPEC's rhetoric and any potential talks about more production cuts. In our opinion, cutting production risks higher prices for oil in the short term. Although with the prospect of global recession unraveling, we think production cuts will only have a temporary effect if any.
Illustration 1.01
The picture above shows the daily chart of USOIL. Yellow arrows indicate a bullish breakout above the sloping support/resistance and subsequent failure of the price to retrace below it. As long as the price stays above the sloping support/resistance, it stays in the bullish area.
Technical analysis - daily time frame
RSI and MACD are neutral. Stochastic is bearish. Overall, the daily time frame is neutral/slightly bearish.
Illustration 1.02
Illustration 1.02 shows the daily chart of USOIL and two simple moving averages, which still reflect a bearish constellation.
Technical analysis - weekly time frame
RSI is neutral. Stochastic and MACD are bearish. DM+ and DM- are bearish. Overall, the weekly time frame is bearish.
Please feel free to express your ideas and thoughts in the comment section.
DISCLAIMER: This analysis is not intended to encourage any buying or selling of any particular securities. Furthermore, it should not be a basis for taking any trade action by an individual investor. Therefore, your own due diligence is highly advised before entering a trade.


USOIL is evaporatingOil has to fall if the global fight against inflation needs results.
Inflation Reduction Act of 2022 gives us fresh ammo to short the oil.
Watch for the downward supports:
Support 1 - 85.5
Support 2 - 77

OIL-WTICOUSDOops, I updated the chart today and looked at the chart in the medium term (6H) and realized that we might see this pattern on the chart, then should check twice the chart within the specified range.
But the analysis done on the daily time frame is still valid.
