Oilforecast

WTI Oil - time to drop (please!)Our reviewed and renewed chart on Oil, how it has been rising on positive sentiment and vaccine news but also it has hit the resistance and a drop (even temporary or bigger) is expected.
We have positions opened from selling last week, we are doing dollar cost averaging and selling now again, so please oil, just drop ;)

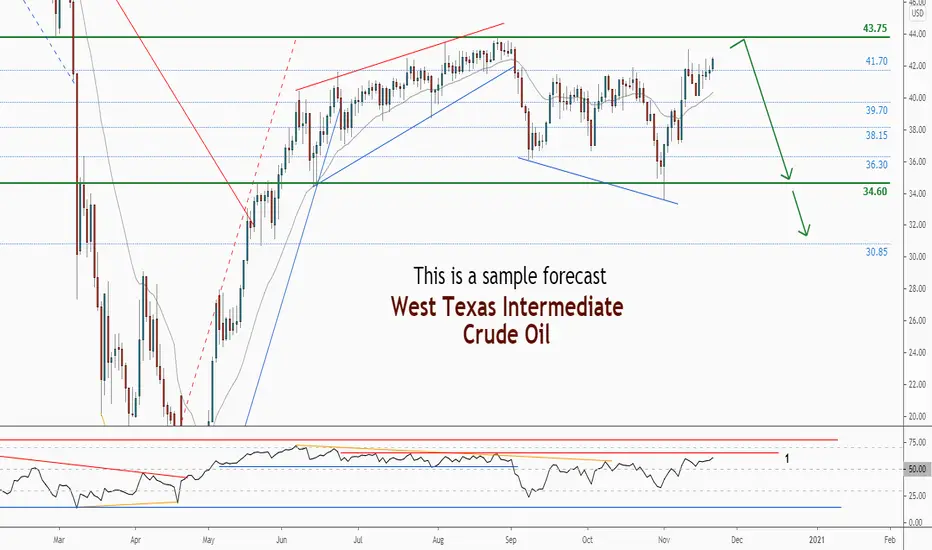
WTI . Weekly Technical Analysis UpdateMidterm forecast:
While the price is below the resistance 43.75, beginning of downtrend is expected.
We make sure when the support at 34.60 breaks.
If the resistance at 43.75 is broken, the short-term forecast -beginning of downtrend- will be invalid.
Technical analysis:
While the RSI resistance #1 at 65 is not broken, the probability of price increase would be too low.
A trough is formed in daily chart at 40.20 on 11/13/2020, so more gains maximum to Major Resistance (43.75) is expected.
Price is above WEMA21, if price drops more, this line can act as dynamic support against more losses.
Relative strength index (RSI) is 60.
❤️ If you find this helpful and want more FREE forecasts in TradingView
. . . . . Please show your support back,
. . . . . . . . Hit the 👍 LIKE button,
. . . . . . . . . . Drop some feedback below in the comment!
❤️ Your Support is very much 🙏 appreciated! ❤️
💎 Want us to help you become a better Forex trader ?
Now, It's your turn !
Be sure to leave a comment let us know how you see this opportunity and forecast.
Trade well, ❤️
ForecastCity English Support Team ❤️


Bearish scenarioHarmonic Bullish Bat pattern forming, get ready to sell on breaking the up trend. The target will be 38

WTI OIL- Back to 40$ or lowerOUR TECHNICAL ANALYSIS ON CRUDE OIL WITH KEY SUPPORT AND RESISTANCE LEVELS AND PRICE TARGETS

$USOIL bull run stalled mid 41/b: Upside is a new SUPPORT point.It seems the run $USOIL went on during the first half of Monday's session met its resistance, as written, around the 41.5-41.65 mark. It is below that right now, and it might not even test that point today. Watch for the dip below 41. It is this trader's OPINION (IDEA) that $USOIL has strong support at the 40/barrel mark, which it has not for the last many months...the post-COVID high remains roughly 43, and until that is surpassed, all pump fakes might just be that...
IN CONCLUSION! -- There is a short here to be made, but not a substantial one in terms of oil-related positions. Weakening some positions might make sense--but with the 95% effective COVID vaccine hailed by MODERNA, things are still seeming - overall - quite bullish.
It's just that $USOIL is going to need an even bigger shove to go 45-plus as we have continually pined for.
The economy is getting stronger, but it is still on a ventilator. As it is.
-BDR
Note: See yesterday's idea RE: the resistance point mid-41.

CRUDE LOOKS LIKE ITS CLIMBINGCrude is making higher lows and higher highs and with dxy weakness already being seen this week, and the bullish engulfing 4h printing on the ema 89 and bullish rvi cross, that this might be swing low and it may be a good idea to go long

Oil- Time to SELL againOil has risen early this week but we see major resistance being checked and possible drop in the next few hours.
We are going short again, now.

Pin bar confirmation to Sell The resistance area of 43.03 was very strong and it was not broken and formed a pin bar to sell on a daily time frame given as the confirmation to sell to the support level of 36.04

Brent Crude Oil - Weekly technical analysis updateMidterm forecast:
While the price is below the resistance 46.50, beginning of downtrend is expected.
We make sure when the support at 36.95 breaks.
If the resistance at 46.50 is broken, the short-term forecast -beginning of downtrend- will be invalid.
Technical analysis:
While the RSI downtrend #1 is not broken, bearish wave in price would continue.
A peak is formed in daily chart at 45.44 on 11/11/2020, so more losses to support(s) 41.70, 40.00 and minimum to Major Support (36.95) is expected.
Price is above WEMA21, if price drops more, this line can act as dynamic support against more losses.
Relative strength index (RSI) is 54.
❤️ If you find this helpful and want more FREE forecasts in TradingView
. . . . . Please show your support back,
. . . . . . . . Hit the 👍 LIKE button,
. . . . . . . . . . Drop some feedback below in the comment!
❤️ Your Support is very much 🙏 appreciated! ❤️
💎 Want us to help you become a better Forex trader ?
Now, It's your turn !
Be sure to leave a comment let us know how you see this opportunity and forecast.
Trade well, ❤️
ForecastCity English Support Team ❤️

OIL- We called the drop nicely TP levels on chartSo we called the drop nicely, now let's take a look at our targeted take-profit levels


CRUDE OIL video top-down AnalysisHello everyone, if you like the idea, do not forget to support with a like and follow.
Here is the top-down analysis for CRUDE OIL, feel free to request any pair/instrument or ask any questions in the comment section below.
Best of luck!

WTI- Looking to sellFrom 34 recent low Oil has risen 20% to 41 resistance zone.
Now the price is just under this important resistance and I expect Oil to remain in this 35-41 range in the medium term
That being said I will look to sell rallies above 41 with a target on the lower part of the range

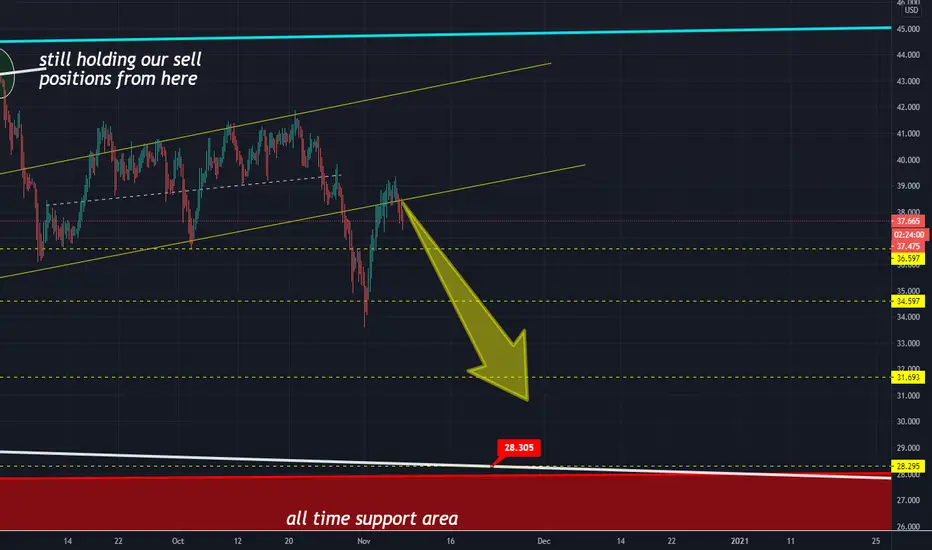
WTI . Weekly Technical Analysis UpdateMidterm forecast:
39.70 is a major resistance, while this level is not broken, the Midterm wave will be downtrend.
We will close our open trades, if the Midterm level 39.70 is broken.
Technical analysis:
While the RSI downtrend #1 is not broken, bearish wave in price would continue.
A peak is formed in daily chart at 39.50 on 11/05/2020, so more losses to support(s) 36.30, 34.60, 30.85 and more depths is expected.
Price is below WEMA21, if price rises more, this line can act as dynamic resistance against more gains.
Relative strength index (RSI) is 44.
❤️ If you find this helpful and want more FREE forecasts in TradingView
. . . . . Please show your support back,
. . . . . . . . Hit the 👍 LIKE button,
. . . . . . . . . . Drop some feedback below in the comment!
❤️ Your Support is very much 🙏 appreciated! ❤️
💎 Want us to help you become a better Forex trader ?
Now, It's your turn !
Be sure to leave a comment let us know how you see this opportunity and forecast.
Trade well, ❤️
ForecastCity English Support Team ❤️

OIL Updated - We keep on SellingFurther to yesterday's idea, price has dropped at resistance and dropping :
Already in profits and managing our positions accordingly. Closing our 3 Buy positions and also closing 3 of our sell positions.
4 sell positions in profits and remaining open. 1 is cashed out so profit guaranteed, 3 open with take profit levels at 36.60, 34,60 and 31,70.
VICTORY
yesterday:
Our technical analysis on Oil with the major key price levels.
Fundamentally and technically we see a drop , sooner or later, below 30 usd
At this stage there is a 60% drop , or a 40% rise to 42.50 resistance and a possible drop from there at 90% (10% only to break that level)
HOW WE TRADE THIS:
We have SELL and BUY positions at a rate of 7 (buy) to 3 (sell) (70%-30%)
If the price drops then we have a profit from 40% of the positions
If the price rises we will close all BUY positions at the major resistance of 42.5usd and hold our SELL positions for a drop back to where the price is now and the key take profit levels of 36.60, 34.60 , 31.70 and even the all time support of 30$ and 28.50$.
If all goes well we will consider Buying again at that level.
Take a look at how we perfectly sold in September s idea predicting perfectly the beginning of the drop ,
our tutorial on Oil analysis
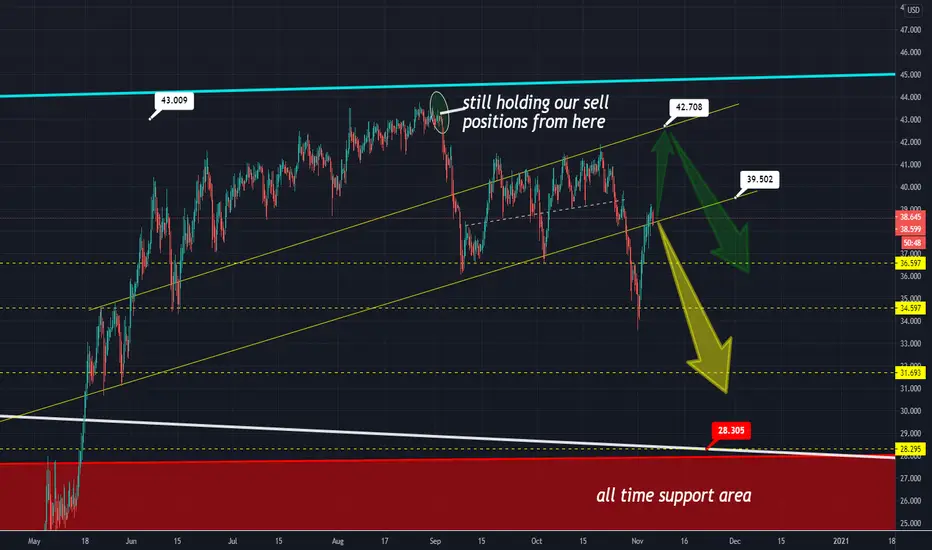
OIL - Our strategy of mixing BUY and SELL positionsOur technical analysis on Oil with the major key price levels.
Fundamentally and technically we see a drop, sooner or later, below 30 usd
At this stage there is a 60% drop, or a 40% rise to 42.50 resistance and a possible drop from there at 90% (10% only to break that level)
HOW WE TRADE THIS:
We have SELL and BUY positions at a rate of 7 (buy) to 3 (sell) (70%-30%)
If the price drops then we have a profit from 40% of the positions
If the price rises we will close all BUY positions at the major resistance of 42.5usd and hold our SELL positions for a drop back to where the price is now and the key take profit levels of 36.60, 34.60 , 31.70 and even the all time support of 30$ and 28.50$.
If all goes well we will consider Buying again at that level.
Take a look at how we perfectly sold in September s idea predicitng perfectly the beginning of the drop,
our tutorial on Oil analysis