#CRUDEOIL #WTI COULD SEE BEARISH CORRECTION BEFORE CONT. UPSIDEAFTER A BREAK IN STRUCTURE LAST WEEK
AND NOW RETEST OF $40-$42 UNDERWAY
WE EXPECT PRICE TO CONT. CORRECTING TO THE $33-$34
PRICE LEVELS BEFORE CONT. HIGHER
TVC:USOIL
Oilforecast

Oil- above 40 is a great sellSince mid-June, WTI OIL traded in a long rising wedge. Finally, we had the break of support followed by a 600 pips drop.
Now Oil is recovering some of the losses, but I expect this to be just a correction before a new leg down.
I will look for opportunities to sell WTI above 40 and my target is 32 with a great 1:4 R:R

The plan of the day I have selected the entries based on fibonacci of 1 quarter period, but however pay attention to the down trend if you decided to buy.


Brent Crude Oil - Weekly technical analysis updateMidterm forecast:
. While the price is below the resistance 46.50, beginning of downtrend is expected.
. We make sure when the support at 40.00 breaks.
. If the resistance at 46.50 is broken, the short-term forecast -beginning of downtrend- will be invalid.
Technical analysis:
. There is a divergence in RSI and price between the peak at 43.315 on 2020-06-08 and the peak at 46.525 on 2020-08-26, the probability of uptrend continuation is decreased and the probability of beginning of downtrend is increased.
. The RSI support #1 at 55 is broken, so the probability of beginning of downtrend is increased.
. A peak is formed in daily chart at 46.50 on 08/25/2020, so more losses to support(s) 41.70 and minimum to Major Support (40.00) is expected.
. Price is below WEMA21, if price rises more, this line can act as dynamic resistance against more gains.
. Relative strength index (RSI) is 35.
❤️ If you find this helpful and want more FREE forecasts in TradingView
. . . . . Please show your support back,
. . . . . . . . Hit the 👍 LIKE button,
. . . . . . . . . . Drop some feedback below in the comment!
❤️ Your Support is very much 🙏 appreciated! ❤️
💎 Want us to help you become a better Forex trader ?
Now, It's your turn !
Be sure to leave a comment let us know how do you see this opportunity and forecast.
Trade well, ❤️
ForecastCity English Support Team ❤️

Don't miss the great sell opportunity in WTITrading suggestion:
". There is still a possibility of temporary retracement to suggested resistance line (42.56).
if so, traders can set orders based on Price Action and expect to reach short-term targets."
Technical analysis:
. WTI is in a range bound and the beginning of downtrend is expected.
. The price is below the 21-Day WEMA which acts as a dynamic resistance.
. The RSI is at 40.
Take Profits:
TP1= @ 39.08
TP2= @ 37.13
TP3= @ 34.68
TP4= @ 30.32
TP5= @ 20.44
SL: Break Above 43.91
❤️ If you find this helpful and want more FREE forecasts in TradingView
. . . . . Please show your support back,
. . . . . . . . Hit the 👍 LIKE button,
. . . . . . . . . . . Drop some feedback below in the comment!
❤️ Your Support is very much 🙏 appreciated! ❤️
💎 Want us to help you become a better Forex trader ?
Now, It's your turn !
Be sure to leave a comment let us know how do you see this opportunity and forecast.
Trade well, ❤️
ForecastCity English Support Team ❤️


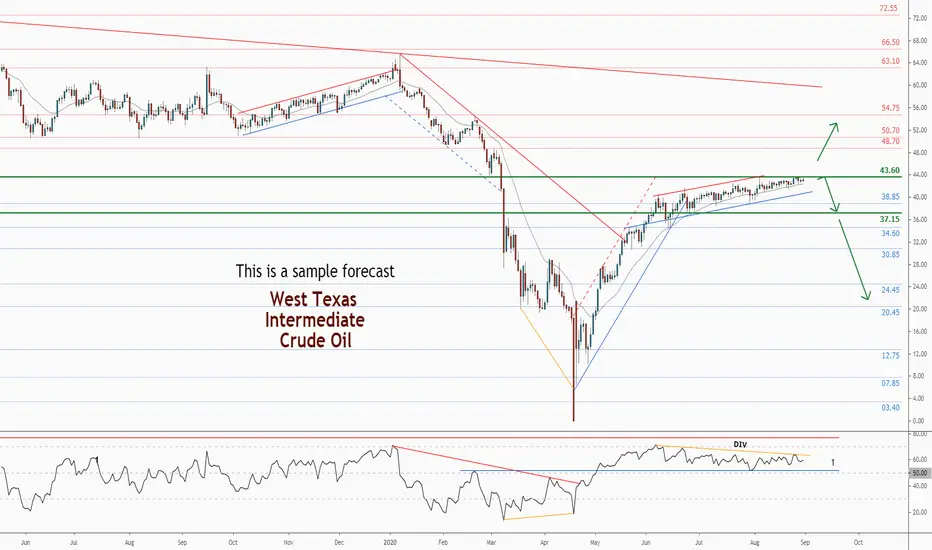
WTI . Weekly Technical Analysis UpdateMidterm forecast:
. While the price is below the resistance 43.60, beginning of downtrend is expected.
. We make sure when the support at 37.15 breaks.
. If the resistance at 43.60 is broken, the short-term forecast -beginning of downtrend- will be invalid.
Technical analysis:
. There is a divergence in RSI and price between the peak at 40.565 on 2020-06-08 and the peak at 43.595 on 2020-08-05, the probability of uptrend continuation is decreased and the probability of beginning of downtrend is increased.
. While the RSI support #1 at 52 is not broken, the probability of price decrease would be too low.
. A peak is formed in daily chart at 43.60 on 08/05/2020, so more losses to support(s) 42.30, 38.85 and minimum to Major Support (37.15) is expected.
. Price is above WEMA21, if price drops more, this line can act as dynamic support against more losses.
. Relative strength index (RSI) is 59.
❤️ If you find this helpful and want more FREE forecasts in TradingView
. . . . . Please show your support back,
. . . . . . . . Hit the 👍 LIKE button,
. . . . . . . . . . Drop some feedback below in the comment!
❤️ Your Support is very much 🙏 appreciated! ❤️
💎 Want us to help you become a better Forex trader ?
Now, It's your turn !
Be sure to leave a comment let us know how do you see this opportunity and forecast.
Trade well, ❤️
ForecastCity English Support Team ❤️

WTI . Weekly Technical Analysis Update Midterm forecast:
. While the price is below the resistance 43.60, beginning of downtrend is expected.
. We make sure when the support at 37.15 breaks.
. If the resistance at 43.60 is broken, the short-term forecast -beginning of downtrend- will be invalid.
Technical analysis:
. There is a divergence in RSI and price between the peak at 40.565 on 2020-06-08 and the peak at 43.595 on 2020-08-05, the probability of uptrend continuation is decreased and the probability of beginning of downtrend is increased.
. While the RSI support #1 at 52 is not broken, the probability of price decrease would be too low.
. A peak is formed in daily chart at 43.60 on 08/05/2020, so more losses to support(s) 42.30, 38.85 and minimum to Major Support (37.15) is expected.
. Price is above WEMA21, if price drops more, this line can act as dynamic support against more losses.
. Relative strength index (RSI) is 59.
❤️ If you find this helpful and want more FREE forecasts in TradingView
. . . . . Please show your support back,
. . . . . . . . Hit the 👍 LIKE button,
. . . . . . . . . . Drop some feedback below in the comment!
❤️ Your Support is very much 🙏 appreciated! ❤️
💎 Want us to help you become a better Forex trader ?
Now, It's your turn !
Be sure to leave a comment let us know how do you see this opportunity and forecast.
Trade well, ❤️
ForecastCity English Support Team ❤️
Oil is next to pick up some steamPlease follow risk management.
Take profit 1: 46.5 $
Take profit 2: 49 $
Trading tactics: At 49 $ 50% of positions should be closed and move the stop loss to break even.
Allow the trends to be broken to build new ones.

Crude Oil - Buying the DipsOil prices are coiling up for a move which will eventually head towards to the mid $60s for the following reasons:
- Bankruptcies
- DXY destruction
- Demand bottoming
- Chaos in the Middle East at some point
Pit stops along the way are marked by the fib extension from the first impulsive move - 0.5 and 0.618 being the most significant.
The simplest strategy is to assume the fib levels are to at first sell the resistance levels and then buy when it flips to support.
Right now it looks like the 0.236 level is now support. Below that you have a possible floor at the macro fib level around $40 - any dips here will likely be bought up quick.
Still long QM @ $42.85
Total Oil P/L: $1,930
All trades linked below.

Oil buy setupDISCLAIMER:
My analysis is just a trading idea! As a trader you should consider your own risk:reward ratio and do proper lot sizing according to your margin and leverage level.
Good Luck!

CLM2021: A 1-Year ForecastThe oil market is held up by new long interest working the sell orders of prior buyers, who are by now feeling the urge to re-enter. In fact, the best time to counter a trend is when the urge gets too prominent; with another 10% of upside here, one can start switching from buy-into-weakness approach to sell-into-strength until that green rate is met by this contract's offer price.

CLU0: Sideways ActionHere is a road map for this contract's price development until its expiry. As the futures curve is in contango, the CLU2020, which is now the new front-month contract, is yet to test the supply around the 100% up area from its YTD low. Furthermore, 50% of the YTD range is also around the area where this contract is currently trading. These factors are expected to imply an increased interest to square off long exposure aka selling longs. So far, the price action is suggesting that there is new long interest working the orders of those selling their oil holdings. Nonetheless, there is a decent potential to slide down to the +50% area from YTD low. Caution is advised.

Brent Crude Oil - Weekly technical analysis updateMidterm forecast:
While the price is below the resistance 46.30, beginning of downtrend is expected.
We make sure when the support at 36.95 breaks.
If the resistance at 46.30 is broken, the short-term forecast -beginning of downtrend- will be invalid.
Technical analysis:
There is a divergence in RSI and price between the peak at 43.315 on 2020-06-08 and the peak at 46.32 on 2020-08-05, the probability of uptrend continuation is decreased and the probability of beginning of downtrend is increased.
While the RSI support #1 at 55 is not broken, the probability of price decrease would be too low.
A peak is formed in daily chart at 46.30 on 08/04/2020, so more losses to support(s) 41.70, 40.00 and minimum to Major Support (36.95) is expected.
Price is above WEMA21, if price drops more, this line can act as dynamic support against more losses.
Relative strength index (RSI) is 54.
❤️ If you find this helpful and want more FREE forecasts in TradingView
. . . . . Please show your support back,
. . . . . . . . Hit the 👍 LIKE button,
. . . . . . . . . . . Drop some feedback below in the comment!
❤️ Your Support is very much 🙏 appreciated!❤️
💎 Want us to help you become a better Forex trader?
Now, It's your turn!
Be sure to leave a comment let us know how do you see this opportunity and forecast.
Trade well, ❤️
ForecastCity English Support Team ❤️

CLV0: Two Potential SetupsThe above chart shows potential price development scenarios before the expiry of this contract. The higher timeframes are showing signs of selling, any weakness in oil at this point can be justified by long interest vacating their holdings at almost a 100% gain from YTD low. Though aggressive bears might join in for a swing lower, it is imperative to be looking for buying opportunities upon signs of weakness. Another way to buy the dip is to sell a put option, let's say a CL Dec'20 strike @ $38.50, which would give the option writer a $1.5k premium at the current market, giving him/her a Break-Even price of around $37.00 where the stop sells would be placed separately on the CLZ0 contract.


USDWTI, OIL UPSIDE POTENTIAL. DEMAND FOR OIL IS INCREASING.Projection for technical upside on Long Trade for USDWTI. Demand for Oil is Increasing.

Oil/USD : Brent gradually recoverAfter the big drop in oil prices, however, it recovered gradually swinging
.
However, it is now in a confusing area at resistance and is likely to break it, despite the fact that the barrels of oil have been reduced
.
Moving Average Indicator gives a good indication for the upside. Moving 20 has been breached, and the Moving 50 remains if the break occurred, it will continue.

USoil go long take profits on way to $44Nice place to add to oil longs, falling wedge onto trend line. Hourly moving averages are still very bullish here and price is trading some way below the 200 MA. Stop loss below the previous hourly swing low in case the wedge continues to slide a little.
Falling daily 200MA is the barrier so i'll still be taking long profits at each resistance point before my actual ideal target of $44.


Brent Pullback, Sellers to Take over?Last week we saw brent oil break the 50% retracement level from the free fall in price from over supply and lack of demand from the corona virus at the start of the year.
This week we have seen a pullback edging to this retracement level, will the bulls continue to prop the market up or has momentum finally ran out? With fundamental data showing a gloomy economic forecast and coronavirus cases starting to rise is this the moment we see large selling within the market?
