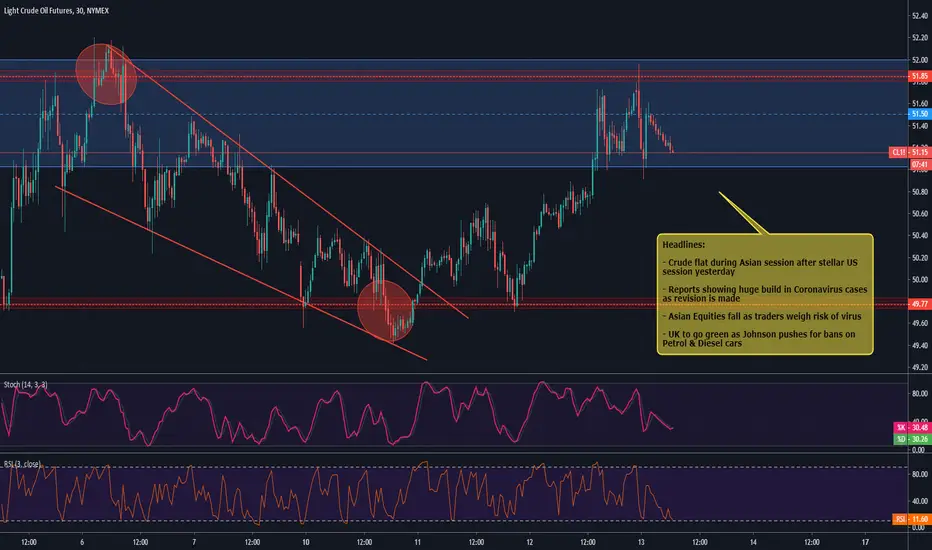
cl, oil, day trading for Feb 13th 2020 we are in a big range and will widen the red zone to the outside of this consolidation and until we move out of this range will look for small trends inside the big range, and no clear direction until this clears this zone. That said the down side looks the most likely in the big picture.
Oilfutures

Crude Flat in Asia After Dominant US Session YesterdayHeadlines:
- Crude flat during Asian session after dominant US session yesterday
- Reports showing huge build in Coronavirus cases as revision is made
- Asian Equities fall as traders weigh risk of virus
- UK to go green as Johnson pushes for bans on Petrol & Diesel cars
cl, oil, day trading for Feb 12th 2020oil is off to a bullish start heading for the top of the big range I have mentioned a few times. The first targets are close to the current action to see if oil can push past where some selling is likely to happen. This is either a look for buyers and in that cause we find them or we do not. If they are found a good sized up move could be coming and top of range of 52 is very possible. and if the buyers do not jump on board then a rejection back into the prior days range is my second trade idea.

oil, cl, day trading for Feb 11th 2020Oil is in the same positions as yesterday so will link that post, however oil staying below 51 I say keeps us only trading the bottom part of the range. And a move above 51 takes us tot eh top of the range close to 51.50. I will not get to bullish on oil anytime soon.
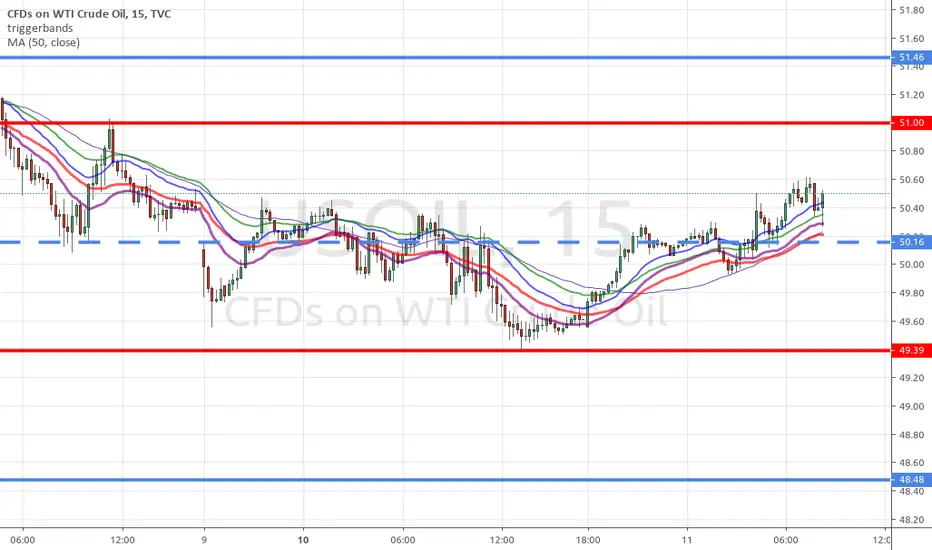
cl, oil, day trading for Feb 10th 2020today the early session is setting up my boundaries very well, I do however have a light red zone for short at 49.8, and this could take s right past red low to the prior range bottom. In the event we break that low I then will look for targets, until then i have no values lower.
Oil is and has been trading in a larger range from 49.5 to 51.90 and until this is cleared i expect we stay put and if this info remains correct then I think early on today will set up a in range long side trade.

es, spy, day trading for Feb 7th 2020so a bit of a slide over night but balanced in a declining flag so watch the red top for the break to the up side. action that is not impulsive to eh down side could be hared to trade if it remains inside the flagging set up. the red zone range is big enough to just trade the action inside if that is all it wants to give to us today.

cl, oil, day trading for Feb 7th 2020 as of typing oil is testing support of the red zone bottom and this would be the break of yesterdays range bottom, non rth session has traded inside the range of yesterday so a decent move could happen on break.
I will watch the reaction on this break and probably short a retrace if the move is outside the red bottom.

oil, cl, day trading for Feb 6th 2020 today oil does not have a real red zone, so placing it at support and resistance area of a 5 day consolidation.
I will be trading red top to balance (dashed line) and red bottom to balance in a small trend back and forth method until oil gets out of this range or provides more information.
So i say big range chop for the time being.

oil, cl, day trading for Feb 5th 2020from last session close oil has been moving up to the top of yesterdays early session and is finding a happy place there. If not break above red top then will not even think long, and last nights low is the area I will look to see if oil is finding buyers. So that said will be looking to trade this range from 49.25 to 51.50 and looking for impulsive trends inside the range until we clear this zone.

cl, oil, day trading for Feb 4th 2020Oil is already breaking out of the red zone and looking nice for the upside. I will look for a retest or a break back inside.

cl, oil, day trading for Feb 3rd 2020From last close oil has been balanced long and in a decently tight consolidation looking for it next move. As always watch the red zone for the first directional clue. A move lower could come fast and expect a move higher will be more grindy, but what do I know, this is only my thoughts. The trick is let the market prove me wrong and take advantage of what it is showing you..
I like the idea of a Red zone bottom bounce and then see if we can break out the top of the red zone.
If teh bottom lets go will change my long view very fast.

oil, cl, day trading for Jan 31st 2020Oil is in a big consolidation and has a smaller break zone. This is why showing 2 red zones, the bigger zone is more for a trend or swing type trade or heads up of primary direction and also support and resistance for turning points. The smaller red zone will be good for intraday trading showing chop or small trend for the day.
I will be looking for 53 and then a turn back down as plan a.

oil, cl, day trading for Jan 30th 2020oil has a very nice set up range, any move below red zone I think will take us to 51 before decent support.
and a move out the top of the red zone will have oil back into the top of this bigger 3-4 day consolidation. at 54 area

oil, cl, day trading for Jan 29th 2020The action is balanced long and looks to want to move higher as long as red zone bottom holds. down side has some very close targets so a move down could be just a peak below to see if there is any action so watch for buys around these areas if short.
The move above red high has more aggressive targets and looks to me to be where the bigger moves could come.
In the event we move down into Mondays range then I say the long side is done for a bit in a bigger picture.

cl, oil, day trading for Jan 28th 2020Today we have a up move inside a balancing range so will be look at 2 things, 1) a move below the top dashed line for a trade back to bottom dashed line and possibly to the Red zone bottom. If Red bottom break then a move through to 52.
2) is a move above the top of Red zone or a bounce of top dashed line for a run to 55.
3) A consolidation day looking for the longs off bottom and shorts off the top.
Ask me question if you need more info on how to play the different ideas.

cl, oil, day trading for Jan 27th 2020With no doubt oil is bearish and first plan would be to be looking for ways to get short. There are some bounce points that could happen but with this news cycle going to take a bunch of good stuff to cause this bounce. We are getting very over sold so bounce can happen but will need a new narrative to change the over all direction.

oil, cl, day trading for Jan 24th 2020Oil is balancing as it gets ready to tell us what it plans next. not only is this info critical for the day trade ( that is fine just staying in the Red Zone for back and forth action) but also critical for the oil big picture trade also. I targeted oil down to 56 area before big decision time and now we went a little lower. On the chart are lower important big picture supports.
So all this said will trade the balance unless the oil market picks a side by moving out of the Red zone.

oil, cl, day trading for Jan 23rd 2020Well we hit my 56 area and things got interesting. I will be stalking a long term long side trade if it set sup, but now that we are under 56 for today the Red zone is very important and looks like lower we will go. So today will be leaning on any short set up, however a move back above 56 dot 25 I will look for day trad longs back into the high 56's to low 57's

oil, cl, day trading for Jan 22nd 2020Oil is back into that lower range i mentioned and now might go for the 46 buy zone i was targeting last week. Watch the red zone for directional clues and be ready to just trade the range.
This is oil report day so little may happen till post the news

cl, oil, day trading for Jan 21st 2020Oil has moved back down to the pricing level it hang out at most of last week and would balance out well with a move to 57. This also give oil a bigger range to slosh around in between 60 and 57.50.
Will watch red zone for breaks or rejections to give me my days directional leaning or days range to trade.

cl, oil, day trading for Jan 17thThe current action is bullish and to me looks like it wants higher, however what i think is not important. What is important is what happens.
The best thing for me or plan A would be move down that I can gt long and move to the 59.5 target.
Plan B would be a move down back into the prior distribution into the 58 area.
Plan c is shorting tops and long bottoms of the red zone.

WTI Overbought AnalysisWTI is now on overbought at RSI, and it should be good to land it down to the support level around 60.00
Good luck

Potential Area to Short OilCould be getting some rejection from this Daily Triangle on USOIL. Getting Confluence with Supply/Demand Zone Analysis
And lower timeframe Market Structure
If price can stay below 60.93 our first realistic targets for a short day would be around 59.90 at the bottom of the Supply zone that its currently dropping through.
