Crude oil------sell near 68.80, target 66.00-62.00Crude oil market analysis:
Recent crude oil is actually very easy to operate. Sell when it rebounds to a high position. Don't worry about the position. In addition, the daily K-line has also begun to decline, and it is difficult to form a large rebound. The new daily moving average begins to sort. If there is no fundamental support in the future, crude oil has a lot of room to fall, and it will fall below 58 in the future. Sell it when it rebounds to around 68.80 today.
Fundamental analysis:
Today is a holiday in Tokyo, Japan. In addition, there is no major data this week. We focus on the fundamentals. Trump's tariffs are still a focus.
Operational suggestions:
Crude oil------sell near 68.80, target 66.00-62.00
Oilprice

Crude oil-----Sell near 66.80, target 65.00-62.00Crude oil market analysis:
The recent crude oil daily line began to decline, but a small V appeared last night, which was also caused by the situation in the Middle East. Israel bombed Syria and crude oil began to rebound. Overall, crude oil is still bearish. We consider continuing to sell it when it rebounds. It has not broken near 64.00, and it is difficult to form a large unilateral. The suppression position is near 66.80. Consider selling it near it.
Fundamental analysis:
Trump’s dissatisfaction with Powell has not been a day or two. Conflict is inevitable, and the impact on gold is also short-term. Yesterday’s pull-up and dive is a case in point.
Operational suggestions
Crude oil-----Sell near 66.80, target 65.00-62.00

Crude oil------sell near 70.00, target 66.70-63.00Crude oil market analysis:
Recently, crude oil has been rising, and buying is slowly climbing, but the amplitude is not particularly large. The daily line has not formed a large buying pattern. It is currently a technical repair market after falling too much. Today's idea is to sell on the rebound. Pay attention to the suppression near 70.00. If this position is broken, it may change the short-term trend and buying may rise.
Fundamental analysis:
Last week, Trump increased tariffs on Canada and is about to increase tariffs on Brazil. There is no sign of stopping the tariff war. It is long-term bullish for gold. The situation in the Middle East has not completely stopped, and it is also long-term suppression of the US dollar to support gold.
Operation suggestions:
Crude oil------sell near 70.00, target 66.70-63.00

Is WW3 Coming? Crude Waves Flash Warning which I DO NOT LIKE ITI’m getting a knot in my stomach looking at this chart, it feels like a warning about what’s coming.
Chart Context
• WTI jumped from the pandemic low of 6.62 up to 131.02 on March 6, 2022.
• It then retraced to 59.86 (38 % Fib) by June 4, 2025.
• That pullback seems complete, and now price is pressing against a descending wedge.
Wave Map
• Wave 3 could extend toward 207
• A full five-wave run points up near 330
• The pattern is squeezed in a tightening channel that looks ready to break any day
Why It Feels Risky
Breaking above 200 normally requires a major supply shock—think trouble at the Strait of Hormuz, surprise OPEC cuts, or a hit to U.S. shale. The Iran–Israel cease-fire is shaky, drones are still buzzing storage sites, and even a brief chokepoint shutdown would send tanker traffic into chaos. To me, the chart is flashing that tail risk.
Trading Plan
• I’ll watch the wedge’s upper trendline around 83 for my first signal
• A weekly close above 93 would clear the path to 117, then 145
• If price closes below 51 on the week, this thesis is off
Your Thoughts?
Does this wave count make sense, or am I reading too much into it? Drop your views—especially if you’ve got the geopolitical angle covered. I hope this wave doesn’t play out, but pretending it’s not there feels reckless.
(Not financial advice)

CRUDE set to fire 82 $ 90 $ 104 $ ????Crude Daily Elliot waves count suggest big UP setup in progress right now
55 $ key level to watch for buyer Extension point
Due to amid middle-east war situation may trigger Up move impulse wave towards 82 $ to 104 $ range
EW count are keeping changing during different price action in different time frame & multiple forecast .
this educational based chart as per EW theory method

CRUDE OIL poised to go UP AGAIN? Usually my posts on crude oil are short. but here’s a longer one for a change.
Back in December, I predicted that crude oil would hit the highlighted zone around $57. That’s exactly what happened, hit the target and bounced.
Over the past two weeks, we’ve seen wild swings in crude oil prices as tensions between Iran and Israel escalated. But now, following the ceasefire announcement brokered by President Trump, and considering Iran’s response over the past couple of days, crude oil has dropped below its pre-conflict price levels.
While I truly hope for a peaceful world where no innocent lives are harmed, my personal view is that this ceasefire feels fragile and may not last long.
So, what’s next for crude oil? Up or down?
If the ceasefire holds and we don’t see further conflict in the Middle East, I think crude oil could hover in the $65–$75 range. There’s even a slim chance we dip as low as $45.
However, based on my technical analysis model, and my doubts about the durability of the ceasefire, I expect oil prices to rise in the next 6 to 9 months. My targets? $78 and $85.
Of course, I might be wrong this time. :)
Cheers!

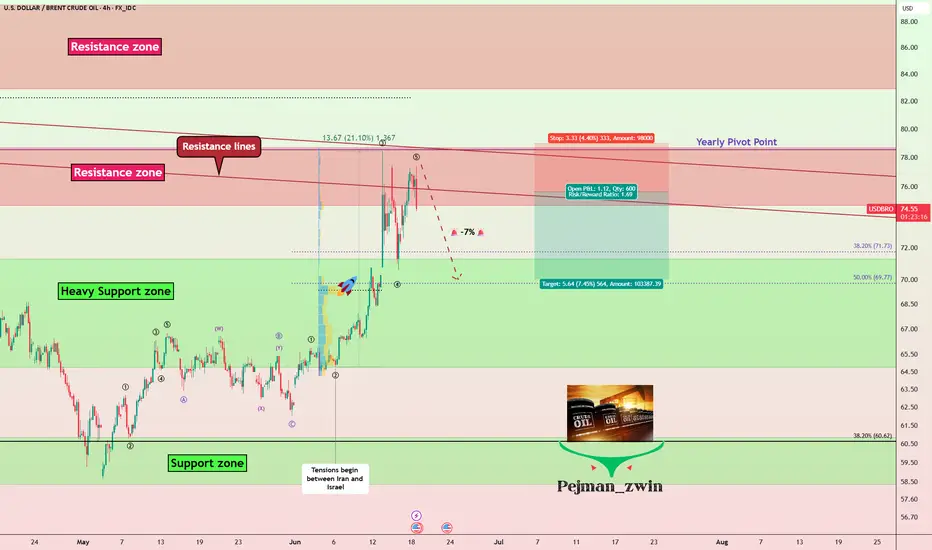
Geopolitics vs. Technical: Will Oil Correct -7%?Oil ( FX_IDC:USDBRO ) rose more than +20% after the start of tensions between Iran and Israel on Friday . I hope this tension ends as soon as possible because tensions have no winners.
The behavior and price movements of oil will certainly depend on the increase or decrease of tensions in the Middle East , but for the coming hours we can have a technical view .
Oil is currently moving in the Resistance zone($78.70-$74.70) and near the Resistance lines and the Yearly Pivot Point .
In terms of Elliott Wave theory , it seems that Oil has completed the second five-impulse waves . So that wave 5 is Truncated .
I expect Oil to decline in the coming hours, this decline could be -7% .
Note: If the USA is added to the Middle East tensions, Oil prices could rise again, so pay more attention to capital management.
Note: Stop Loss: $79.00
Please respect each other's ideas and express them politely if you agree or disagree.
U.S. Dollar/ BRENT CRUDE OIL (USDBRO), 4-hour time frame.
Be sure to follow the updated ideas.
Do not forget to put a Stop loss for your positions (For every position you want to open).
Please follow your strategy and updates; this is just my Idea, and I will gladly see your ideas in this post.
Please do not forget the ✅' like '✅ button 🙏😊 & Share it with your friends; thanks, and Trade safe.
WTI Oil: further downside?Front page news this morning focussed on the ceasefire between Israel and Iran, first announced by US President Donald Trump on his Truth Social platform. However, reports recently emerged of Iran firing missiles, seemingly violating the ceasefire, but no confirmation has been received yet. The point is that things remain somewhat uncertain as of writing.
The technical front, nevertheless, is interesting on WTI Oil (West Texas Intermediate), and ultimately points to a moderate pullback before heading lower.
Monthly descending triangle in play
The flow on the monthly chart reveals that price action completed a descending triangle in April this year, formed between US$95.00 and US$64.41. Following the breach of the lower boundary and refreshing year-to-date (YTD) lows of US$55.15, a determined pullback materialised and resulted in the unit testing the upper barrier of the pattern. As you can see, the test has held for now, with June poised to end the month considerably off its best levels.
Given that price has aggressively rejected the upper boundary of the triangle formation, and if we see WTI push to fresh YTD lows, this would unearth a possible bearish scenario in the direction of support from US$42.57.
Daily Fibonacci resistance
Across the page on the daily chart, you will note that recent flow touched gloves with support at US$64.55, a level complemented by a 1.272% Fibonacci projection ratio at US$64.76, a trendline support (extended from the low of US$55.40), and a neighbouring 61.8% Fibonacci retracement level at US$63.70. Given that the 1.272% Fibonacci projection ratio also represents an ‘alternate’ AB=CD support pattern, traders that are long from US$64.55 may aim for the 38.2% and 61.8% Fibonacci retracement ratios of US$69.53 and US$72.59. Consequently, both of these lines serve as potential resistance levels to watch.
H1 confluence
With monthly price suggesting further selling, and daily resistance on the table, the H1 chart shines the spotlight on two levels of resistance at US$68.35 and US$70.14. However, I am more drawn to the latter level as a potential resistance. This is because it converges closely with the 38.2% Fibonacci retracement ratio on the daily timeframe mentioned above at US$69.53, as well as a nearby 1.618% Fibonacci projection ratio on the H1 chart at US$69.13.
As a result, my focus will be on H1 resistance between US$70.14 and US$69.13.
Written by FP Markets Chief Market Analyst Aaron Hill

OIL: THE CHART THAT COULD TIP THE WORLDWTI Crude just bounced hard off the $65 channel support, tagging resistance at $76 — and what happens next isn’t just about price. It’s about power.
Zoom into this chart:
We're sitting at a directional pivot with two possible outcomes:
1️⃣ If this was a truncated 5th wave, the structure is complete. Any further war escalation could be the catalyst for oil to break resistance — dragging down risk assets, including CRYPTOCAP:BTC and equities.
2️⃣ If wave 5 isn’t done, we’ll likely see one more sharp leg down before oil launches. Either way, this is a high-stakes Elliott Wave setup with global macro consequences.
Chart with FIB Levels:
You'll see the wave I’ve marked (3) is messy, and on lower timeframes, that may hint at a truncated move worth watching.
Why this matters:
Over 20% of global oil flows through the Strait of Hormuz, a critical chokepoint controlled by Iran. If conflict escalates, that line gets squeezed… and oil price explodes.
Price to watch:
$76 resistance.
If oil breaks, the markets will react fast.
If it fails, we might get one more correction and maybe some relief from the sideways pain we’ve seen across risk assets.
Remember the COVID Crash?
Oil literally went below zero in April 2020. That wasn't just a chart anomaly, it was a global demand collapse. Traders were paying to get rid of oil because there was nowhere to store it. That moment marked a generational low, and what followed was a powerful multi-year 5 wave up.
Now look where we are:
That same COVID low helped form the base of the current Elliott Wave structure. The fact we’re back testing levels that once sparked global panic is no coincidence.
If you’ve been here before, you’ll see the signs. The charts always leave traces. And if this is the end of wave 5, it could be the start of a whole new macro move.
TLDR:
Stop trading headlines.
Trade the structure.
This chart is telling us everything.

Oil panic buying after Iran Strikes?President Donald Trump has confirmed that the U.S., in coordination with Israel, has conducted three strikes on Iranian nuclear facilities.
Will there be panic buying of WTI and Brent at the open?
In response, Iran’s parliament has approved a proposal to close the Strait of Hormuz, a key global oil shipping route. The final decision lies with Iran’s Supreme National Security Council and Supreme Leader Ayatollah Ali Khamenei.
If a blockade is enforced, oil prices could rise sharply. ClearView Energy Partners estimates a short-term closure could add between $8 and $31 per barrel. JP Morgan has suggested that a full-scale conflict and complete shutdown could drive prices to $130.

$100 a barrel coming soon for Crude oil futures In this video we focus on the current accumulation in the oil chart and the prospect of higher prices ahead .
I highlight how the respect of the previous quinquennial pivots gave us a 45% move to the upside in the past 8 weeks .
Looking ahead on the monthly timeframe we have the following confluences above the current price of $75 .
Above the current pa we have the point of control at $ 88 and the avwap at $97, if we can reclaim the poc I think we will continue to push up to the fib levels that I have mentioned in the video.
In addition to the above we also have the decennial pivots at $107/$112 alongside the value area high .
All of this validates for me why oil will be pushing back up throughout the course of the year .
Tools used in the video
Tr pocket , pivots , fived range volume profile and fib expansion

TP REACHED ON OUR TRADE ON OILThis morning I posted to sell on Crude Oil, and our TP got filled to close the week with 5 profitable days strike.
Follow for more!

SELL USOILIt’s been a while since I last posted about American market.
You can sell USOIL, the target is the daily Liquidity high and the stop is at the PVH of the reversal.
Follow for more!

Crude oil------Buy around 74.00, target 75.00-76.50Crude oil market analysis:
Crude oil has been strong recently, and it is also because of the support of fundamentals and inventory data that crude oil has begun to strengthen. Today's idea is still bullish on crude oil. Continue to buy after the retracement. The daily moving average has begun to diverge. The small support for buying has reached around 72.00. The suppression position is around 74.00 and 77.60. I estimate that it will form a small shock and then break through and rise again. If it does not break 70.00, it is still strong. Buy crude oil around 74.00 today.
Fundamental analysis:
The interest rate results announced by the Federal Reserve last night remained unchanged at 4.25%-4.50%, and the fourth consecutive meeting remained unchanged, which was in line with market expectations. The uncertainty of the United States about the future has led to no major changes in monetary policy in the near future.
Operational suggestions
Crude oil------Buy around 74.00, target 75.00-76.50

Crude oil---Buy near 72.00, target 72.90-74.90Oil market analysis:
Recently, the daily crude oil line has started to pull up, and buying has begun to rise. The retracement is our opportunity to buy again. The moving average support of the daily crude oil line has begun to move up, and the pattern has reached around 69.60. Today's idea is to buy at 72.00. The pattern is difficult to see, just buy repeatedly. The fight between Iran and Israel is a great support for crude oil. In addition, there is EIA crude oil inventory data today.
Fundamental analysis:
Previously, we have been paying attention to geopolitical factors in the fundamentals. Indeed, the situation in the Middle East has also changed the way of gold and crude oil. Today we focus on the monetary policy of the Federal Reserve, and Chairman Powell's speech during the US trading time.
Operational suggestions:
Crude oil---Buy near 72.00, target 72.90-74.90

Oil Surges on Israel-Iran Nuclear Strike Fears🛢️ Israel’s attacks on Iran’s nuclear sites are pushing oil ( BLACKBULL:WTI , BLACKBULL:BRENT ) higher!
Bloomberg reports Trump’s G-7 exit and Tehran evacuation warning as Israel-Iran strikes intensify (June 17, 2025). Analysts warn of Strait of Hormuz risks, with 17M barrels/day at stake.
4H Chart Analysis:
Price Action: WTI ( BLACKBULL:WTI ) broke $75 resistance (June 2025 high), exiting a 3-week range. Brent ( BLACKBULL:BRENT ) mirrors at $78.
Volume: 4H volume spiked 15% vs. prior week, confirming breakout buying.
Key Levels:
Current Support: $75 (WTI), $78 (Brent) – former resistance, now support.
Next Support: $73 (WTI), $76 (Brent) – prior range lows, tested twice in June.
Context: Oil gained 2% this week, driven by Middle East supply fears, with WTI at a 1-month high.
Trading Insight: The $75/$78 breakouts signal bullish momentum. $73-$76 is a key support zone for dips. Watch Iran retaliation news and volume for supply disruption clues.
What’s your 4H oil trade? Post your setups! 👇 #OilPrice #WTI #Brent #IsraelIran #TradingView

Oil Extends Rally as Israel-Iran Conflict Stokes Supply FearsBrent jumps 5.5 %, bullion hits fresh records, but analysts still see $65 crude by Q4 if key shipping lanes stay open
The crude-oil market loves nothing more than a geopolitical headline, and the one that flashed across terminals this past weekend was a whopper: escalating hostilities between Israel and Iran. Within minutes of the first wire stories, Brent crude vaulted 5.5 % to an intraday high of $76.02 a barrel—its largest single-session pop since Russia invaded Ukraine in early 2022—before giving back part of the gain to settle just under $76. West Texas Intermediate (WTI) traced a similar arc, peaking at $74.11 and closing fractionally lower.
At the same time, investors stampeded into traditional havens. COMEX gold pierced $2,450 an ounce for the first time, while silver sprinted above $33—blowing past the decade-old high set during the meme-metal frenzy of 2021. The twin moves in energy and precious metals underscore how fragile risk sentiment has become even as global demand growth, OPEC discipline, and U.S. shale resilience point to a more balanced physical market later this year.
Below we dissect the drivers of crude’s latest surge, explore the scenarios that could push prices back toward—or away from—the $65 handle by the fourth quarter, and explain why bullion refuses to loosen its grip on record territory.
________________________________________
1. What Sparked the Spike?
1. Tit-for-tat escalation. Reports of Israel striking Iran-linked assets in Syria and Iran responding with drone attacks near the Golan Heights raised fears of a direct Israel-Iran confrontation—a worst-case scenario that could spill into the Strait of Hormuz and threaten 20 % of global seaborne oil.
2. Thin pre-holiday liquidity. Monday volume was 30 % below the 20-day average with several Asian markets closed, exaggerating price swings and triggering momentum-chasing algos.
3. Options market gamma squeeze. Dealers short upside calls scrambled to hedge as spot pierced $75, accelerating the melt-up. Open interest in $80 Brent calls expiring in June ballooned to 45,000 contracts—four times the 3-month norm.
________________________________________
2. How Real Is the Supply Risk?
While the headlines are chilling, physical flows remain intact for now:
• Strait of Hormuz: No tankers have been impeded, insurance premia have widened only 25 ¢ per barrel—well below the $3 spike seen after the 2019 Abqaiq attack in Saudi Arabia.
• Iraqi-Turkish Pipeline: Still shuttered for unrelated legal reasons; volumes have been offline since March 2023 and are therefore “priced in.”
• Suez Canal / SUMED: Egyptian authorities report normal operations.
In short, the rally is risk premia, not actual barrels lost. That distinction matters because premia tend to deflate quickly once tension plateaus, as the market witnessed in October 2023 after Hamas’s initial assault on Israel.
________________________________________
3. Fundamentals Point to Softer Prices by Autumn
Four forces could push Brent back into the $65–68 corridor by Q4 2025 if the geopolitical situation stabilizes:
Force Current Status Q3–Q4 Outlook
OPEC+ Spare Capacity ~5.5 mbpd, most in Saudi/UAE
Ability to add 1–2 mbpd if prices spike
U.S. Shale Growth 13.3 mbpd, record high +0.6 mbpd y/y, breakeven $47–55
Refinery Maintenance Peak spring turnarounds remove 1.5 mbpd demand Units restart by July, easing crude tightness
Global Demand +1.2 mbpd y/y (IEA) Slows to +0.8 mbpd on OECD weakness
Add seasonal gasoline demand ebbing after August, and the supply-demand balance tilts looser just as futures curves roll into Q1 2026 deliveries—a period typically beset by refinery slowdowns and holiday travel lulls.
________________________________________
4. Scenario Analysis: Three Paths for Brent
1. Escalation (20 % probability)
• Direct Israeli strike on Iranian territory → Tehran targets Hormuz traffic
• 3 mbpd disrupted for one month
• Brent overshoots to $100+, backwardation widens above $10
• Biden releases 90 mb from the SPR; OPEC signals emergency meeting
2. Containment (60 % probability)
• Hostilities remain proxy-based in Syria/Lebanon; shipping unscathed
• Risk premium bleeds off; Brent drifts to $70–72 by July
• By Q4 oversupply emerges; prices test $65
3. Detente (20 % probability)
• U.S.-mediated cease-fire; hostages exchanged
• Iran de-escalates to focus on reviving JCPOA talks
• Risk premium collapses; Brent revisits mid-$60s by August and low-$60s into winter
________________________________________
5. Why Gold and Silver Are On Fire
The precious-metals rally is less about oil and more about real yields and central-bank buying:
• Real 10-year U.S. yield sits at 1.05 %, down from 1.55 % in February, boosting gold’s carry cost competitiveness.
• PBoC & EM central banks added a net 23 tonnes in April—the 17th straight month of net purchases.
• ETF inflows turned positive for the first time in nine months, adding 14 tonnes last week.
Silver benefits from the same macro tailwinds plus industrial demand (solar panel capacity is growing 45 % y/y). A tight COMEX inventory cover ratio—registered stocks equal to just 1.4 months of offtake—amplifies price sensitivity.
________________________________________
6. Cross-Asset Implications
1. Equities: Energy stocks (XLE) outperformed the S&P 500 by 3 % intraday but could retrace if crude fizzles. Miners (GDX, SILJ) may enjoy more durable momentum given new-high psychology.
2. FX: Petro-currencies CAD and NOK rallied 0.4 % vs. USD; safe-haven CHF gained 0.3 %. JPY failed to catch a bid, reflecting carry-trade dominance.
3. Rates: U.S. 2-year yields slipped 6 bp as Fed cut odds edged up on stagflation fears, but the move lacked conviction.
________________________________________
7. What Could Invalidate the Bearish Q4 Call?
• OPEC+ Discipline Frays: If Saudi Arabia tires of single-handedly absorbing cuts and opens the taps, prices could undershoot $60—but Riyadh’s fiscal breakeven (~$82) makes this unlikely.
• U.S. Election Politics: A new White House may re-impose harsher sanctions on Iran or ease drilling restrictions, tilting balances either way.
• Extreme Weather: An intense Atlantic hurricane season could knock Gulf of Mexico output offline, squeezing physical supply just as refineries demand more feedstock.
________________________________________
8. Trading and Hedging Playbook
Asset Bias Vehicles Key Levels
Brent Crude Fade rallies toward $80; target $68 by Oct ICE futures, Jul $70 puts Resistance $78.80 / Support $71.30
WTI Similar to Brent NYMEX CL, calendar-spread (long Dec 24, short Dec 25) Resistance $75.20
Gold Buy dips if real yields fall below 0.9 % Futures, GLD ETF, 25-delta call spreads Support $2,390
Silver Momentum long until $35; tighten stops Futures, SLV ETF, 2-month $34 calls Resistance $36.20
Energy Equities Pair trade: long refiners vs. short E&Ps ETFs: CRAK vs. XOP Watch crack spreads
Risk managers should recall that correlation spikes under stress: a portfolio long gold and short crude looks diversified—until a Middle-East cease-fire nukes both legs.
________________________________________
9. Macro Backdrop: Demand Still Fragile
Even before the flare-up, oil demand forecasts were slipping:
• OECD: Eurozone PMIs languish below 50; German diesel demand –7 % y/y.
• China: Q2 refinery runs flatlining; teapot margins < $2/bbl.
• India: Bright spot with gasoline demand +9 %, but monsoon season will clip growth.
On the supply side, non-OPEC production is rising 1.8 mbpd this year, led by Brazil’s pre-salt, Guyana’s Stabroek block, and U.S. Permian efficiency gains. Unless Middle-East barrels exit the market, the call on OPEC crude will shrink from 28 mbpd in Q2 to 26.7 mbpd in Q4, forcing the cartel to decide between market share and price.
________________________________________
10. Historical Perspective: Geopolitical Risk Premiums Fade Fast
Event Initial Brent Jump Days to Round-Trip Barrels Lost?
2019 Abqaiq Attack +15 % 38 < 0.2 mbpd for 30 days
2020 U.S.–Iran (Soleimani) +5 % 10 None
2022 Russia-Ukraine +35 % Still elevated > 1 mbpd rerouted
Based on precedent, a 5–7 % surge without real supply disruption typically unwinds within six weeks.
________________________________________
11. Outlook Summary
• Base Case: Containment; Brent averages $70–72 through summer, melts to $65–68 Q4. Gold consolidates above $2,350; silver churns $30–34.
• Bull Case (Oil): Hormuz threatened; Brent $100+, gas prices soar, Fed forced to juggle inflation vs. growth.
• Bear Case (Oil): Cease-fire + soft demand; Brent breaks $60, OPEC+ grapples with fresh round of cuts.
•
________________________________________
12. Conclusion
The Israel-Iran flashpoint has injected a fresh geopolitical premium into oil and turbo-charged safe-haven metals, but history suggests emotion-driven rallies fade quickly when physical barrels keep flowing. Unless missiles land near Hormuz or an errant drone strikes a Saudi export terminal, the structural forces of rising non-OPEC supply and cooling demand should reassert themselves, dragging Brent back toward the mid-$60s by year-end.
For traders, that means respecting the tape today but planning for mean reversion tomorrow—selling gamma-rich call structures in crude, rolling stop-losses higher on bullion longs, and watching like hawks for any hint that shipping lanes are no longer merely a headline risk but a tangible bottleneck. Until that line is crossed, the smart money will treat each price spike not as the dawn of $100 crude, but as an opportunity to hedge, fade, and position for a calmer, cheaper barrel in the months ahead.
Crude oil-----Sell near 64.00, target 63.00-62.00Crude oil market analysis:
Crude oil is still bearish, and we will continue to sell on rebounds. If it does not break 65.00, it will fluctuate. The general trend is bearish. If it breaks, we will adjust our thinking. Today's crude oil is the key. Will it start to take off before the data? The previous crude oil inventory data did not allow crude oil to break the position. The crude oil fluctuation range is 60.00-65.00. If it breaks this range, we will adjust our thinking on fluctuations.
Operational suggestions
Crude oil-----Sell near 64.00, target 63.00-62.00

Oil Prices Up as Trump Delays EU Tariffs (Temporary Relief?) The global oil market, a sensitive barometer of economic health and geopolitical stability, registered a slight uptick in prices following the news that the Trump administration would extend the deadline for imposing new tariffs on a range of European Union goods. This minor rally, however, comes against a backdrop of a broader downtrend that has characterized the oil markets since mid-January. The persistent downward pressure has been largely attributed to the chilling effect of existing and threatened tariffs, not just between the US and the EU, but on a global scale, which have cast a long shadow over the outlook for global energy demand.
To understand the significance of this deadline extension and its nuanced impact on oil prices, it's crucial to first appreciate the environment in which it occurred. For several months, the dominant narrative surrounding oil has been one of demand-side anxiety. President Trump's "America First" trade policy, which has seen the imposition of sweeping tariffs on goods from various countries, most notably China, and the persistent threat of more to come against allies like the European Union, has injected a significant dose of uncertainty into the global economic system.
Tariffs, at their core, are taxes on imported goods. Their imposition typically leads to a cascade of negative economic consequences. Businesses that rely on imported components face higher input costs, which can either be absorbed, thereby reducing profit margins, or passed on to consumers in the form of higher prices. Higher consumer prices can dampen spending, a key driver of economic growth. Furthermore, the uncertainty created by an unpredictable trade policy environment often leads businesses to postpone investment decisions and hiring, further stagnating economic activity.
This economic slowdown, or even the fear of it, directly translates into weaker demand for oil. Manufacturing activity, a significant consumer of energy, tends to decline. Global shipping and freight, which rely heavily on bunker fuel and diesel, slow down as trade volumes shrink. Consumer demand for gasoline and jet fuel can also wane if economic hardship leads to reduced travel and leisure activities. The retaliatory measures often taken by targeted nations – imposing their own tariffs on US goods – only serve to exacerbate this negative feedback loop, creating a tit-for-tat escalation that further erodes business confidence and global trade flows.
It is this overarching concern about a tariff-induced global economic slowdown that has been weighing heavily on oil prices since the middle of January. Market participants, from large institutional investors to commodity traders, have been pricing in the potential for significantly reduced oil consumption in the months and years ahead if these trade disputes were to escalate or become entrenched. Every new tariff announcement or threat has typically sent ripples of concern through the market, often pushing oil prices lower.
Against this gloomy backdrop, the news of an extension to the tariff deadline on EU goods, while not a resolution, acts as a momentary pause button on further immediate escalation. It offers a temporary reprieve, a brief window where the worst-case scenario of new, damaging tariffs being instantly applied is averted. This is likely why oil prices "edged higher."
The market's reaction can be interpreted in several ways. Firstly, it reflects a slight easing of immediate downside risk to the European economy. The EU is a massive economic bloc and a significant consumer of oil. The imposition of new US tariffs on key European goods, such as automobiles or luxury products, would undoubtedly have a detrimental impact on European industries, potentially tipping already fragile economies closer to recession. An extension of the deadline pushes this immediate threat further down the road, offering a sliver of hope that a negotiated solution might yet be found, or at least that the economic pain is deferred. This deferral, however slight, can lead to a marginal upward revision of short-term oil demand expectations from the region.
Secondly, the extension can be seen as a signal, however faint, that dialogue and negotiation are still possible. In the fraught world of international trade diplomacy, any indication that parties are willing to continue talking rather than immediately resorting to punitive measures can be interpreted positively by markets. It reduces, fractionally, the "uncertainty premium" that has been built into asset prices, including oil.
However, it is crucial to temper any optimism. The fact that oil only "edged higher" rather than surged indicates the market's deep-seated caution. An extension is not a cancellation. The underlying threat of tariffs remains very much on the table. The fundamental disagreements that led to the tariff threats in the first place have not been resolved. Therefore, while the immediate pressure point has been alleviated, the chronic condition of trade uncertainty persists.
The oil market is acutely aware that this extension could simply be a tactical move, buying time for political reasons without altering the fundamental trajectory of trade policy. If, at the end of the extended period, no agreement is reached and tariffs are indeed imposed, the negative impact on oil demand expectations would likely resurface with renewed force. The market is therefore likely to adopt a "wait and see" approach, with traders hesitant to make significant bullish bets based solely on a deadline postponement.
Furthermore, the US-EU trade dynamic is just one piece of a larger global puzzle. The ongoing trade tensions with China, for instance, continue to be a major drag on global growth projections and, by extension, oil demand. Progress, or lack thereof, on that front often has a more substantial impact on oil prices than developments in the US-EU relationship, given the sheer scale of US-China trade and China's role as the world's largest oil importer.
The slight rise in oil prices also needs to be seen in the context of other market-moving factors. Supply-side dynamics, such as OPEC+ production decisions, geopolitical events in major oil-producing regions like the Middle East, and fluctuations in US shale output, constantly interact with demand-side sentiment. A deadline extension on EU tariffs might provide a small boost, but it can be easily overshadowed by a surprise inventory build, an unexpected increase in OPEC production, or signs of weakening economic data from other major economies.
In conclusion, the decision by the Trump administration to extend the tariff deadline on EU goods offered a moment of temporary relief to an oil market that has been under duress from trade war anxieties. This relief manifested as a marginal increase in oil prices, reflecting a slight reduction in immediate perceived risk to global economic activity and oil demand, particularly from Europe. However, this should not be mistaken for a fundamental shift in market sentiment or a resolution to the underlying trade disputes. The threat of tariffs remains, and the broader concerns about a global economic slowdown fueled by protectionist policies continue to loom large. The oil market's cautious reaction underscores the prevailing uncertainty, suggesting that while this extension provides a brief breathing space, the path ahead for oil prices will continue to be heavily influenced by the unpredictable currents of international trade policy.

Crude oil---sell near 61.50, target 61.00-60.00Crude oil market analysis:
Yesterday's crude oil still did not rise. After the daily line was adjusted, the buying and selling game became more obvious. Today, it rebounded and continued to sell. Syria's thawing restrictions have helped to support the continuation of crude oil selling. In addition, the ceasefire between Russia and Ukraine also suppressed crude oil. In the long run, crude oil is unlikely to rise again. Today, pay attention to the short position opportunity of 62.70.
Fundamental analysis:
Recently, there are many fundamentals, but relatively few data, which has a great impact on the market. The Sino-US trade negotiations, the Russian-Ukrainian negotiations, and the India-Pakistan ceasefire have all affected the market.
Operation suggestions:
Crude oil---sell near 61.50, target 61.00-60.00

USOIL UPDATEHello friends
Given the recent growth in oil prices, it is natural for the price to correct. Now we have obtained the most important price support areas for you and we have also specified the target. If you are willing to enter the transaction, be sure to observe capital management.
*Trade safely with us*

Oil Analysis: WTI Approaches the $60 Level AgainOver the past two trading sessions, oil has gained more than 4.5%, and is once again approaching the psychological barrier of $60 per barrel. This recent bullish movement persists despite OPEC+’s clear stance on increasing supply in June and the International Energy Agency’s (IEA) cautious outlook on global oil demand for the remainder of the year. As such, it appears that oil prices are currently benefiting from improving market sentiment, particularly as investors await the outcome of the upcoming U.S.–China trade negotiations.
Persistent Bearish Trend
Since mid-January, oil has maintained a steady downtrend, and so far, minor bullish retracements have not been strong enough to signal a meaningful reversal. Therefore, this downward technical formation remains the dominant structure to monitor in upcoming trading sessions.
RSI
The Relative Strength Index (RSI) continues to hover around the 50 level, indicating a sustained balance between bullish and bearish momentum. As long as this equilibrium remains, a neutral bias could dominate short-term price movements.
ADX
The Average Directional Index (ADX) remains close to the 40 mark, though the line has recently begun to flatten. This could be interpreted as a sign of weakening trend strength in the short term, likely due to the price currently testing a significant resistance zone.
Key Levels to Watch:
$60 – Nearby resistance: A short-term psychological level. A break above this zone could reactivate a bullish bias and potentially lead to the formation of a new short-term uptrend.
$63 – Main resistance: Aligned with the 50-period moving average. Sustained price action above this level could challenge the prevailing long-term bearish structure.
$57 – Nearby support: A zone that matches recent multi-week lows. A drop below this level could reinforce bearish momentum and provide more room for the current downtrend to extend.
Written by Julian Pineda, CFA – Market Analyst

Price OIL will continue falling ?!According to Global Channel
According to minor channel
According to Flag Pattern
According to CCI under zero
According to Breakout Support Level @ 66 USD.
