WTI DAILYWill we see Crude go back into the $100 only time will tell based on the analytical data it shows that market trends are off by a few dollars but we can only guess that it will have to stabilize once we get our reserves replenished and who knows when that will be...
Banking markets have alot of say when it comes to capex dollars being loaned out by producers.
Oilprice

WTI OIL i am sorry for the background noise i will take care of that from next time
let me know if you any dont understand the analyis.

OIL ROAD TO $50 , CHEAP OILHello everyone, I have been using this chart ever since wave 2 and have been shorting OIL since $110ish. Why? We all know oil is overpriced and it went up parabolically after having crashed to negative prices. I believe oil has much more to go down as the PetroDollar is dying. China,alongside BRICS members, have united forces to create the PETROyuan and will definitely yield a problem to the PETROdollar. Prices may even go lower than what I especulate but it does not take rocket science to believe what I know.
Some important facts about OIL we have to remember:
-Oil is one of the most important commodities in the world, used for transportation, heating, and electricity generation. It is a global market with prices affected by supply and demand, geopolitical events, and global economic conditions.
-The major players in the oil market used to be Russia and USA but its now China and mother Russia in an attempt to compete against the US economy.
-The price of oil is typically quoted in US dollars per barrel but that is now changing as oil rich countries are looking for new relationships with BRICS.
-Factors that can impact the price of oil include changes in production levels, geopolitical tensions, natural disasters, and global economic conditions.
-The oil market can be traded through futures contracts, exchange-traded funds (ETFs), and individual stocks of oil companies.
-When analyzing the oil market, it is important to consider both technical analysis (chart patterns, support and resistance levels, and indicators) and fundamental analysis (supply and demand factors, geopolitical risks, and economic data).
Have a nice day everyone!

CL1 SELLWelcome . The oil market is in a negative state. After breaking the bullish flag. We are just waiting for a retest of the downtrend. To further go down to level 76
Note: If you like this analysis, please give your opinion on it. in the comments. I will be happy to share ideas. Like and click to get free content. Thank you

Crude oil continues to fall, where will it stop falling?Crude oil prices continued to fall today, and are currently trading near US 65 per barrel.On the fundamental level, the supply and demand structure of the international crude oil market is still a small oversupply. Unless OPEC has a significant production reduction, it will be difficult to achieve much growth on the demand side.
Although UBS reached an agreement to acquire Credit Suisse over the weekend, and the Federal Reserve and other six major central banks jointly acted to enhance liquidity to appease and stabilize global financial markets, U.S. crude oil once rebounded by more than 1% to US 67.4 per barrel, but worries quickly picked up again, and the United States still has unresolved banking problems. The market is worried that the banking crisis will develop into a global financial tsunami, which in turn will drag down crude oil demand. U.S. crude oil quickly took back gains and continued last week's decline. It is currently down more than 2%, with a minimum of US 64.4 per barrel, which is December 2, 2021. A new low since then.
From the trend point of view, oil prices broke down after a wide-ranging shock at the daily level, and continued to fall after losing the important support of the 70-integer mark. Even if the 70-integer mark was not recovered during the subsequent rebound and the decline continued, the downward break was basically determined. The technical side is biased towards bears, and the future market of oil prices is inclined to further test the support near the December 2021 low of 62.46, and even look at the 60-integer mark.The initial resistance above is near 67. If this position can be recovered, it will increase the possibility of low oil price shock adjustment.
In order to facilitate everyone to continue to follow up on my analysis and sharing, you can like and follow me; in addition, I will share the daily real-time strategy in the channel. If you can't follow up in real time, you may make operational errors.You can use the following methods to enter my channel for free to follow the latest news and follow up on market trends in real time.

Crude oil bears are not finished, predict the trend of crude oilAs the banking crisis hit the global financial and oil markets, NYMEX crude oil and Brent crude oil both fell more than 9% this week, and oil prices will record their largest weekly decline since the week of December 9 last year.
From the perspective of the trend, crude oil rebounded weakly after breaking through the level. Whether it is the daily or weekly line, it is effectively falling below. Pay attention to the trend after a few months of volatility. The market must continue to take advantage of the trend in the short term.
Taken together, crude oil as a whole is still in a bearish trend. At the daily level, crude oil oscillates and breaks downwards, and oil prices lose important support near the 70 mark. The market tends to continue to run downwards in the Bollinger band. The target refers to the position near the low of 62.43 on December 2, 2021.Since oil prices have recorded a longer lower K-line for two consecutive trading days, suggesting strong lower support, a DOJI was recorded on Thursday, and the KD technical indicators are also close to issuing an oversold signal. There is still a possibility of volatility bottoming out in the short term; the initial resistance is near the intraday high of 70, and the short-term resistance can be reasonably lowered to near 68.6-68.8.
In order to facilitate everyone to continue to follow up on my analysis and sharing, you can like and follow me; in addition, I will share the daily real-time strategy in the channel. If you can't follow up in real time, you may make operational errors.You can use the following methods to enter my channel for free to follow the latest news and follow up on market trends in real time.

USOIL BUYHello, the oil market has a high probability of going up. The price reached a very strong support. It is level 66. With very positive candles. subject to buyers' power . Note: If you like this analysis, please give your opinion on it. in the comments. I will be happy to share ideas. Like and click to get free content. Thank you

OIL UPDATE - SHORT TVC:UKOIL
According to the combination of failur in upside movement and negative news around macro economy, i expect more decline for oil price .

Continue to go long on crude oil.
Due to positive data, the oil price continues to rise. Our long position took profit at 76.3. Currently, it seems that there is still momentum for oil to continue its upward trend, with the MACD indicator showing a second bullish crossover on the 2-hour chart. Resistance is near 78.5, so I believe we can continue to enter long positions with a trading strategy of entering around 76.3-75.8 and setting a profit target in the 78-79 range. If the oil price can break through the 79 level, the next target is around 80.8.
TVC:USOIL MCX:CRUDEOIL1!

OIL: Expected to rebound to $80
The oil price also rose nearly $2 under the stimulus of data, reaching a high near $77. On the 30-minute chart, oil underwent a wave of pullback after consolidating near 76.6, and its current position is the previous consolidation level, which has some resistance but not strong. The short-term strong resistance should be around 77.4.
From a technical standpoint, the current process resembles the formation of a U-shaped bottom, with the MACD indicator in a crossover state. If a death cross occurs, it means that oil prices will experience a short-term pullback to seek support, which is likely to be around 75.6-76.
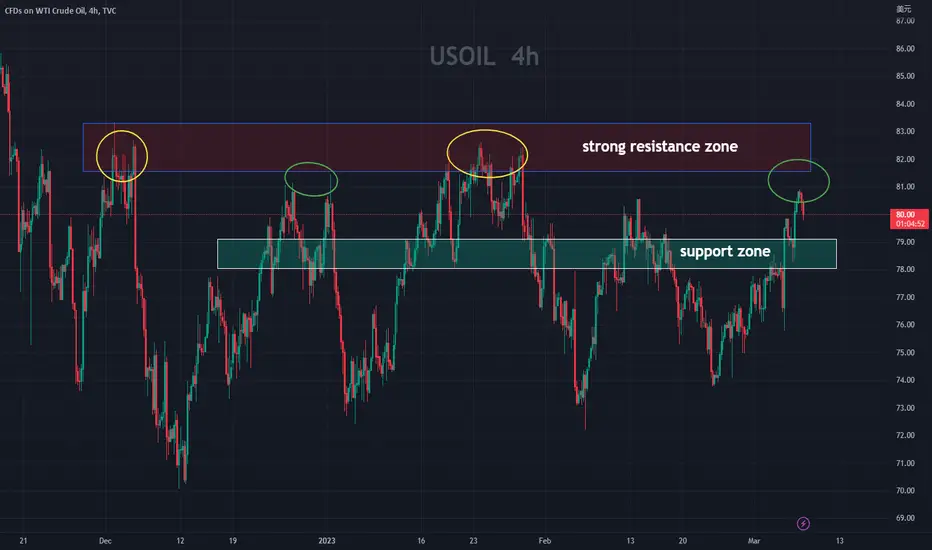
On the 4-hour chart, oil has been oscillating within a box range, and the range of 81-82 is a strong pressure level. The MACD indicator has formed a golden cross, and unless there are unexpected events, the oil price is expected to touch near 81 in the near future.
Therefore, I believe that the current focus should be on long positions for oil, with buying points around the support level near 76. The first target is around 78, and the second target is around 80. If it breaks through 80, it can go up to around 82.
The probability of a one-step trend is not high, and oscillating upward is the most likely event. Every pullback after each rise will be a very good long entry point.
Thank you for your attention and trust. Please continue to follow me, and I will bring you more wonderful insights and help you gain more profits!

Crude Oil CROSSROAD! Reversal or Breakout? 12.0376.80-77.10-20 is a crucial resistance level.
A break above may lead quickly towards 80.80 and beyond.
Keeping below may lead to retest of 74.90 to 73.20 support trend-line.
74.90 is the trend-line, 73.20 is a cluster of horizontal support.
Keep to the range and be patient!
--------------------------------------------------------------------------------------------------------------
I do advise practicing caution while trading, especially leveraged products.
Do your own research and never trade what you cannot afford to lose.
--------------------------------------------------------------------------------------------------------------

Going long on crude oil.
The crude oil is currently trading around 74.8, with some support visible on the 4-hour chart. In the short term, there is upward momentum observed on the 1-hour chart. As a trading strategy, one can go long near 74.8 and target 76.3, with the possibility of further upside if the resistance at 76.3 is breached. If unable to break through, a short position can be considered at 76.3. I will keep you updated in due course.
Short-term trading strategy: Go long near 74.8 with a target of 76.3.
MCX:CRUDEOIL1!

Going short on crude oil at 77.8.
At the start of the Asian market on Thursday, crude oil is currently trading around $76.5 per barrel. On Wednesday, crude oil continued to fall as concerns about more aggressive interest rate hikes weighed on economic growth and oil demand, outweighing the larger-than-expected reduction in US inventories. Although yesterday's decrease in crude oil inventories did not cause significant fluctuations in the price and quickly recovered, it shows that the overall trend of crude oil is weak. My trading strategy remains short, with a focus on selling high.
My trading strategy is to short crude oil at $77.8, with a stop loss at $78.6 and a target of around $75.
Investors can choose their own profit-taking points according to their trading style. The above is only a short-term trading perspective. I will notify you promptly if there are suitable opportunities. Liking, commenting, and subscribing are the best encouragement for me. Follow me to make trading simpler! You are also welcome to read my other ideas below.
MCX:CRUDEOIL1!

OIL: Short above 77 today
Oil saw a high-volume drop below support near 78 yesterday, which turned the immediate position into a resistance level. As of now, there has not been a complete breakthrough and the trend has weakened, so in terms of trading, selling short positions is the main strategy for today, with buying long positions as a secondary strategy.
Specific trading strategies:
Sell short near 77.4-78.5, take profit near 76
Buy long near 75.7-74.2, take profit near 76.5
I will continue to track market trends and share trading strategies in real time. Thank you for your attention and support. If you have any questions, please leave a message in the comments section. I will provide you with the most sincere and responsible solutions to help you solve your problems.
Many things may not yield immediate results at first, but only those who persist in pursuing their goals can experience the joy of success. As the saying goes, "Every cloud has a silver lining." The effort you put in will eventually receive a satisfactory response from time.

OIL: Trade at these levels
Recently, the technical trend of crude oil has mainly been volatile, with support around 76.5-75.7 and short-term resistance around 78.1-78.8.
Trading is dominated by short positions, with long positions being secondary.
Specifically, short positions can be entered around 78.15, with a target around 77.5-77, while long positions can be entered around 76.5-76, with a target around 77.5-78.
I will continue to track the market trends in real-time and share strategies. Thank you for your support and attention, and I hope you continue to follow me as it will contribute to the completeness of the trade. I will also share more interesting trading strategies for you to refer to! If you have any questions, please leave a message in the comments section, and I will provide you with the most reliable solution with the most serious and responsible attitude to help you solve the problem!

The morale of crude Oil bulls is strong, breakthrough!Fundamentals:
On Tuesday (March 7), international oil prices tended to fluctuate.Previously, the UAE's withdrawal from the Organization of Petroleum Exporting Countries was proved to be untrue, and there was a need for technical correction after the surge in oil prices.And cautious investors are waiting for Fed Chairman Powell's upcoming testimony later this week.However, signs of China's economic rebound have prompted Saudi Arabia to continue to increase its prices in Asia, bringing support to the oil market.
Technical aspects:
At the daily level, after oil prices have risen for five consecutive trading days, oil prices have initially stood above the 80 integer mark. The daily line has gotten rid of the downward trend channel, and the opening of the technical indicator Bollinger band continues upward. MACD golden fork, KD stochastic indicator golden fork, technical bullish signal continues, if it can withstand the short-term pullback pressure, it is expected to continue to oscillate higher, the initial resistance is near the Bollinger band rail 82; further strong resistance is near 83, which is where the top of the box that has oscillated extensively since the end of November is located. If it breaks further, it will increase the medium- and long-term bullish signal.
At the 4-hour level, oil prices as a whole are still in the channel of rebounding upward trend, but they are still suppressed by the short-term moving average, and the KD stochastic indicator sends a short-term overbought signal. It is still necessary to beware of the risk of short-term oil prices falling back.However, the short-term volatility here is still within the normal range, which is a technical repair to the short-term rally, and the 79 position of the 20-day moving average below has been transformed into a preliminary support position. If this position is lost, it can be judged to weaken the bullish signal in the future.
Taken together, today's short-term crude oil operation ideas are mainly based on stepping back and lower, supplemented by rebounding high altitude, which can be done at the 79 position and the target position is 80.5

Oil: Go long on this range.
After analyzing the 4-hour chart of crude oil, it is found that yesterday's market first fell and then rose, rebounding after reaching support near 78. In the short term, it has broken through resistance at 79 and 80 and now support has formed around 78 and 79. If there is a substantial breakthrough and stabilization around 81.5, there is a high probability of further rising towards the strong resistance level near 83. However, the market currently needs further consolidation and momentum to complete the potential breakthrough, so we recommend shorting at higher levels and going long at lower levels.
The specific recommendations are as follows:
short around 81-80, long around 79-78, with a stop loss of 70 points and a take profit of 200 points for each.
Ready to buy crude oil again.
Friends who followed my previous article have already sold at the perfect profit point. As expected, the trend is up from 78.5 to 80.5. So, there are still opportunities in the oil market.
Personally, I believe that the 1-hour chart will form support around $80 and then continue to rise. It's not far from the buy point now!
I will update the specific trading strategy later.
Liking, commenting, and subscribing are the greatest encouragement to me. Follow me to make trading easier! Also, welcome to check out my other ideas below.

Specific analysis and ideas of crude oilThe biggest mistake in life is constantly worrying about making mistakes. The greatest sadness in life is not losing too much, but caring too much. This is also a major reason why a person is unhappy.
Last Friday, according to a report from The Wall Street Journal, there were internal discussions within one of the OPEC member countries, the United Arab Emirates, about the possibility of exiting OPEC. The report indicated that there are significant differences between Saudi Arabia and the UAE on various issues, including production capacity releases, competition for foreign investment, and the conflict in Yemen.
The market is concerned that if the United Arab Emirates were to exit OPEC, it would directly undermine the overall influence of OPEC. As a result, WTI crude oil was hit, dropping by 2.7% to $75.83. As a consequence, our previous bearish view on crude oil has yielded good results, and we hope everyone has gained profits. However, later, UAE officials denied the aforementioned report, stating that the UAE has no plans to exit OPEC. As a result, WTI crude oil quickly rebounded, recovering all losses and rising to $79.9, approaching the $80 mark.
Many people are now concerned about whether they should chase the rise of crude oil. Indeed, the decisions made by OPEC member countries will affect the trend of crude oil. Considering that the main disagreement driving the oil market currently is the demand outlook, and in the context of Russia's production cut in March, OPEC+ maintains a strong influence on the market. Therefore, in the short term, oil prices rebounded quickly after the UAE denied its exit from OPEC. However, investors should pay attention to the relationship between the UAE and Saudi Arabia.
With the expectation of a recovery in demand, oil prices are expected to break out of their three-month consolidation range. According to some reports and data, a medium to long-term upward trend in oil prices may have been established, but the process is unlikely to be smooth. From a medium to long-term perspective, the upward trend in oil prices is expected to be established, but considering that US service sector inflation remains high and is difficult to quickly fall back in the short term, this will exacerbate the risk of economic recession in the US and thus impact demand prospects.
Investors this week should pay particular attention to the semi-annual monetary policy testimony of Federal Reserve Chairman Powell in both houses of Congress, as well as key events such as US non-farm payrolls for February, China's trade balance, CPI and PPI, M2 and social financing data, which are expected to have an impact on oil prices in the future.
Technical analysis:
The daily chart shows that WTI crude oil stabilized above $77.0 and further rebounded to touch the $80 level, indicating that the bulls have further upward momentum. It is expected to break through the consolidation range of the past three months ($73.0-$83.0). The author maintains a cautious bullish view on oil prices.
If the oil price breaks above $83.0, it may open up further upside potential, and even have the potential to test the $100 level in the medium term. However, if the oil price falls below $73.0, it is necessary to be vigilant about the possibility of further downside and a potential test of the key support level of $70.
Operation idea:
The main strategy is to buy on dips, and it's also possible to chase the price higher when it breaks through 82. Given the unclear news, it's important to control the position size.

USOIL have a Bullish Momentum Fundamently Usoil Bulls are active and also have fundamental effects we have a chance to buy for short term

OIL SELLWelcome . oil market. in a very negative state. With the price reaching strong support 77.50, and breaking the pattern. double bottom, there is a lot of pressure from sellers to downgrade the market. To 75 levels in the first stage. And level 74 good luck. Note: If you like this analysis, please give your opinion on it. in the comments. I will be glad to share ideas Thank you

WTI OILWTI Oil, a benchmark for crude oil prices, has been gradually rising recently, indicating an uptrend in the market. By analyzing the available charts, it is possible to identify entry points for traders to buy at the same time as identifying an exit point.
To further refine the strategy, traders can use different technical indicators to help them make informed decisions. One potential approach involves looking for a little pullback on the middle trendline, which can serve as a testing ground for a "BUY" signal.
Overall, this strategy can be effective for traders looking to capitalize on the current trend in the WTI Oil market. By carefully monitoring the charts and utilizing appropriate indicators, traders can identify optimal entry and exit points to maximize their profits.

USOIL - CRUDE OIL BULLISH REVERSAL EXPECTED MOVEoil is about to retrace back to 76-78 zone be realistic and never enter before confirmation in LTF
I am not your investment advisor, enter at your own!
