Oil: Go long on this range.
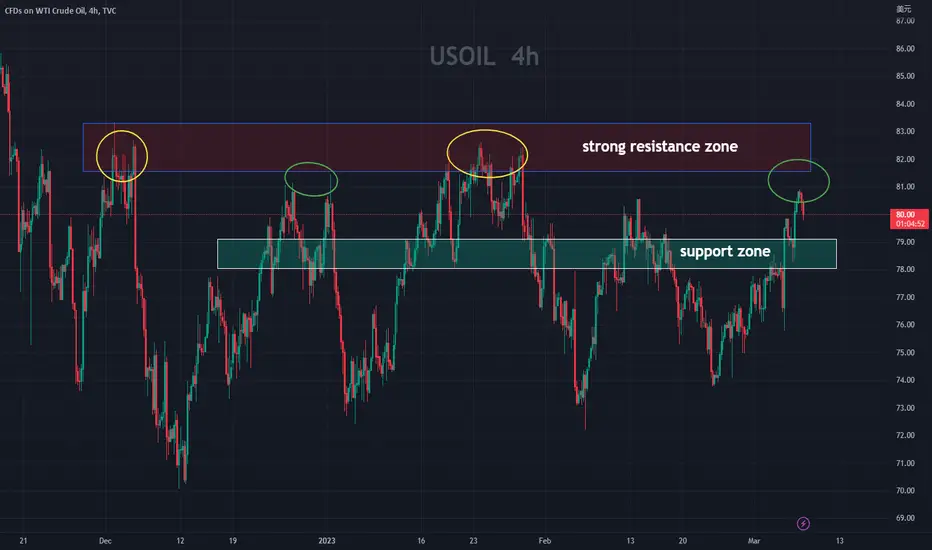
After analyzing the 4-hour chart of crude oil, it is found that yesterday's market first fell and then rose, rebounding after reaching support near 78. In the short term, it has broken through resistance at 79 and 80 and now support has formed around 78 and 79. If there is a substantial breakthrough and stabilization around 81.5, there is a high probability of further rising towards the strong resistance level near 83. However, the market currently needs further consolidation and momentum to complete the potential breakthrough, so we recommend shorting at higher levels and going long at lower levels.
The specific recommendations are as follows:
short around 81-80, long around 79-78, with a stop loss of 70 points and a take profit of 200 points for each.
Oilprice
Ready to buy crude oil again.
Friends who followed my previous article have already sold at the perfect profit point. As expected, the trend is up from 78.5 to 80.5. So, there are still opportunities in the oil market.
Personally, I believe that the 1-hour chart will form support around $80 and then continue to rise. It's not far from the buy point now!
I will update the specific trading strategy later.
Liking, commenting, and subscribing are the greatest encouragement to me. Follow me to make trading easier! Also, welcome to check out my other ideas below.

Specific analysis and ideas of crude oilThe biggest mistake in life is constantly worrying about making mistakes. The greatest sadness in life is not losing too much, but caring too much. This is also a major reason why a person is unhappy.
Last Friday, according to a report from The Wall Street Journal, there were internal discussions within one of the OPEC member countries, the United Arab Emirates, about the possibility of exiting OPEC. The report indicated that there are significant differences between Saudi Arabia and the UAE on various issues, including production capacity releases, competition for foreign investment, and the conflict in Yemen.
The market is concerned that if the United Arab Emirates were to exit OPEC, it would directly undermine the overall influence of OPEC. As a result, WTI crude oil was hit, dropping by 2.7% to $75.83. As a consequence, our previous bearish view on crude oil has yielded good results, and we hope everyone has gained profits. However, later, UAE officials denied the aforementioned report, stating that the UAE has no plans to exit OPEC. As a result, WTI crude oil quickly rebounded, recovering all losses and rising to $79.9, approaching the $80 mark.
Many people are now concerned about whether they should chase the rise of crude oil. Indeed, the decisions made by OPEC member countries will affect the trend of crude oil. Considering that the main disagreement driving the oil market currently is the demand outlook, and in the context of Russia's production cut in March, OPEC+ maintains a strong influence on the market. Therefore, in the short term, oil prices rebounded quickly after the UAE denied its exit from OPEC. However, investors should pay attention to the relationship between the UAE and Saudi Arabia.
With the expectation of a recovery in demand, oil prices are expected to break out of their three-month consolidation range. According to some reports and data, a medium to long-term upward trend in oil prices may have been established, but the process is unlikely to be smooth. From a medium to long-term perspective, the upward trend in oil prices is expected to be established, but considering that US service sector inflation remains high and is difficult to quickly fall back in the short term, this will exacerbate the risk of economic recession in the US and thus impact demand prospects.
Investors this week should pay particular attention to the semi-annual monetary policy testimony of Federal Reserve Chairman Powell in both houses of Congress, as well as key events such as US non-farm payrolls for February, China's trade balance, CPI and PPI, M2 and social financing data, which are expected to have an impact on oil prices in the future.
Technical analysis:
The daily chart shows that WTI crude oil stabilized above $77.0 and further rebounded to touch the $80 level, indicating that the bulls have further upward momentum. It is expected to break through the consolidation range of the past three months ($73.0-$83.0). The author maintains a cautious bullish view on oil prices.
If the oil price breaks above $83.0, it may open up further upside potential, and even have the potential to test the $100 level in the medium term. However, if the oil price falls below $73.0, it is necessary to be vigilant about the possibility of further downside and a potential test of the key support level of $70.
Operation idea:
The main strategy is to buy on dips, and it's also possible to chase the price higher when it breaks through 82. Given the unclear news, it's important to control the position size.

USOIL have a Bullish Momentum Fundamently Usoil Bulls are active and also have fundamental effects we have a chance to buy for short term

OIL SELLWelcome . oil market. in a very negative state. With the price reaching strong support 77.50, and breaking the pattern. double bottom, there is a lot of pressure from sellers to downgrade the market. To 75 levels in the first stage. And level 74 good luck. Note: If you like this analysis, please give your opinion on it. in the comments. I will be glad to share ideas Thank you

WTI OILWTI Oil, a benchmark for crude oil prices, has been gradually rising recently, indicating an uptrend in the market. By analyzing the available charts, it is possible to identify entry points for traders to buy at the same time as identifying an exit point.
To further refine the strategy, traders can use different technical indicators to help them make informed decisions. One potential approach involves looking for a little pullback on the middle trendline, which can serve as a testing ground for a "BUY" signal.
Overall, this strategy can be effective for traders looking to capitalize on the current trend in the WTI Oil market. By carefully monitoring the charts and utilizing appropriate indicators, traders can identify optimal entry and exit points to maximize their profits.

USOIL - CRUDE OIL BULLISH REVERSAL EXPECTED MOVEoil is about to retrace back to 76-78 zone be realistic and never enter before confirmation in LTF
I am not your investment advisor, enter at your own!

oil BrentWe are witnessing a correction in a channelized range that completed the -0.5 shark pattern in this range and we are exactly on the expected correction area of the above pattern, we are in the 50% Fibo area at 75.65 with a little flexibility in the above pattern at the intersection with the midline of the channel along with Two pivot point ranges at the prices of 64.15 and 71.28 can be expected to support the upward movement that can determine the role of the above reduction in dealing with the ceiling.

USOIL - CRUDE OIL Investment & Uses🛢⛽Hi Traders, Investors and Speculators of the Charts 📈📉
Oil gets a bad rap these days, but the stuff is actually quite incredible. Many people think of crude oil as a thick, black liquid that is used to source our unquenchable thirst for gasoline and suffocate marine life. Although this isn't untrue; the reality is that each barrel of oil is refined to be used in a variety of applications that includes fuel, cosmetics, plastics, rubber, and candle wax.
Recently I saw many news outlet's post on the price of crude oil at their economic section. the sentiment was the same - buy. The reasoning was that oil will become more scarce in coming weeks and therefore, the demand will increase. Unsurprisingly, the price of oil has gone DOWN. These are usually coordinated traps in the market, and it's best to counter trade when the media is going with one sentiment.
The price of oil is declining seriously, with strong bearish pressure at $82. We see a nasty double top in the weekly, and I'll be looking for an entry between the support zone pointed out on the chart.
So, why consider oil as an investment?
The truth is, oil isn't going anywhere, any time soon. This is a commodity with a broad use case, and if you plan your trades, low risk trades with good profits can be made.
Here is everything that can be made from just one barrel of oil: 🛢
🚗 Enough gasoline to drive a medium-sized car over 450km (280 miles)
🚛 Enough distillate fuel to drive a large truck for almost 65km (40 miles)
⛽Nearly 70 kWh of electricity at a power plant generated by residual fuel
💥 About 1.8 kg (4 lbs) of charcoal briquettes
🏕 Enough propane to fill 12 small (14.1 ounce) cylinders for home, camping or workshop use
🚧 Asphalt to make about 3.8 L (one gallon) of tar for patching roofs or streets
⚙ Lubricants to make about a 0.95 L (one quart) of motor oil
🎂 Wax for 170 birthday candles or 27 wax crayons
But that’s not all. After producing all of the above products, there’s also enough petrochemicals leftover to be used as a base for one of the following:
👩👧👦 39 polyester shirts
👩🦰 750 pocket combs
😁 540 toothbrushes
🧺 65 plastic dustpans
⭕ 23 hula hoops
🧃 65 plastic drinking cups
🥛 195 one-cup measuring cups
☎ 11 plastic telephone housings
🥎 135 four-inch rubber balls
The above serves as one example of how a single barrel could be used, but here’s a list of many other oil applications. It includes everything from guitar strings to antihistamines. Whatever your opinion is on fossil fuels, it’s still pretty astonishing what can be produced out of each barrel of oil.
Here's a nice infographic to visualize :
_______________________
📢Follow us here on TradingView for daily updates and trade ideas on crypto , stocks and commodities 💎Hit like & Follow 👍
We thank you for your support !
CryptoCheck

Oil buyPeace be upon you, there is a high probability of oil rising with the formation of the descending channel. Now he is correcting the golden ratio of Fibonacci 61%. We have two very positive candles in the four-hour time frame

Oil buyPeace be upon you. How are you? There is a high probability of oil rising with the formation of the ascending channel and the re-testing of the trand. What do you think my friends

Crude oil analysisMy bias about the chart is LONG but i have mentioned both plans long or short depending on the movement of it.

Oil's long term re-test before upcoming rally? 13.2.2023Simple 1+1 equals 2.
There's a couple factors here.
1) Long-term support since March 2023 kept with multiple re-tests.
2) Long-term 8 month wedge consolidation with recent Jan 2023 breakout up together with RETEST of that breakout at 74.80-75.20 as of today.
If the week closes above this support, VERY high chance for continuation of breakout up and 80's-90's even 100 to be reached within coming weeks.
If the support of 74.80-75.20 breaks down, retest of long-term March 2021 to today support trend-line is possible at 71.40-60.
-------------------------------------------------------------------------------------------------------------------
I encourage to do your own research and trade with caution
Thank you for reading and would very much appreciate your comments and questions!
------------------------------------------------------------------------------------------------------------------

WTI Crude oil : The retest to rule them all! 10.5Focus up!
100-101.50 is key retest level of support trend-line stretching back all the way to December 2021, with consistent higher lows.
At the same time, it's also a retest level of the second higher high breakout stretching back from the peak of 128.
China lock down is expected to ease within days, inflation is on the rise, EU oil ban for Russia is likely coming very soon.
An unlikely daily close below 100 could signal further downside to 97 though very unlikely with current fundamental/technical combo.
Do the math and keep the back noise out the picture, look only at key factors and act with caution and patience.
----------------------------------------------------------------------------------------------------------------------------------------------------------------------------------
Thank you so much for reading! If you found my idea useful, it would mean a lot for me if you like and follow!
It's a pleasure for me to help as many traders as possible master trading, so please ask me on the comments anything you'd like.
----------------------------------------------------------------------------------------------------------------------------------------------------------------------------------


OIL BUYA golden opportunity in the oil market with a positive candle and an upward channel with a strong upward correction. Please do not miss the opportunity and thank you dear traders 💷💵🥲♥️

WTI: Safety net 🧗Although the Oil might need a little persuasion, we're expecting the course to drop below the support line at $70.08 to continue with the downwards slope of the blue wave within the green target zone. Once completed, the blue wave should pump the course back up, before it ultimately hits the corrective low of the green wave .

Sell OilOil looks bearish on the weekly timeframe and next month looks bearish with possible new lows to bottom area 60.
Oil on the weekly timeframe is in a descending downtrend channel and currently rebounding back from the upper channel of the downtrend at the resistance and supply zone at area 82 and already this week broke previous two weeks lows.


Long setup wti crudeWait for the price to come in the yellow zone shown in picture then buy long.
Entry = 80.75 - 81.10
Tp = 85 - 85.40
Sl = 79 - 79.30

EURCAD...SHORT (67 Pips)With the recent rally of a barrel of oil, fundamentally the CAD should rally as well. But the dominance of the Euro has made a bit slower process, Technically, looking out fro a short sell on ECAD to its consolidated price zone on 13th Jan, when price was just trading a around my pivot point at 1.45010.
NB: A clear breakout from the breakout zone (Blue Box Region) will accelerate the process!!!

USOil/WTI Short overallhello everyone.. last 2 week we had good bull run for usoil... but as soon it reached 82 the price starts consolidating, like in 4hr tf the price test 82 several times.. however if we look at weekly tf the main resistance is around 84-85.. at this point the price can trick the seller... overall i think its a bear trap (still LH & LL).. the resistance trend line also make more sense at the 84-85 price area. look for a good pullback using high tf for better accuracy... currently the price could go up this week before it pulls back
good luck

Short Idea - XOM Exxon Mobile Corporation - Updated 011923Looking at the chart(s) of XOM Exxon Mobile Corporation , are they signaling a short opportunity on the back of lower growth outlook(s) for 23-24'? 🛢⛽️ 📉
Not going to provide much commentary on the macro outlook for U.S. Crude Oil CL1! CL2! CRUDEOIL1! CRUDEOIL2! WTI1! WTI2!, just the charts of XOM:
XOM Weekly Chart: 📊
XOM Daily Chart: 📊
XOM 4-Hour Chart: 📊
XOM Hourly Chart: 📊
XOM 15-Minute Chart: 📊
Here is a more detailed XOM (Short) analysis from @dRends35: 📉
What do you think about an XOM (Short)? 🛢⛽️ 📉
Let me know in the comments below! 👇🏼
