💡WTI . Weekly Technical Analysis UpdateMidterm forecast:
43.75 is a major support, while this level is not broken, the Midterm wave will be uptrend.
Technical analysis:
While the RSI uptrend #1 is not broken, bullish wave in price would continue.
A trough is formed in daily chart at 40.20 on 11/13/2020, so more gains to resistance(s) 50.70, 54.75, 57.80 and more heights is expected.
Price is above WEMA21, if price drops more, this line can act as dynamic support against more losses.
Relative strength index (RSI) is 74.
❤️ If you find this helpful and want more FREE forecasts in TradingView
. . . . . Please show your support back,
. . . . . . . . Hit the 👍 LIKE button,
. . . . . . . . . . Drop some feedback below in the comment!
❤️ Your Support is very much 🙏 appreciated! ❤️
💎 Want us to help you become a better Forex trader ?
Now, It's your turn !
Be sure to leave a comment let us know how you see this opportunity and forecast.
Trade well, ❤️
ForecastCity English Support Team ❤️
Oilprice

💡WTI . Weekly Technical Analysis UpdateMidterm forecast:
43.75 is a major support, while this level is not broken, the Midterm wave will be uptrend.
Technical analysis:
While the RSI uptrend #1 is not broken, bullish wave in price would continue.
A trough is formed in daily chart at 40.20 on 11/13/2020, so more gains to resistance(s) 50.70, 54.75, 57.80 and more heights is expected.
Price is above WEMA21, if price drops more, this line can act as dynamic support against more losses.
Relative strength index (RSI) is 74.
❤️ If you find this helpful and want more FREE forecasts in TradingView
. . . . . Please show your support back,
. . . . . . . . Hit the 👍 LIKE button,
. . . . . . . . . . Drop some feedback below in the comment!
❤️ Your Support is very much 🙏 appreciated! ❤️
💎 Want us to help you become a better Forex trader ?
Now, It's your turn !
Be sure to leave a comment let us know how you see this opportunity and forecast.
Trade well, ❤️
ForecastCity English Support Team ❤️

OIL WTI Targets $50 Next? Watch Video!Where is OIL WTI headed next?
Our previous tradingview analysis on OIL has offered us and our followers a highly profitable low risk swing trade. Watch the video to learn more about the next trade we will be taking in this market.
If you'd like to learn a trading approach with edge that will help you be consistently profitable, make sure you give us a 'like' and 'follow' so you don't miss any upcoming analysis.


💡Brent Crude Oil - Weekly technical analysis updateMidterm forecast:
46.50 is a major support, while this level is not broken, the Midterm wave will be uptrend.
Technical analysis:
While the RSI uptrend #1 is not broken, bullish wave in price would continue.
A trough is formed in daily chart at 42.70 on 11/13/2020, so more gains to resistance(s) 54.40, 58.65, 62.30 and more heights is expected.
Price is above WEMA21, if price drops more, this line can act as dynamic support against more losses.
Relative strength index (RSI) is 68.
❤️ If you find this helpful and want more FREE forecasts in TradingView
. . . . . Please show your support back,
. . . . . . . . Hit the 👍 LIKE button,
. . . . . . . . . . Drop some feedback below in the comment!
❤️ Your Support is very much 🙏 appreciated! ❤️
💎 Want us to help you become a better Forex trader ?
Now, It's your turn !
Be sure to leave a comment let us know how you see this opportunity and forecast.
Trade well, ❤️
ForecastCity English Support Team ❤️

EUR/GBP: PRICE ACTION ON BULLISH CHANNEL 🔔Welcome back Traders, Investors and Community!
Analysis of #EURGBP
If you have found this useful then help us support my page by hitting the LIKE button.
If you are not subscribed yet then please feel free to follow my page for daily updates and ideas. Thank you
It means a lot to us!
***
Strategy: Price action on bullish channel - We will be waiting for all the confirmations to enter this trade.
A clear chart is Always the best business card for a trader.
***
Your support and feedback will always welcome
Thank you for your time.
The information contained herein is not intended to be a source of advice or credit analysis
Regards,
Walter

Brent Crude Oil in Next DecadeBrent Crude Oil has formed a diametric pattern and will see the targets which is shown in this analysis.

USOIL : a 7 risk reward ratio trade !!!since the idea is based on 30mn time frame, this idea is available only for one day.
let's see if the market will give me reason today
if you like the post, don't hesitate to discuss it with me or thumble up and follow me
thank you

Oil Back to Downtrend - Descending Triangle/Uptrend WaningDescending triangle forming in last 3 days. Uptrend is about to wane and fall under the .236. I think as it falls below and the .236 line is the new resistance, it won't have the strength to move above. Momentum has been sporadic and unreliable, and the inability to gain momentum above 46 is a telling sign that oil can't go up without going back down for now.
However, I think we will see huge upside once more currency devaluation pushes commodities up further in nominal terms. We could talk about the covid shit but who cares about that. It's a misnomer, at this point. The real price movements will be with currency devaluation in the year-to-come. That's all that'll give it strong upward momentum.
I see moves back down to 36 to continue the downtrend. That would be my counterpoint to inflation that would actually have some merit. But we will see dollar devaluation and a push towards status quo which will not only push up the price nominally, but will increase demand because employment will increase a bit. Wouldn't be surprised if Biden's commissars enlist a Civilian Conservation Corps to help maintain employment rate and boost his approval rating.

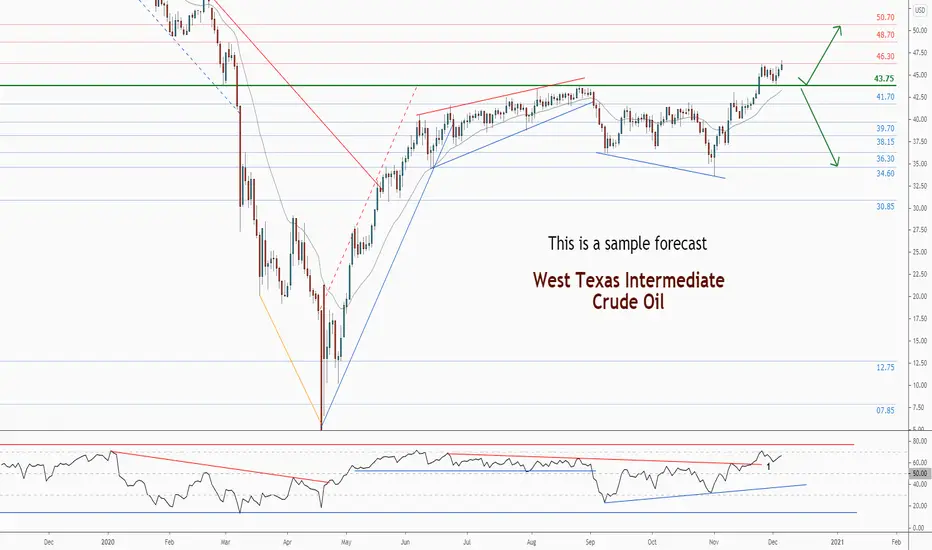
WTI . Weekly Technical Analysis UpdateMidterm forecast:
43.75 is a major support, while this level is not broken, the Midterm wave will be uptrend.
Technical analysis:
The RSI downtrend #1 is broken, so the probability of continuation of uptrend is increased.
A trough is formed in daily chart at 40.20 on 11/13/2020, so more gains to resistance(s) 46.30, 48.70, 50.70 and more heights is expected.
Price is above WEMA21, if price drops more, this line can act as dynamic support against more losses.
Relative strength index (RSI) is 66.
❤️ If you find this helpful and want more FREE forecasts in TradingView
. . . . . Please show your support back,
. . . . . . . . Hit the 👍 LIKE button,
. . . . . . . . . . Drop some feedback below in the comment!
❤️ Your Support is very much 🙏 appreciated! ❤️
💎 Want us to help you become a better Forex trader ?
Now, It's your turn !
Be sure to leave a comment let us know how you see this opportunity and forecast.
Trade well, ❤️
ForecastCity English Support Team ❤️


Brent Crude Oil - Weekly technical analysis updateMidterm forecast:
46.50 is a major support, while this level is not broken, the Midterm wave will be uptrend.
Technical analysis:
The RSI downtrend #1 is broken, so the probability of continuation of uptrend is increased.
A trough is formed in daily chart at 42.70 on 11/13/2020, so more gains to resistance(s) 48.95, 54.40, 58.65 and more heights is expected.
Price is above WEMA21, if price drops more, this line can act as dynamic support against more losses.
Relative strength index (RSI) is 69.
❤️ If you find this helpful and want more FREE forecasts in TradingView
. . . . . Please show your support back,
. . . . . . . . Hit the 👍 LIKE button,
. . . . . . . . . . Drop some feedback below in the comment!
❤️ Your Support is very much 🙏 appreciated! ❤️
💎 Want us to help you become a better Forex trader ?
Now, It's your turn !
Be sure to leave a comment let us know how you see this opportunity and forecast.
Trade well, ❤️
ForecastCity English Support Team ❤️


Possibile AFFECT of ISIS Attacks on Israeli-Egyptian PipelinePossibile AFFECT of ISIS Attacks on Israeli-Egyptian Pipeline and RISING of OIL PRICE ..

OIL 9.55% jump was expected from August high levelUSOIL
*********
⏳4 Hour chart
🎲 Possible entry analysis
⛳️ Possible bull/bear target
📚Educational
—————-❇️——————-
Detailed analysis 💬
1️⃣ Positive vaccine hope-major boost in energy demand
2️⃣ Demand driven recent upward rally
3️⃣ Break and retest happens around 40.00 ( Psychological level )
4️⃣ 44.00 Upper side resistance - Minor Key reversal area
5️⃣ Successful move out of the ranging territory
6️⃣ August high - 43.79 immediate support for bull
7️⃣ Technical support - Bull
8️⃣ 48.00 will acted as key reversal-bearish
9️⃣ June, September, October months low's forming a lower side trend line
🔟 Possible swing target-48.00 Key reversal area
*️⃣ Reverse Parabolic move-Slowing of the momentum
#️⃣ Overall trend - bullish
—————-❇️——————-
📉 Technical bias-H4-Bullish
Price is above 50,100,200 Exponential moving average
50 Exponential moving average will act as support-Bull
Ichimoku cloud -cloud is still green -Cloud supporting the bullish trend
Bollinger band- Price reached around the upper side of the band and middle band is acting as bullish support
Relative strength index - Reached around 50 neutral area 50- Will act as support for bullish trend
MACD -Turned red and fell below the signal line ,oscillators are crossed and pointing downwards
Stochastic - Reached around 60- Oscillators are converging pointing downwards short term fall back expected
—————-✳️——————-
Key reversal area's
44.00 Psychological level/Dynamic support & Resistance
43.79 August month high
48.00 Key reversal area/psychological level
41.86 October month high
4.39 September month high
43.00 Major psychological level
38.00 POC area
43.79 Support level/Possible entry- Bull
48.00 Psychological level/Alternative bearish entry
—————-✳️——————-
Bullish entry #oil #usoil
Entry price - 43.80
Take profit 01 - 45.00
Take profit 02 - 46.20
Take profit 03 - 48.00
🚫 Stop lose 42.30
⬆️ 9.59% Growth expected
⤴️ Account growth 2.05: 9.59
✅ Risk reward ratio 1 : 4.7
—————-⚜️——————-
Push the like button , And cheer up if you found useful

Crude Oil analysis for a buy.As shown on the chart, candlesticks patterns confirm on a 'daily' timeframe how Crude Oil is a buy.
We can see that the respected level has finally being broken and with a continuous bullish candlestick.
Patience will be needed at this point as the market tends to retrace to test that exact price level where it broke our resistance level to turn it into a support level before continuing its trend in an upward manner.
!!!!!! TRADE WITH THE BEST TEAM FOR REGULAR INDICATIONS AND ANALYSIS !!!!!!!
BM_Forex Traders.... The Best Team For Trading.

USD/CAD - Short Sell Set UpWe look at the fundamentals behind a strong Canadian Dollar driven by higher Oil prices.
I show you the relationship between Oil and the Canadian dollar as Oil is Canada's key export, making up 20% of all it's exports.
We look at some Technical Analysis entry strategies, using one-month ATR Volatility for stop-loss area's!!

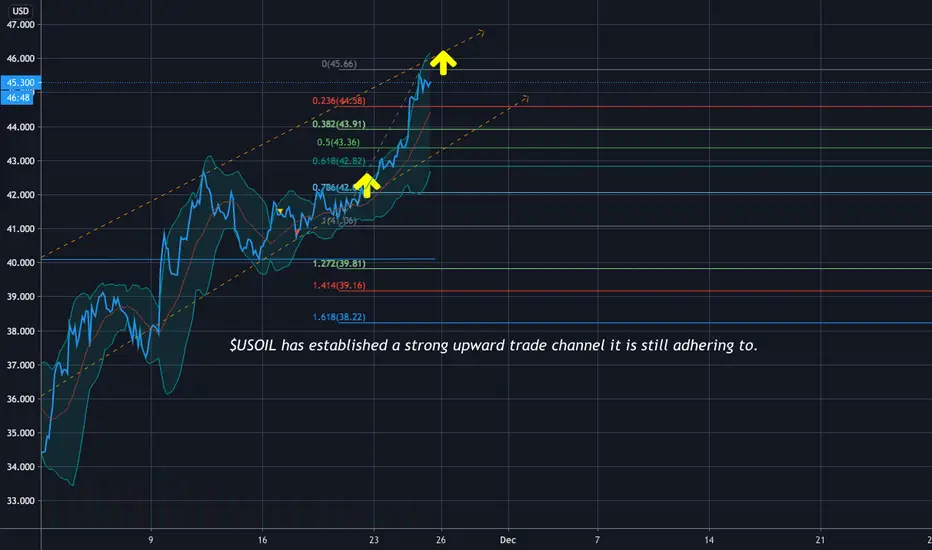
$USOIL bull run fits logic & silences the "Oil is dead" bears!While natural energy is certainly spiking on the speculation Oil has reached the end of its road, there is no sense telling that to the smart traders - the ones still benefitting from a multi-TRILLION dollar industry that will not go quietly. While in developed nations, bidding adieu to crude may happen "SOON" (within 15-years), developing nations will remain reliant on fossil fuels probably clear to the year 2175 if not 2200. Change and progress is not ever unilateral, and in this case, it will not be, nor will the areas of the world reliant on cheaper fuel turn to solar energy before nearly forced to.
OIL could die its death in California when that 2035 initiative passes, but one thing we have learned as United States citizens, is that Cali jumps the gun on EVERYTHING: Marijuana has been legal medicinally there since the mid-90s while still to this point roughly 60% of the other states have not yet done so. So feeding into that 2035 "no oil car" ban is the fact that California is decades "ahead" of the rest of the states when it comes to these "signs of progress."
Oil trading will die *someday*, and it will die quickly when the alternative energy is actually CHEAPER -- right now? It's nowhere close, meaning the transition, probably is not either.
This is all very speculative thought, but for anyone thinking OIL IS DEAD, they have a lot of homework to do before expecting every nation to conform to the whims of the self-proclaimed "Progress(ed)." The world has never worked that way to this point, so the OIL IS DEAD ALREADY crowd is not only ignoring history, but also ignoring the present. OIL returned to 45+ per barrel yesterday, and while the highs of 2018 may loom unrealized forever, there is plenty of LIFE IN DEATH, in using dead organisms' crude oil to power ...yes, even natural energy. Unless the fuel is 100 percent solar, it's coming from fossils at the root of it. There is no convenient way around this fact, for the naysayers.
Unsurprisingly, logic is winning again, and OIL BULLS are counting big profits the last week or so.
Hard to count profit from something that is dead, eh?
GO GET EM,
-BDR
Post-note: Want to gain? Check out the related IDEA (not advice! haha!) of the $GUSH oil ETF.
BUY OIL (Brent)Oil prices are climbing to the Upside as the positive developments for a Vaccine that could be rolled out as early as next month, is extremely positive for the demand outlook for Oil in 2021.
We look at entry price, stop loss and upside targets.
One month ATR Stop Loss included.
