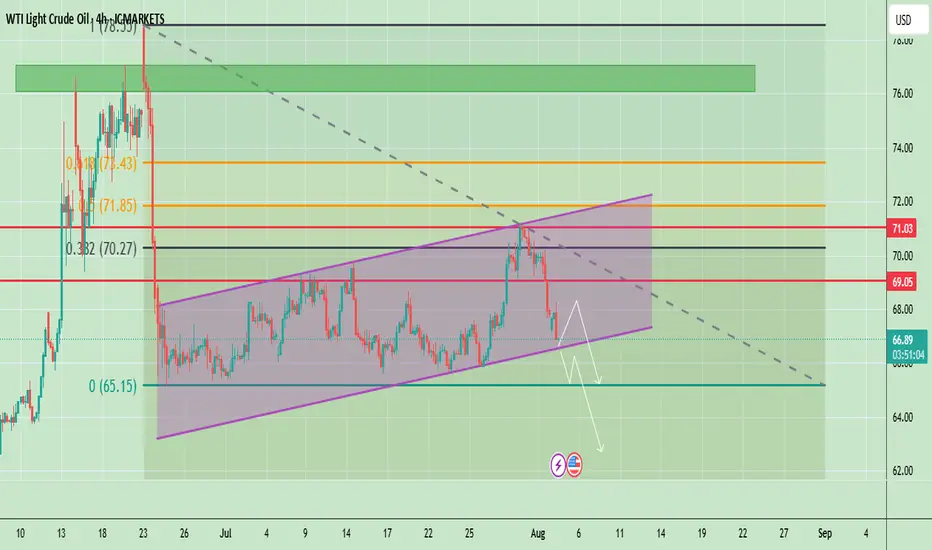
Oil at Key Support – Bounce or Breakdown?Crude oil is trading around $66.94, showing a bearish correction after failing to hold above $69.05. The chart shows price respecting an ascending channel but currently testing its lower boundary. The recent drop signals weakening bullish momentum, and a confirmed break below the channel could accelerate selling pressure toward lower levels.
📈 Potential Scenarios
- Bullish Rebound: If price holds above the channel support (~$66.00–$66.50) and breaks back above $69.05, it may target $71.03 and possibly $72.00.
- Bearish Breakdown: A confirmed close below $66.00 can accelerate the downside toward $65.00, with extended targets near $63.50–$62.00.
📊 Key Technical Highlights
- Price rejected from the channel top and is now testing lower support.
- Key resistance zones: $69.05 (immediate), $71.03 (major).
- Key support zones: $66.00 (channel), then $65.00–$63.50 (breakdown targets).
- Momentum indicators show weakening buying pressure, favoring cautious trading.
🔑 Key Levels to Watch
- Resistance: $69.05 → $71.03 → $72.00
- Support: $66.00 → $65.00 → $63.50
🧭 Trend Outlook
- A short-term relief bounce is possible, but failure to reclaim $69.05 keeps sellers in control.
- Breaking below the channel would shift the overall outlook to bearish for August.
Note
Please risk management in trading is a Key so use your money accordingly. If you like the idea then please like and boost. Thank you and Good Luck!
Oilshort!
Crude oil-----sell near 67.50, target 65.00-63.00Crude oil market analysis:
Crude oil has started a new contract. The new contract is still not moving much at present, and the contract spread is not much. The daily line has begun to decline. Today's idea is to sell at a rebound of 67.50. The suppression position is 67.50 and 69.00, and the support is around 64.00. If this position is broken, there will be a greater room for decline.
Fundamental analysis:
There is no major news in the recent fundamentals. The situation in the Middle East is still relatively stable. There is no new rest on tariffs, and the impact on the market is limited.
Operational suggestions:
Crude oil-----sell near 67.50, target 65.00-63.00

Crude oil---sell near 67.50, target 65.00-60.00Crude oil market analysis:
Crude oil has also started to fluctuate recently. Pay attention to the impact of contract delivery on the trend of crude oil. The daily line of crude oil does not show the strength of its rebound. In terms of operation, it is still a rebound sell. Crude oil continues to be bearish. The situation in the Middle East has not made any major moves temporarily, and the support for crude oil is limited. Pay attention to the selling opportunities near 67.30 today.
Operational suggestions:
Crude oil---sell near 67.50, target 65.00-60.00

Crude oil-----Sell near 66.80, target 65.00-62.00Crude oil market analysis:
The recent crude oil daily line began to decline, but a small V appeared last night, which was also caused by the situation in the Middle East. Israel bombed Syria and crude oil began to rebound. Overall, crude oil is still bearish. We consider continuing to sell it when it rebounds. It has not broken near 64.00, and it is difficult to form a large unilateral. The suppression position is near 66.80. Consider selling it near it.
Fundamental analysis:
Trump’s dissatisfaction with Powell has not been a day or two. Conflict is inevitable, and the impact on gold is also short-term. Yesterday’s pull-up and dive is a case in point.
Operational suggestions
Crude oil-----Sell near 66.80, target 65.00-62.00

Crude oil------sell near 70.00, target 66.70-63.00Crude oil market analysis:
Recently, crude oil has been rising, and buying is slowly climbing, but the amplitude is not particularly large. The daily line has not formed a large buying pattern. It is currently a technical repair market after falling too much. Today's idea is to sell on the rebound. Pay attention to the suppression near 70.00. If this position is broken, it may change the short-term trend and buying may rise.
Fundamental analysis:
Last week, Trump increased tariffs on Canada and is about to increase tariffs on Brazil. There is no sign of stopping the tariff war. It is long-term bullish for gold. The situation in the Middle East has not completely stopped, and it is also long-term suppression of the US dollar to support gold.
Operation suggestions:
Crude oil------sell near 70.00, target 66.70-63.00

WTI Oil – From Conflict to StrategyBack on April 24, I marked a short zone. On June 11, price broke above that level, giving a long opportunity — which I took.
Unfortunately, it coincided with the tragic military strike by Israel on Iran, pushing oil sharply higher. I’ve pinned that analysis.
Following the ceasefire, price dropped again — just a reminder that geopolitics can shake the charts.
As traders, we stay prepared to act, even while acknowledging the deep sadness of lives lost.
Now I wait for price to reach my marked level again. If I get a valid signal, I’ll short.
But if price breaks and holds above, I’ll buy the pullback — with no bias, just pure execution.
Risk-managed. Emotion-neutral. Opportunity-focused.

Crude oil---Buy near 72.00, target 72.90-74.90Oil market analysis:
Recently, the daily crude oil line has started to pull up, and buying has begun to rise. The retracement is our opportunity to buy again. The moving average support of the daily crude oil line has begun to move up, and the pattern has reached around 69.60. Today's idea is to buy at 72.00. The pattern is difficult to see, just buy repeatedly. The fight between Iran and Israel is a great support for crude oil. In addition, there is EIA crude oil inventory data today.
Fundamental analysis:
Previously, we have been paying attention to geopolitical factors in the fundamentals. Indeed, the situation in the Middle East has also changed the way of gold and crude oil. Today we focus on the monetary policy of the Federal Reserve, and Chairman Powell's speech during the US trading time.
Operational suggestions:
Crude oil---Buy near 72.00, target 72.90-74.90

Oil - Short Term Sell Trade Update!!!Hi Traders, on April 17th I shared this idea "Oil - Looking To Sell Pullbacks In The Short Term"
I expected to see bearish continuation until the two Fibonacci resistance zones hold. You can read the full post using the link above.
Price moved lower as per the plan here!!!
Price respected the first Fibonacci resistance zone, created a false break of it and moved lower as expected!!!
If you enjoy this idea, don’t forget to LIKE 👍, FOLLOW ✅, SHARE 🙌, and COMMENT ✍! Drop your thoughts and charts below to keep the discussion going. Your support helps keep this content free and reach more people! 🚀
-------------------------------------------------------------------------------------------------------------------
Disclosure: I am part of Trade Nation's Influencer program and receive a monthly fee for using their TradingView charts in my analysis.

Oil - Short Term Sell Trade Update!!!Hi Traders, on April 17th I shared this idea "Oil - Looking To Sell Pullbacks In The Short Term"
I expected to see bearish continuation until the two Fibonacci resistance zones hold. You can read the full post using the link above.
The price is currently holding in the first Fibonacci resistance zone.
Until both the Fibonacci resistance zones hold my bearish view still remains.
If you enjoy this idea, don’t forget to LIKE 👍, FOLLOW ✅, SHARE 🙌, and COMMENT ✍! Drop your thoughts and charts below to keep the discussion going. Your support helps keep this content free and reach more people! 🚀
-------------------------------------------------------------------------------------------------------------------
Disclosure: I am part of Trade Nation's Influencer program and receive a monthly fee for using their TradingView charts in my analysis.

OIL...SHORT BLACKBULL:WTI
is approaching the key resistance zone at .
I'm watching closely for a valid reaction before considering any position.
***If the level breaks and price retests it successfully, I may consider a counter-directional setup.

Oil - Looking To Sell Pullbacks In The Short TermH4 - Strong bearish move.
No opposite signs.
Currently it looks like a pullback is happening.
Expecting bearish continuation until the two Fibonacci resistance zones hold.
If you enjoy this idea, don’t forget to LIKE 👍, FOLLOW ✅, SHARE 🙌, and COMMENT ✍! Drop your thoughts and charts below to keep the discussion going. Your support helps keep this content free and reach more people! 🚀
--------------------------------------------------------------------------------------------------------------------
Disclosure: I am part of Trade Nation's Influencer program and receive a monthly fee for using their TradingView charts in my analysis.

Crude oil---sell near 62.00, target 60.00-59.00Crude oil market analysis:
The crude oil pattern shows that it is starting to hover at the bottom. Continue to sell when it rebounds. If the 65.30 position is not broken, you can stick to the bearish idea. The recent tariffs and fundamentals of crude oil make it difficult to rise, and the previously announced inventory data has also increased a lot. Crude oil rebounds to 62.00 today and can be sold. If it breaks, the next selling position is around 63.80.
Fundamental analysis:
There are not many data this week, but there are still many fundamentals. Note that the market will rest on Friday this week, which is Good Friday.
Operation suggestions:
Crude oil---sell near 62.00, target 60.00-59.00
Crude oil-----sell near 61.00, target 69.00-67.00Crude oil market analysis:
Tariffs have been increased again, and crude oil continues to fall sharply. It is difficult to change the short-term selling of crude oil. In addition, data and fundamentals all suppress it. Today's crude oil can continue to find selling opportunities. The crude oil pattern shows that the possibility of a big rebound is small. We pay attention to the suppression position of its moving average, which has dropped to around 61.80. This position is also the high point of yesterday's rebound. Today's idea will rely on this position to sell it. The first suppression of crude oil is around 59.30, and the strong pressure is 61.80.
Fundamental analysis:
The tariff war continues to affect the market, and buying and selling have begun a big game. We will pay attention to CPI later, and there will be crude oil inventory data today.
Operation suggestions:
Crude oil-----sell near 61.00, target 69.00-67.00

USOil Sell 70.000Crude oil has been fluctuating and rising recently, reaching a three-week high. From a fundamental perspective:
Supply: The United States has intensified its energy sanctions against Iran. Attacks on Saudi facilities have affected their performance. The OPEC+ will gradually lift the voluntary production cuts starting from April and may increase production for the second time in May. The 30-day ceasefire agreement between Russia and Ukraine has not been effectively implemented in substance. However, recently, the United States, Russia, and Ukraine have reached some consensus on Black Sea navigation and the protection of energy facilities.
Inventory: According to API data, for the week ending March 25, U.S. crude oil inventories dropped significantly by nearly 9 million barrels. However, commercial crude oil inventories have been increasing continuously for several weeks, and the overall inventory remains at a high level.
Geopolitics: The U.S. airstrikes against the Houthi armed group in Yemen and Israel's military operations in the Gaza Strip have heightened concerns about the disruption of crude oil supplies in the Middle East. The United States' continuous strengthening of sanctions against Iran and Venezuela also includes a plan to impose a 25% tariff on countries importing Venezuelan crude oil.
Production Increase Pressure: The daily supply increments of non-OPEC countries (such as the United States and Brazil) far exceed the global demand growth rate, which has long-term downward pressure on the oil price center.
💎💎💎 USOIL 💎💎💎
🎁 Sell@70.000 - 70.200
🎁 TP 68.5 68.0 67.5
The market has been extremely volatile lately. If you can't figure out the market's direction, you'll only be a cash dispenser for others. If you also want to succeed,Follow the link below to get my daily strategy updates

OIL Today's strategyIn the medium term, because the lower edge of the channel has been broken, the short force is relatively dominant, and crude oil may face certain downward pressure.
However, today's crude oil prices are affected by tightening expectations on the supply side, geopolitics and other factors, and the short-term trend is strong, and there is a certain upward momentum on the technical side. Investors need to pay close attention to the breakout of key support and resistance levels.
OIL Today's strategy
buy@67.5-68
tp:69-69.5
We share various trading signals every day with over 90% accuracy
Fans who follow us can get high rewards every day
If you want stable income, you can contact me

OIL Today's strategyIn the short term, there is a simultaneous advance of the long positions in crude oil. The price has tested the vicinity of $68.5 several times but encountered resistance. Moreover, after reaching around $65.2 at the lower level, it rebounded rapidly. The market still needs further testing. In the short term, it is advisable to sell high and buy low within the range of $68.5 to $65.2.
OIL Today's strategy
sell@67.5-67.9
buy:65.7-66.2
If you don't know how to do it, you can refer to my transaction.

BRENT SELL/SHORTBy utilizing Fibonacci retracement levels, historical patterns, , we can formulate a hypothesis that the market might follow a similar trajectory if bearish sentiment prevails.

OIL Ready To Go Down Hard,Don`t Miss This Chance To Get 500 PipsHere is 4h time frame and we have a very good daily closure below our support and now it`s working as a good res to force the price to go down for 500 pips , so i`m waiting the price to go up a little to retest the broken support and then give us a good bearish price action and then we can enter a sell trade with 500 pips target.
This Is An Educational + Analytic Content That Will Teach Why And How To Enter A Trade
Make Sure You Watch The Price Action Closely In Each Analysis As This Is A Very Important Part Of Our Method
Disclaimer : This Analysis Can Change At Anytime Without Notice And It Is Only For The Purpose Of Assisting Traders To Make Independent Investments Decisions.

Oil Short 4HI’m excited to share my next setup for Oil. This trading idea is based on correction levels.
The main idea area is between 80.35 and 80.25. However, since oil tends to react to the 50 levels, I prefer to focus on the 80.5 level for my entry.
For the 4-hour entry, I am waiting for the formation of an M pattern with a lower peak at the second base. I’ll be looking to take scalp sell at the levels of 80.25, 80.35, and 80.5 for the first touches. after that, I'm going to wait for the confirmation to take the main Sell.
Please note that, typically, upon the first collision, we could experience either an impulse or a rejection entry. At the second base, we should wait for a consolidation area to confirm our entry. For a better understanding of this setup, please refer to my previous oil chart.
TP1: 79.9
TP2: 79.2
TP3: 77.4
SL: 81.35
Please remember that trading carries risks, and it's crucial to do your own research. The ideas shared here reflect my personal analysis and may not guarantee success. Always trade responsibly and consider seeking professional advice if needed.
Happy trading!

OilUS Oil - Crude Oil
Symmetrical Triangle in Long Time Frame
Break of Structure
Demand Zone
Falling Wedge as an Corrective Pattern in Short Time Frame
Change of Characteristics

OIL IDEA: SHORT/SELL (W/B: 23/12/24)Guys! It’s almost the end of the year!
This one is quite self explanatory… order flow is bearish - we’ve had a break of structure to the down, so price is looking to tap back in to finish the sell. The trade I’m showing is RR: 2.80, with the final TP of RR: 4.14. Enjoy and good luck!
Last couple posts will be my last until probably mid January

OIL Short - Don't Slip On Your Longs BoysHey everybody, so while obviously the media is all about the Israel conflict I think we are still far away from being at the bottom. We just wicked today, on a monday, the friday high, started to show some major rejection signs which gives me the green light for a short "experiment" to finally wick the low weekly and daily levels. Remember boys, the best trades appear when the masses got stop out, not the other way around.

XTIUSD SELLHi fellow traders, XTIUSD is ready to make a move lower from the blue box after completing the ABC correction. Target the 67.86 level. Good luck and trade safe!
