The rise of crude oil bulls is unstoppable?Because the banking crisis has temporarily eased, supply disruptions in northern Iraq have exacerbated supply tensions, and signs of increased demand from China have provided stronger support for oil prices.
Judging from the trend of crude oil, after yesterday's sharp rise in oil prices, it rebounded to above US 70, and the technical bullish signal was significantly strengthened.However, although the current oil price has returned to the range of the box, on the whole, the current price has basically touched the vicinity of the pressure zone of the box shock in the early stage, and it has also touched the pressure position of the channel in the short term.Oil prices are under pressure at the point of pressure, and the strength of today's rebound is not as strong, so the rebound that tends to be on the daily line in the short term may be almost gone, then the short-term trend may face a certain level of adjustment.On the other hand, after the last wave of the 4-hour-level trend rose, the price temporarily remained at a high level of narrow volatility. On the hourly-level trend, after a continuous narrow sideways movement, the technical pattern began to gradually weaken, so there may be a trend of spatial correction in the short term.
Short-term trading reference: sell crude oil near 73.80, stop loss level 74.2, take profit level 73.1-73
In order to facilitate everyone to continue to follow up on my analysis and sharing, you can like and follow me; in addition, I will share the daily real-time strategy in the channel. If you can't follow up in real time, you may make operational errors.You can use the following methods to enter my channel for free to follow the latest news and follow up on market trends in real time.
Oilshort!

2023 tradingdesk for OILFrom now i will have one main idea, and all the ideas as we reach cycle targets for the year will be updated in the thread.
I dont trade short term, keep in mind my ideas are longer term, and its boring.
We wait for the cycles to bottom and we wait once in the trade for the trade to mature.
Fallow, like so you dont miss the updates.

CL1 SELLWelcome . The oil market is in a negative state. After breaking the bullish flag. We are just waiting for a retest of the downtrend. To further go down to level 76
Note: If you like this analysis, please give your opinion on it. in the comments. I will be happy to share ideas. Like and click to get free content. Thank you

USOIL BUYHello, the oil market has a high probability of going up. The price reached a very strong support. It is level 66. With very positive candles. subject to buyers' power . Note: If you like this analysis, please give your opinion on it. in the comments. I will be happy to share ideas. Like and click to get free content. Thank you

WTI BEARISH OUTLOOKWTI had fallen for 3 consecutive days in Wednesday. The bank crisis is calling banks to deleverage their positions, pulling back on their exposure on oil and causing the price to fall.
International Energy Agency (IEA) is also reporting that the current situation in the oil market is a situation of oversupply, while Russia is looking for buyers for its oil.
The price of WTI broke the support of the rising wedge pattern and continues to drop. Both MACD and RSI indicators are confirming the pattern as well.
If the current scenario continues, the price might reach levels of 62 or even 54.
In the opposite scenario the price might reach levels of 77.5 and pivot into an uptrend.
Risk Disclosure: Trading Foreign Exchange (Forex) and Contracts of Difference (CFD's) carries a high level of risk. By registering and signing up, any client affirms their understanding of their own personal accountability for all transactions performed within their account and recognizes the risks associated with trading on such markets and on such sites. Furthermore, one understands that the company carries zero influence over transactions, markets, and trading signals, therefore, cannot be held liable nor guarantee any profits or losses.

OIL UPDATE - SHORT TVC:UKOIL
According to the combination of failur in upside movement and negative news around macro economy, i expect more decline for oil price .

Crude Oil CROSSROAD! Reversal or Breakout? 12.0376.80-77.10-20 is a crucial resistance level.
A break above may lead quickly towards 80.80 and beyond.
Keeping below may lead to retest of 74.90 to 73.20 support trend-line.
74.90 is the trend-line, 73.20 is a cluster of horizontal support.
Keep to the range and be patient!
--------------------------------------------------------------------------------------------------------------
I do advise practicing caution while trading, especially leveraged products.
Do your own research and never trade what you cannot afford to lose.
--------------------------------------------------------------------------------------------------------------

Short crude oil when reboundingBecause the market is vigilant about frequent and more substantial interest rate increases by the Federal Reserve, concerns about the global recession have increased, and the global stock market has generally weakened, which has dragged down oil prices.
On the daily chart, oil prices continued to weaken in the short term, and fell back after the rebound in the previous trading day was blocked, suggesting strong selling pressure above.From the technical structure point of view, oil prices have still been in a wide fluctuation trend in recent months, and at the same time, they have also formed a short-term wedge-shaped consolidation trend to make a transitional market before the direction is chosen.The current support and strong support for oil prices are the 74.3 line on the wedge-shaped extension cord and the 72.3 line on the extension cord of the shock box below. The resistance above the short period is at the 76.5 line, and the stronger resistance is at the 77.6 line at the intersection of the short-period moving average and the Bollinger band.
In order to facilitate everyone to continue to follow up on my analysis and sharing, you can like and follow me; in addition, I will share the daily real-time strategy in the channel. If you can't follow up in real time, you may make operational errors.You can use the following methods to enter my channel for free to follow the latest news and follow up on market trends in real time.

OIL: Short above 77 today
Oil saw a high-volume drop below support near 78 yesterday, which turned the immediate position into a resistance level. As of now, there has not been a complete breakthrough and the trend has weakened, so in terms of trading, selling short positions is the main strategy for today, with buying long positions as a secondary strategy.
Specific trading strategies:
Sell short near 77.4-78.5, take profit near 76
Buy long near 75.7-74.2, take profit near 76.5
I will continue to track market trends and share trading strategies in real time. Thank you for your attention and support. If you have any questions, please leave a message in the comments section. I will provide you with the most sincere and responsible solutions to help you solve your problems.
Many things may not yield immediate results at first, but only those who persist in pursuing their goals can experience the joy of success. As the saying goes, "Every cloud has a silver lining." The effort you put in will eventually receive a satisfactory response from time.

Will crude oil continue to rebound strongly? Long or short?In the crude oil market, due to the larger-than-expected decline in U.S. crude oil inventories and bullish expectations for Chinese demand, concerns that the Federal Reserve's more aggressive interest rate increases will slow economic growth and weaken oil consumption have limited the rebound in oil prices, so the crude oil market is still uncertain.
Judging from the trend, the current crude oil has rebounded strongly in the short term after fluctuating at a low level, but it is not enough to change the daily shorting situation, indicating that the overall trend of crude oil at a large level is still weak.Although the short-term rebound is shown on the 2-hour level chart, the short-term rebound is quite strong, but the pressure is heavy above, and the short-term continuity is a problem. It may continue slightly, but it is difficult to say how much room there is to continue without breaking the low range for the time being.Short-term may be accompanied by resistance loops, the market has returned to operate within the weak range.
In terms of strategy, yesterday's thinking was also high-level shorting, but today's thinking is still high-level, supplemented by low-level long-selling.
Crude oil is shorted near 77.8-78, and the first target is near 75.5
In order to facilitate everyone to continue to follow up on my analysis and sharing, you can like and follow me; in addition, I will share the daily real-time strategy in the channel. If you can't follow up in real time, you may make operational errors.You can use the following methods to enter my channel for free to follow the latest news and follow up on market trends in real time.

OIL: Trade at these levels
Recently, the technical trend of crude oil has mainly been volatile, with support around 76.5-75.7 and short-term resistance around 78.1-78.8.
Trading is dominated by short positions, with long positions being secondary.
Specifically, short positions can be entered around 78.15, with a target around 77.5-77, while long positions can be entered around 76.5-76, with a target around 77.5-78.
I will continue to track the market trends in real-time and share strategies. Thank you for your support and attention, and I hope you continue to follow me as it will contribute to the completeness of the trade. I will also share more interesting trading strategies for you to refer to! If you have any questions, please leave a message in the comments section, and I will provide you with the most reliable solution with the most serious and responsible attitude to help you solve the problem!

Oil prices have stopped falling, and the bulls are back?Crude oil was suppressed by fundamentals and high pressure. Yesterday, the daily line fell all the way, and finally the daily line closed the negative line. Crude oil currently continues to maintain a wide range of oscillations on the daily line. The 4-hour level trend is also after a continuous decline. The current deviation rate is slightly too large, and the technical patterns on the small-cycle trend are also beginning to be gradually repaired, and there is a high probability that there will be some room for rebound and repair in the short-term trend.On the news side, short-term attention will be paid to Powell's further remarks and EIA data within the day.
Operationally, crude oil is recommended to be short at 78.3, below the target of 76.6.
In order to facilitate you to continue to follow up on my analysis and sharing, you can like and follow me. In addition, you can enter my channel for free in the following ways to follow real-time views and operational strategies.
TVC:USOIL TVC:GOLD FOREXCOM:XAUUSD

Oil: Go long on this range.
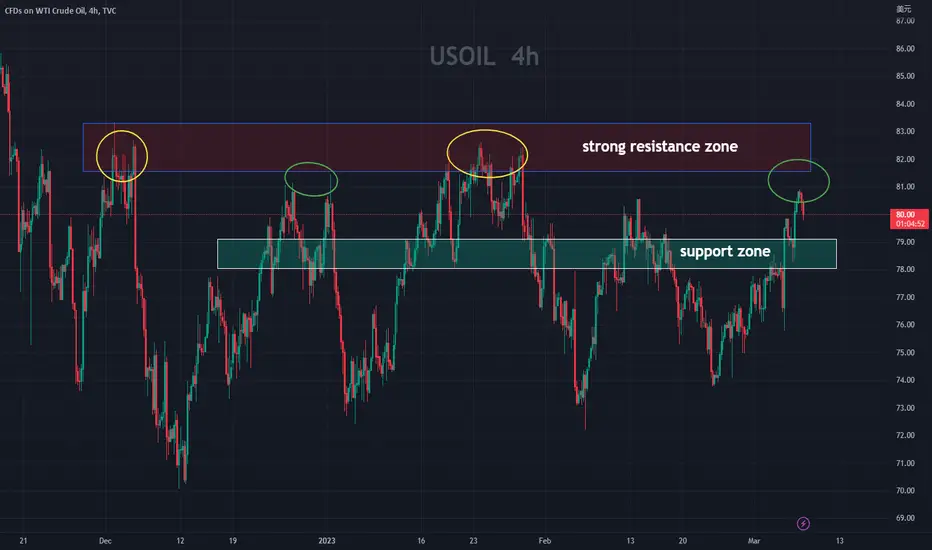
After analyzing the 4-hour chart of crude oil, it is found that yesterday's market first fell and then rose, rebounding after reaching support near 78. In the short term, it has broken through resistance at 79 and 80 and now support has formed around 78 and 79. If there is a substantial breakthrough and stabilization around 81.5, there is a high probability of further rising towards the strong resistance level near 83. However, the market currently needs further consolidation and momentum to complete the potential breakthrough, so we recommend shorting at higher levels and going long at lower levels.
The specific recommendations are as follows:
short around 81-80, long around 79-78, with a stop loss of 70 points and a take profit of 200 points for each.
OIL SELLWelcome . oil market. in a very negative state. With the price reaching strong support 77.50, and breaking the pattern. double bottom, there is a lot of pressure from sellers to downgrade the market. To 75 levels in the first stage. And level 74 good luck. Note: If you like this analysis, please give your opinion on it. in the comments. I will be glad to share ideas Thank you

USOIL - CRUDE OIL BULLISH REVERSAL EXPECTED MOVEoil is about to retrace back to 76-78 zone be realistic and never enter before confirmation in LTF
I am not your investment advisor, enter at your own!

Oil buyPeace be upon you, there is a high probability of oil rising with the formation of the descending channel. Now he is correcting the golden ratio of Fibonacci 61%. We have two very positive candles in the four-hour time frame

Oil Failing at Key AreaOil failing to breakout higher here, suggests that we are likely heading much lower.


Sell OilOil looks bearish on the weekly timeframe and next month looks bearish with possible new lows to bottom area 60.
Oil on the weekly timeframe is in a descending downtrend channel and currently rebounding back from the upper channel of the downtrend at the resistance and supply zone at area 82 and already this week broke previous two weeks lows.

Looking for lower prices here / 3:1 RR / Following Momentum1. Weekly bias playing out 2. 4hr just closed with large top wick exhuastion at pre-planned level 78.7 3. Bear Momentum, Wicks get filled in momentum 4. High Volume time

Sell Based off Rejection of Daily Zone 81 -> 81.40Another Sell Position here. More Sell positions 3:1 RR back down to support.

Chevron | Short the TopChevron looks like it is about to rollover after creating a new high, along with announcing a buy-back program.
Not really much else to say....? bye ✌️

Waiting For Dropping!Expect crude oil to fall. We wait until it hits the area 82
Its great resistance for dropping oil.
