Better Alternatives to MPC in Petroleum Sector Clearly, moving averages show that MPC is headed towards increased gains. However, it is having a difficult time convincingly breaking through downward short-term resistance. Moreover, oscillators at the monthly chart suggest a sell as do oscillators for the daily chart, primarily RSI and momentum. However, if you look at the comparison between other ways to invest in oil such as Brent crude, WTI, or one of the most liquid oil ETFs, MPC clearly is under-performing recently. MPC just barely beat out the S&P 500's energy sector while more of the liquid petroleum assets all greatly outperformed. The dividend yield per share is only 1.8 percent while the stock price is 11 times earnings. Overall, I am not confident in this stock's strength compared to its peers or its technicals. However, this does not mean the price won't go up, it just won't go up as high as other alternatives if the price of oil continues to climb. Because of this, if you are bearish on oil then you should get into the sector, but MPC is probably not the best way to do that.
Oilshort

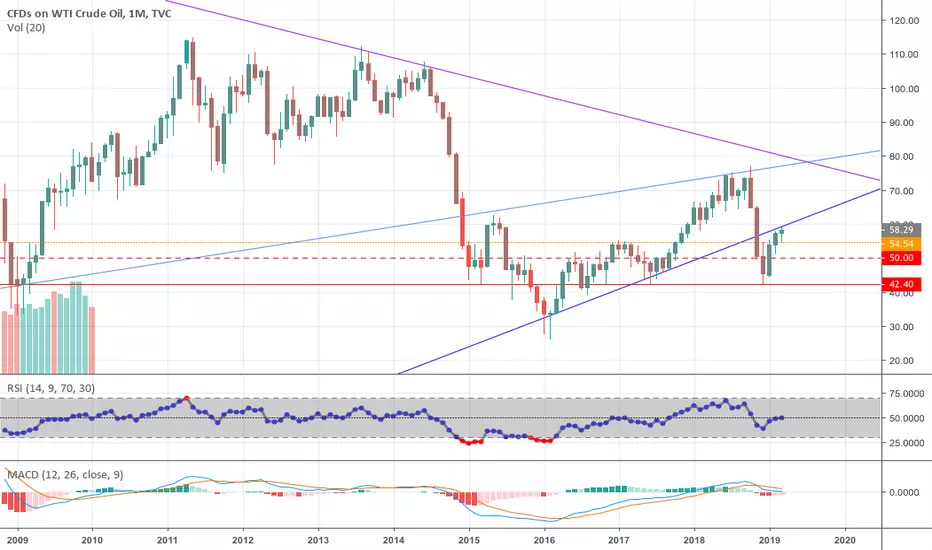
CFDs on WTI Crude Oil USOIL to SHORTOil is shorting from channel, watch for ichimoku crossover first, bottom region of drop outlined.
Warning; trading comes with risks, trade safely and within reason. All charts to be used for guideline purposes.

Oscillators Signal Sell Even Though MAs Suggest Trend HigherIf global growth continues to slow, so too will Brent. If not, then this assessment should be updated. While technical oscillators are important for this forecast, so too is the assumption that global growth is not rebounding, but rather will continue to slow in the EU and China.

TRAILING CRUDE OIL PRICE ACTION- WHEN TO SELL!Thought I should make another crude oil analysis as market did hit the top of the channel line which i am expecting a drop from here, however still waiting for my last signal on the 4 hr view for downside confirmation.
Here is my other crude oil analysis which you should find quite informative;
DISCLAIMER;
Do set stop losses when trading but be generous with how much room you allow for this due to candle wicks and there is also the possibility to hedge yourself, for more confident traders.
All comments and questions welcome, if curious about indicators I use then feel free to inquire.
IF YOU SUPPORT IDEAS, LIKE, FOLLOW, SHARE ~ THANKS! ~


OIL Short Pullback because Stochastic, But Will Try to Edge UpTechnicals show that we are due for a bit of a pullback with oil. However, US growth is still strong and may be able to keep demand up while OPEC tries to cut down on supply. For more financial analysis and charts, check out www.anthonylaurence.wordpress.com


WTICOUSD came in major resistance zone.WTICOUSD came in major resistance zone. It is fibonacci 50% retracement.

Crude 2019 Channel PlayEver since the beginning of 2019, Crude Oil has been trading in a very consistent upward channel. At the moment, we are currently at the upper bounds of the channel, and crude is due for a drop to the bottom of the channel.
Looking at this channel, as well as historical zones of support and resistance a good entry would be in the range of 60.50-60.80 with a price target of 57-58, depending on how fast/slow it moves. Based on previous price action in this channel, I expect the move to take anywhere from 5 to 14 days to play out fully.
Longer term, at the time of writing this, crude fundamentals seem strong, and I expect it to remain this way. For this reason, I don't foresee the channel to break to the downside, but it is a small possibility. More likely that bulls continue the upward trend after this slight pullback.

Yeah, I might go short on OilIf inability to close over the blue trend line, this could be a bearish signal.
OIL TARGET REGIONS MAPPED OUTOil on the 1day view and possible targets outlined, trade within and/or watch out for a future break in trend.
If oil does stay within channel then expect a drop from around 60.90 - 61.30
If market breaks up then next big target region 67.60 - 68.00
Warning; trading comes with risks, trade safely and within reason. All charts to be used for guideline purposes only.


USOIL Short Trade - Intraday & Swing *Double Set Up* US Oil rejecting the key resistance zone at $57.50 which is a 3rd touch at this zone. Nice deceleration on the 1hr timeframe
By simply buying low and selling high, this set up seems pretty simple. We did see a 4hr lower low on Friday so excluding any complications, Oil may continue to drop off in to the low 50's over the week.
Stop loss is comfortably above the previous highs and out of this resistance zone.

US Oil - Intraday Short *Trendline & Liquidity Zone Trade*I still have a bearish bias on US Oil with price failing to break higher than its current level for the past few weeks.
Last Friday we saw heavy bearish momentum create new 4hr lows before sharply reversing in the afternoon/evening of the UK GMT timezones.
Price is now retesting a longer term broken trendline and is back in my liquidity zone marked on by the shaded area. As you can see, price has retested and dropped from this area multiple times.

LONG USOIL approaching support , Prepare For A BounceUSOIL is approaching our first support at 54.96 (horizontal overlap support, 61.8% Fibonacci extension , 61.8% Fibonacci retracement ) where a strong bounce might occur above this level pushing price up to our major resistance at 56.71 (61.8% Fibonacci retracement , horizontal overlap resistance).
Stochastic (89,5,3) is approaching support and we might see a corresponding bounce in price above this level.
Trading CFDs on margin carries high risk. Losses can exceed the initial investment so please ensure you fully understand the risks.

LONG USOIL approaching support , Prepare For A Bouncejust now
USOIL is approaching our first support at 54.96 (horizontal overlap support, 61.8% Fibonacci extension , 61.8% Fibonacci retracement ) where a strong bounce might occur above this level pushing price up to our major resistance at 56.71 (61.8% Fibonacci retracement , horizontal overlap resistance).
Stochastic (89,5,3) is approaching support and we might see a corresponding bounce in price above this level.
Trading CFDs on margin carries high risk. Losses can exceed the initial investment so please ensure you fully understand the risks.

CLJ2019's Anticipated Range This is a 10H chart of CLJ2019, which will be trading until it expires the 20th of March. The Gann Box tool is squared to the high & low range of this contract; from the 7601 peak to the 4300 bottom. There are also the 45º and 15º angle lines coming from various highs and/or lows. As shown in the chart, the oil price is currently approaching the 150 day EMA, it has increased from the 4300 low by a third and the 1/3rd area coincides with 150 day EMA.., and all this is happening after it saw a record breaking plunge of ≈45% from its 7601 peak. Traders who held short risk exposure through that 33%+ rise from the low are likely to take profits at these levels. The reducing of short risk exposure is anticipated to manifest itself in a minor pullback of 200+ ticks at least. Shorting the pops seems to be the reasonable approach from here. The risk factor for short entries is $1.3K (130 ticks) per contract with a potential of 2R return for risk.

SHORT USDOIL approaching resistance, potential drop!Feb 21
USOIL is approaching our first resistance at 59.85(horizontal pullback resistance, 61.8% Fibonacci extension , 50%Fibonacci retracement) where a strong drop might occur below this level pushing price down to our major support at 55.81(23.6% Fibonacci retracement , Horizontal pullback support)
Stochastic (89,5,3) is also approaching resistance where we might see a corresponding drop in price.
Trading CFDs on margin carries high risk. Losses can exceed the initial investment so please ensure you fully understand the risks.

LONG Is WTI Oil gearing for further upside? $57.50 in sightWTI Oil has staged an impressive rebound in recent weeks with prices currently trading near a three-month high above $56.50 as of writing. The inverse head and shoulders pattern on the daily charts signal further upside with the first key point of interest at $57.50. A solid breakout above this level is likely to open a path towards $60.00 in the medium term. Intraday traders will be concerned with how prices behave around the neckline which is coincidentally around $56.30 - $56.50. This bullish setup remains valid as long as prices are able to keep above $54.00.

Oppurtnuity to short WTI Oil Brent crude oil futures are holding slightly below the three-month high of 64.80 after the aggressive bullish run above the ascending sloping channel.
Crude Oil has hit its full support, with a successful up trend broken, we can now expect OIL to go down back to the 53.00 region which will lead and break to the 52.00 region.

forcast crude oil pricejust based on technical analysis.
no one knows the future! be careful! trade on your own risk and responsibility!
targets are illustrated on the chart.

WTICOUSD possibility of ABC correction on 4H timeframeJust my opinion on the situation. I would like to trade short (scalp) trades in this direction for now.

