WTI OIL Can the death fractal of 2008 be repeated?We haven't looked into WTI Oil recently, the last post I made was on March 08, calling what I thought at the time as the medium-term peak:
The price did eventually pull-back to the 1D MA50 (blue trend-line) and rebounded as it constitutes the medium-term Support, following the March 2021 sequence.
On a much larger scale though, and since the war isn't over yet and inflation runs wild, I thought it would be beneficial looking at the last time similar conditions were leading the Oil market higher. Sadly, that was during the 2008 peak of the U.S. Housing Bubble.
As you see, today's 2021-2022 fractal can be related to a great extent to the 2007-2008 sequence. If the market dynamics have been indeed aligned as in 2008, then Oil has entered the final phase towards the blow-off top, as it rebounded on its 1D MA50. Now of course, reaching the 2.382 Fibonacci extension around $178.00 for a blow-off top, seems even under the latest aggressive conditions, as unrealistic. But a value around $150.00 as a Higher High to the March 08 shock, could very well be printed.
Do you think the market will follow in 2008's footsteps and if so what is your projected top?
--------------------------------------------------------------------------------------------------------
** Please support this idea with your likes and comments, it is the best way to keep it relevant and support me. **
--------------------------------------------------------------------------------------------------------
Oilsignals

EIA: Oil Prices Will Remain Above $100 For MonthsOil prices will remain higher than $100 per barrel in the coming months, reflecting the geopolitical risk from Russia’s war in Ukraine and the tight energy markets with the current and potential future sanctions against Russia, the Energy Information Administration (EIA) said on Wednesday.
Brent Crude prices are expected to average $105.22 per barrel this year, the EIA said in its latest Short-Term Energy Outlook (STEO) last week, significantly raising its February forecast of $82.87.
In its March STEO last week, the EIA said it expects Brent Crude prices to average $117 a barrel in March, $116 for the second quarter of this year, and $102 per barrel in the second half of 2022.
WTI Crude, the U.S. benchmark, is set to average $113 a barrel this month and $112 per barrel for the second quarter of 2022.
Early on Wednesday, before the EIA inventory report, WTI was up 2% at over $98, and Brent was rising by 1.6% to $101.46.
EIA’s oil price forecast, however, “is subject to heightened levels of uncertainty due to various factors, including Russia’s further invasion of Ukraine, government-issued limitations on energy imports from Russia, Russian petroleum production, and global crude oil demand,” the administration said.
The current forecast Brent price also increased the forecast for the U.S. retail gasoline price, which the EIA expects to average $4.00/gal this month and continue rising to a forecast high of $4.12/gal in May before gradually falling through the rest of the year. The U.S. regular retail gasoline price is now seen to average $3.79/gal this year and $3.33/gal in 2023. If realized, the average 2022 retail gasoline price would be the highest average price since 2014, after adjusting for inflation, the EIA said.
As of March 16, the national average gasoline price was $4.305/gal, according to AAA data.
“This war is roiling an already tight global oil market and making it hard to determine if we are near a peak for pump prices, or if they keep grinding higher. It all depends on the direction of oil prices,” Andrew Gross, AAA spokesperson, said on Monda
y.
Saudi Arabia Considers Ditching The Dollar For Chinese Oil Sales
The status of the U.S. dollar as the reserve currency of the world is largely based on its importance in energy and commodity markets.
According to an exclusive report from the Wall Street Journal, Saudi Arabia and China are now discussing pricing some Saudi oil exports in Yuan.
China is aggressively pushing to dethrone the dollar as the global reserve currency, and this latest development suggests the petrodollar is now being threatened.
One of the core staples of the past 40 years, and an anchor propping up the dollar's reserve status, was a global financial system based on the petrodollar. This was a world in which oil producers would sell their product to the US (and the rest of the world) for dollars, which they would then recycle the proceeds of in dollar-denominated assets and, while investing in dollar-denominated markets, explicitly prop up the USD as the world reserve currency. All of this would support the standing of the US as the world's undisputed financial superpower.
Those days are coming to an end.
One day after we reported that the "UK is asking Saudis for more oil even as MBS invites Xi Jinping to Riyadh to strengthen ties", the WSJ is out with a blockbuster report, noting that "Saudi Arabia is in active talks with Beijing to price some of its oil sales to China in yuan," a move that could cripple not only the petrodollar’s dominance of the global petroleum market - something which Zoltan Pozsar predicted in his last note - and mark another shift by the world’s top crude exporter toward Asia, but also a move aimed squarely at the heart of the US financial system which has taken advantage of the dollar's reserve status by printing as many dollars as needed to fund government spending for the past decade.
According to the report, the talks with China over yuan-priced oil contracts have been off and on for six years but have accelerated this year as the Saudis have grown increasingly unhappy with decades-old U.S. security commitments to defend the kingdom.
The Saudis are angry over the U.S.’s lack of support for their intervention in the Yemen civil war, and over the Biden administration’s attempt to strike a deal with Iran over its nuclear program. Saudi officials have said they were shocked by the precipitous U.S. withdrawal from Afghanistan last year.
China buys more than 25% of the oil that Saudi Arabia exports, and if priced in yuan, those sales would boost the standing of China’s currency, and set the Chinese currency on a path to becoming a global petroyuan reserve currency.
As even the WSJ admits, a shift to a (petro)yuan system, "would be a profound shift for Saudi Arabia to price even some of its roughly 6.2 million barrels of day of crude exports in anything other than dollars" as the majority of global oil sales—around 80%—are done in dollars, and the Saudis have traded oil exclusively in dollars since 1974, in a deal with the Nixon administration that included security guarantees for the kingdom. It appears that the Saudis no longer care much about US "security guarantees" and instead are switching their allegiance to China.
As a reminder, back in March 2018, China introduced yuan-priced oil contracts as part of its efforts to make its currency tradable across the world, but they haven’t made a dent in the dollar’s dominance of the oil market, largely because the USD remained the currency of choice for oil exporters. But, as Pozsar also noted recently, for China the use of dollars has become a hazard highlighted by U.S. sanctions on Iran over its nuclear program and on Russia in response to its invasion of Ukraine.

BCO LONG OIL WTI LONGOil Price forecast for March 2022.
In the beginning price at 107.02 Dollars. High price 139.13, low 90.50. The average for the month 107.13. The Oil Price forecast at the end of the month 91.88, change for March -14.1%.
Brent oil price forecast for April 2022.
In the beginning price at 91.88 Dollars. High price 91.88, low 84.91. The average for the month 88.72. The Oil Price forecast at the end of the month 86.20, change for April -6.2%.
Oil Price forecast for May 2022.
In the beginning price at 86.20 Dollars. High price 92.91, low 86.20. The average for the month 89.21. The Oil Price forecast at the end of the month 91.54, change for May 6.2%.
Brent oil price forecast for June 2022.
In the beginning price at 91.54 Dollars. High price 98.68, low 91.54. The average for the month 94.75. The Oil Price forecast at the end of the month 97.22, change for June 6.2%.
Oil Price forecast for July 2022.
In the beginning price at 97.22 Dollars. High price 104.80, low 97.22. The average for the month 100.62. The Oil Price forecast at the end of the month 103.25, change for July 6.2%.
Why Oil Crashed Back Below $100
After a torrid three-week rally, energy markets have entered correction mode, with prices moving sharply lower. Over the past week, Brent has slipped 30% from the 7 March intra-day high while European gas prices have declined 65%.
Brent for May delivery settled at USD 106.90 per barrel (bbl) on 14 March, a w/w fall of USD 16.31/bbl, and moved below USD 100/bbl in early trading on 15 March. WTI for April delivery fell USD 16.31/bbl w/w to USD 106.90/bbl at settlement on 14 March, while the value of the OPEC basket fell by USD 15.84/bbl to USD 110.67/bl and by EUR 15.40/bbl to EUR 101.16/bbl.
You can blame speculative overshoot for the unfolding scenario though the overall outlook remains bullish.
According to Standard Chartered commodity analysts, the correction tells us more about market positioning and the effect of extreme volatility than it does about changes in fundamentals over the past week.
The increase in volatility across financial and commodity markets has led to a sharp rise in the level of risk held by traders, and an associated incentive to close out some positions to lower the risk. Oil traders have mostly been positioned with a highly bullish bias in terms of both outright positions and spreads in recent weeks, meaning optimization in a higher-risk environment has mostly involved closing out prompt longs. With speculative shorts being very thin on the ground currently, there have been few natural buyers, and the downside has quickly opened up. While the price ranges involved have been rather extreme, recent price dynamics bear all the hallmarks of a textbook speculative overshoot followed by the correction necessary to reset extreme positioning.
The irony of the situation is that the dominance among oil traders of the belief that prices could only move higher has led to a position from which market dynamics dictated that in the short term, prices could only go lower.
Replacing Russian Oil
Despite the positioning-led price fall, StanChart says that the key fundamentals are largely unchanged and are also subject to an unusually high level of uncertainty.
According to commodity analysts at Standard Chartered, Russian oil flows to Europe can be replaced in the short term, with the short-term price implications of that displacement potentially capable of being minimized by the extent to which OPEC members increase output beyond their current OPEC+ targets, and also by the possibility of a successful conclusion to talks in Vienna that results in higher volumes of Iranian exports.
The analysts have projected that consumer reluctance to buy from Russia coupled with shortages of capital, equipment, and technology will continue to depress Russian output over at least the next three years. Russian output is expected to fall by 1.612 million barrels per day (mb/d) y/y in 2022, and by a further 0.217mb/d in 2023, with the y/y decline peaking at 2.306mb/d in Q2-2022. To avoid significant upside price pressure, StanChart reckons that the market would require around 2mb/d extra supply for the remainder of 2022, and an additional 2mb/d in Q2 to ease the dislocations caused by the displacement of Russian oil. The temporary 2mb/d Q2 boost could come from strategic reserves, but the 2mb/d additional flow for the remainder of 2022 would likely need to come from OPEC sources (including potentially Iran).
Market tightness is, however, being helped by the fact that withdrawal from Russian markets has been less dramatic than anticipated.
So far, there are indications that some of the larger EU countries are less keen than countries in the east of the EU to pursue the fastest possible reduction in Russian oil flows. Outside of the EU, the UK’s ban on the import of Russian oil has proved less dramatic than the headlines that accompanied the initial announcement, as it does not take effect until the end of 2022. In the private sector, while several companies have given assurances they will buy no more Russian oil on the spot market, there have been very few indications given about if, when, and how they will cut the volume of Russian oil purchased through their term contracts. Meanwhile, statements from some governments and some companies do appear to have become less hawkish over the past week, with an apparent lengthening of the timespan envisaged for the process of reducing dependence.
StanChart says that Russian oil trade into Europe appears to be moving further into the shadows of term contracts and a greater reliance on third-party trading intermediaries. That does not make trading with Russia any less distasteful for European public opinion, but it does make the trade less visible and thus likely keeps oil flows from Russia higher than they would have been with more direct government targeting of those flows.

USOIL to $125 this summer, UBS saysOil hits two-week low but UBS is still bullish on Crude.
UBS laid out three reasons for its $125 USOIL this summer:
1. Russian oil exports hurt by sanctions, which will further tighten global supplies.
2. Spare capacity brought in by OPEC is less than 2% of global demand.
3. Global oil demand still heading for record highs with Europeans and Americans returning to normal travel patterns once COVID-19 restrictions are lifted.
Looking forward to read your opinion about it.

$GUSH Target PT 300 and higherThe fund, under normal circumstances, invests at least 80% of its net assets in financial instruments, such as swap agreements, securities of the index, and ETFs that track the index and other financial instruments that provide daily leveraged exposure to the index or to ETFs that track the index. The index is designed to measure the performance of a sub-industry or group of sub-industries determined based on the Global Industry Classification Standards. The fund is non-diversified.

$ENSV Next Target PT 9.90 and higher...Long term PTs 20-60 Enservco Corporation, through its subsidiaries, provides well enhancement and fluid management services to the onshore oil and natural gas industry in the United States. It offers frac water heating, hot oiling, pressure testing, acidizing, bacteria and scale treatment, freshwater and saltwater hauling, fluid disposal, frac tank rental, well site construction, and other general oil field services. The company owns and operates a fleet of approximately 338 specialized trucks, trailers, frac tanks, and other well-site related equipment. It operates in the eastern United States region comprising the southern region of the Marcellus Shale formation and the Utica Shale formation in eastern Ohio; Rocky Mountain region consisting of western Colorado and southern Wyoming, central Wyoming, western North Dakota, and eastern Montana; and the Central United States region, including Eagle Ford Shale and Permian Basin in Texas. Enservco Corporation was incorporated in 1980 and is headquartered in Longmont, Colorado.

$TIDE entry PT .00001 Target PT .05 and higher $TIDE entry PT .00001 Target PT .05 and higher
5,000X Returns

$VTNR Next Target PTs 14-20 and higherVertex Energy, Inc., an environmental services company, provides a range of services designed to aggregate, process, and recycle industrial and commercial waste systems in the Gulf Coast and Central Midwest regions of the United States. The company operates in three segments: Black Oil, Refining and Marketing, and Recovery. The Black Oil segment collects and purchases used motor oil directly from third-party generators; aggregates used motor oil from a network of local and regional collectors; and sells used motor oil to customers for use as a feedstock or replacement fuel for industrial burners. It also produces and sells a vacuum gas oil product to refineries and marine fuels market; and base oil product to lubricant packagers and distributors. The Refining and Marketing segment gathers hydrocarbon streams in the form of petroleum distillates, transmix, and other chemical products that are purchased from pipeline operators, refineries, chemical processing facilities, and third-party providers; and sells end products, such as gasoline blendstock, pygas, and fuel oil cutter stock to oil companies or to petroleum trading and blending companies. The Recovery segment sells ferrous and non-ferrous recyclable metal products, and markets Group III base oils and other petroleum-based products, as well as provides transportation and marine salvage services. Vertex Energy, Inc. was founded in 2001 and is headquartered in Houston, Texas.

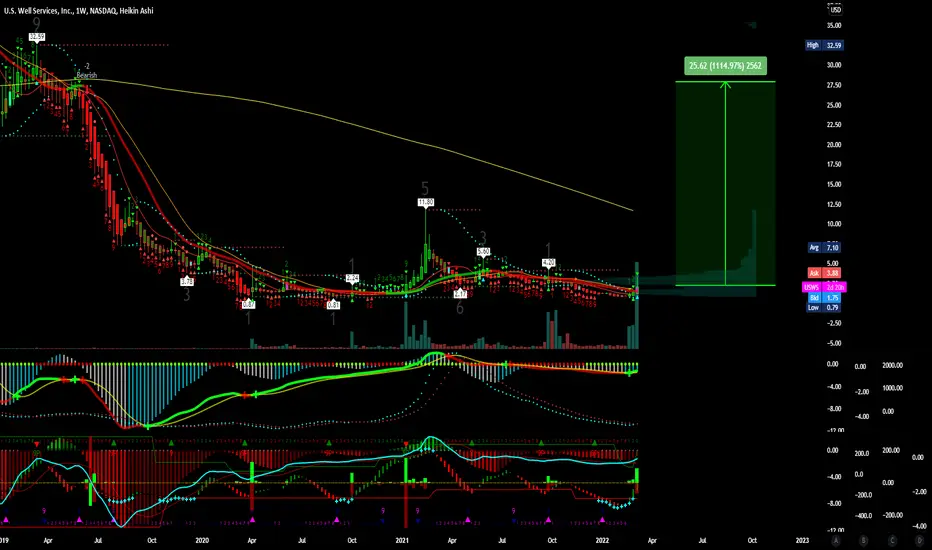
$USWS Next Target PTs 10-11-25 and higherU.S. Well Services, Inc. operates as an oilfield service company in the United States. It provides hydraulic fracturing services to the oil and natural gas exploration, and production companies. The company was founded in 2012 and is headquartered in Houston, Texas.
$USEG Next Target PT 18 and higherU.S. Energy Corp., an independent energy company, focuses on the acquisition, exploration, and development of oil and natural gas properties in the United States. It holds interests in various oil and gas properties in the Williston Basin in North Dakota, the Permian Basin in New Mexico, the Powder River Basin in Wyoming, and in the Gulf Coast of Texas. As of December 31, 2020, the company had an estimated proved reserves of 1,255,236 barrel of oil equivalent; and 134 gross producing wells. U.S. Energy Corp. was founded in 1966 and is based in Houston, Texas.

WTI OIL in need of a pull-back to the 1D MA50.One of the biggest (if not the biggest) winner of the current war between Russian and Ukraine, is Oil. Energy crises are almost a certainty in times of geopolitical conflicts involving major producers. Even though it is tough predicting technically WTI prices while war is ongoing, charting past fractals could give an idea to where, at least the next consolidation phase could be.
The price action from November 2021 to today has been so far fairly similar to the sequence from November 2020 to March 2021. Both have gone on a slightly above +100% rise since their November lows. Right now the current 1D RSI sequence is exactly on the February 17 2021 RSI top, which prompted the price to enter a Channel Up that eventually led to a Top two weeks later.
Based on this and of course assuming that the war is entering its final stage and will not escalate into a multi-month conflict involving more countries, WTI Oil may be entering an exhaustion channel that will eventually lead to a pull-back on the 1D MA50 (blue trend-line), which is what happened in March 2021. After that, and depending on how the geopolitical stage will look like, we will re-evaluate our thesis.
--------------------------------------------------------------------------------------------------------
** Please support this idea with your likes and comments, it is the best way to keep it relevant and support me. **
--------------------------------------------------------------------------------------------------------

$HUSA Next Target PT 20 and higherHouston American Energy Corp., an independent energy company, acquires, explores for, develops, and produces natural gas, crude oil, and condensate. Its oil and gas properties are located primarily in the Texas Permian Basin, the onshore Texas and Louisiana Gulf Coast region, and in the South American country of Colombia. As of December 31, 2020, the company owned interests in four gross wells. Houston American Energy Corp. was incorporated in 2001 and is based in Houston, Texas.

$IO Next Target PTs 5-9-16-30 and higher ION Geophysical Corporation provides data-driven decision-making to offshore energy, and ports, and defense industries worldwide. The company operates through two segments, E&P Technology & Services and Operations Optimization. The E&P Technology & Services segment creates digital data assets and delivers services to help E&P companies improve decision-making and reduce risk. This segment includes two synergistic groups, imaging and reservoir services, and ventures. The company's Imaging and Reservoir Services group provides data processing, imaging, and reservoir services that improve image quality and subsurface insights, helping E&P companies reduce exploration and production risk, evaluate and develop reservoirs, and increase production. Its Imaging and Reservoir Services group develops and applies proprietary processing algorithms through its imaging engine to data owned or licensed by its customers to translate raw data into subsurface images. The Operations Optimization segment develops mission-critical subscription offerings and provides engineering services that enable operational control and optimization offshore. This segment includes the company's Optimization Software & Services and Devices offerings. The company's Optimization Software & Services group provides survey design, command, and control software systems and related services for marine towed streamer and seabed operations. Its Devices offerings group develops intelligent equipment controlled by its software to optimize operations. The company sells its services and products through a direct sales force consisting of employees and international third-party sales representatives. ION Geophysical Corporation was formerly known as Input/Output, Inc. and changed its name to ION Geophysical Corporation in 2007. The company was founded in 1968 and is headquartered in Houston, Texas.

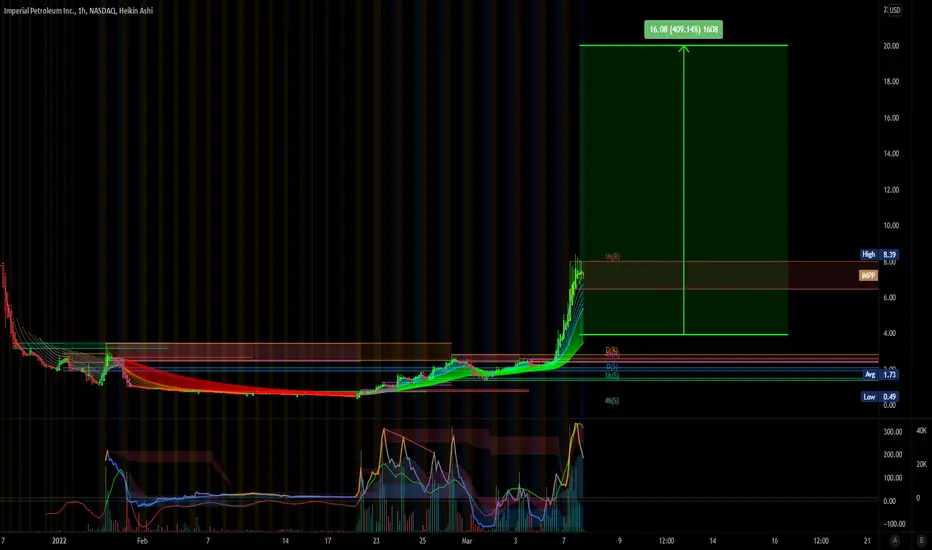
$IMPP Next Target PT 20 and higherImperial Petroleum Inc., together with its subsidiaries, provides international seaborne transportation services to oil producers, refineries, and commodities traders. As of September 30, 2021, it owns and operates cargo fleet with capacity is 255,804 dwt. The company was incorporated in 2021 and is based in Athens, Greece. Imperial Petroleum Inc.(NasdaqCM:IMPP.V) operates independently of StealthGas Inc. as of December 3, 2021.
$ENSV PT 22 and higherEnservco Corporation, through its subsidiaries, provides well enhancement and fluid management services to the onshore oil and natural gas industry in the United States. It offers frac water heating, hot oiling, pressure testing, acidizing, bacteria and scale treatment, freshwater and saltwater hauling, fluid disposal, frac tank rental, well site construction, and other general oil field services. The company owns and operates a fleet of approximately 338 specialized trucks, trailers, frac tanks, and other well-site related equipment. It operates in the eastern United States region comprising the southern region of the Marcellus Shale formation and the Utica Shale formation in eastern Ohio; Rocky Mountain region consisting of western Colorado and southern Wyoming, central Wyoming, western North Dakota, and eastern Montana; and the Central United States region, including Eagle Ford Shale and Permian Basin in Texas. Enservco Corporation was incorporated in 1980 and is headquartered in Longmont, Colorado.

USOIL BuyWe have a bullish break again. OB is marked in a grey box. Look for a sell from there.
NOTE: I always wait for a candle close below the grey box for setup to invalidate. So either set sl with some margin or manually monitor the price on 15m chart.

Short Opportunity on WTI OIL According to UPtrendline channel
Pullback by Resistance level
Divergence on CCI
Corrective Wave
Fibo retracement
Previous Weekly Analysis

WTI OIL at $100! Best short for the next 12 - 18 months!WTI Oil is among the major gainers of the current geopolitical conflict in Ukraine, hitting the $100 mark for the first time in roughly 8 years. Fundamentally this happens most of the times during periods of unrest or even worse war, such as the one that broke out yesterday. In times like these, it is very useful and most efficient to zoom out of short-term charts and look into the longer term picture. Long-term investors should be particularly interested in what this analysis reveals about WTI's outlook for the next 12 months.
This is on a 1W time-frame and displays Oil's in Eras of 10 years (roughly). The current spans from the June 2014 Top until today and is very similar so far with the one from October 1990 to October 2000. Given the fundamentals of the two periods, with roughly similar geopolitical tensions in a 10 year span, it is no surprise that the Cycles' legs are identical. What's left of the current Cycle is leg (6), which represents a major correction back to the High Volatility Zone, which currently is within roughly the 0.382 and 0.618 Fibonacci retracement levels (as opposed to the 1990s which was within 0.5 - 0.618). This suggests that based on Oil's cyclical behavior, its systemic response should be a correction within roughly $53 - $43. It may seem, and surely is, a long way from the current $100 landmark but so was the $100 target we at Tradingshot suggested back in June 07 of last year when the price was still at $69.20, but clearly had broken above a 13 year Lower Highs trend-line:
In our opinion, as this energy and geopolitical crisis will come to an end, WTI will turn into one of the best sell opportunities for the next 12-18 months.
--------------------------------------------------------------------------------------------------------
** Please support this idea with your likes and comments, it is the best way to keep it relevant and support me. **
--------------------------------------------------------------------------------------------------------

WTI Oil Turning Parabolic 82.50Since WTI Oil broke the former two Resistance levels (74.15 and 77.00), the price turned parabolic outside the Channel Up that dominated most of the price action in September. There seems to be a Buy/ Support Zone consisting of the 4H MA50 (blue trend-line) and the 4H MA100 (green trend-line) and a Resistance Zone on the RSI Higher Highs trend-line.
Technically those two pressure levels should provide the next dip buy and target. I've applied the Fibonacci Channel to assist in finding the target and as you see every Fib extension prices a Higher High (1.0, 1.5, 2.0). Naturally the 2.5 Fib extension is next, I project a Higher High around $82.50.
** Please support this idea with your likes and comments, it is the best way to keep it relevant and support me. **

RUSSIA VS UKRAINE Hello every one i said about oil 2 weeks ago now i updated this chart and added new idea about oil
ok. as you see Oil can see higher prices and after reaching the specified points can fill its inefficiencies and come down on the other hand because in this chart in the weekly time frame we have meditation and all areas of demand have been consumed can fall well after the Ukraine-Russia war
But as I said, this chart wants to experience prices from $ 105 to $ 120 and then come down.
I wish you a good day.

USOIL Update after catch 500pips from last analysisthe price can decline from 0.5 fibo direct we wait broke the simple support or access again to create lower high in 61 fibo to sell

WTI OIL Head and Shoulders top on the Megaphone?I haven't updated my WTI Oil thesis since the start of the month when I first started calling for a potential market top and a stop to buying activity.
Well this top may have been formed now as WTI has formed a Head and Shoulders pattern, right at the top (with the Head actually slightly above it) of the Megaphone pattern. Also that took place exactly on the Ichimoku Squeeze which was a marker for the prior Higher High of the Megaphone on October 25 2021. On top of all that, the 1D RSI got rejected, in fact made a Double Top rejection exactly on its 77.00 Resistance, which made the rejections of the two previous Higher Highs of the Megaphone on July 05 and October 25 2021.
I am expecting the price to start pulling back this week or by next the latest (depending of course on the Ukraine conflict) and correct towards the 0.5 Fibonacci retracement level and 1D MA200 (orange trend-line) on the medium-term.
--------------------------------------------------------------------------------------------------------
** Please support this idea with your likes and comments, it is the best way to keep it relevant and support me. **
--------------------------------------------------------------------------------------------------------

Oil_USDWTI_D1_ Enter Bearish, TP and SLOil_USDWTI_D1_ Enter Bearish Zone, I sett my sl and tp area , Let see what market formation Bearish or Bullish
