WTI - OIL ANALYSES
Oil prices are as shown below :
Peaked at 1 July 2008 -147 $ plummeted to 35 $
Peaked at 1 July 2014 -107 $ plummeted to 28 $
Peaked at 1 July 2018 - 77 $ plummeted to 21 $ (You can see this in my profile exactly predicted in September 2019 as of 21 $)
Will Peak at 1 July 2020 -60 $ will plummeted to 9.71 $
So until July 1 2020 May be long after badly short.
Oilsignals

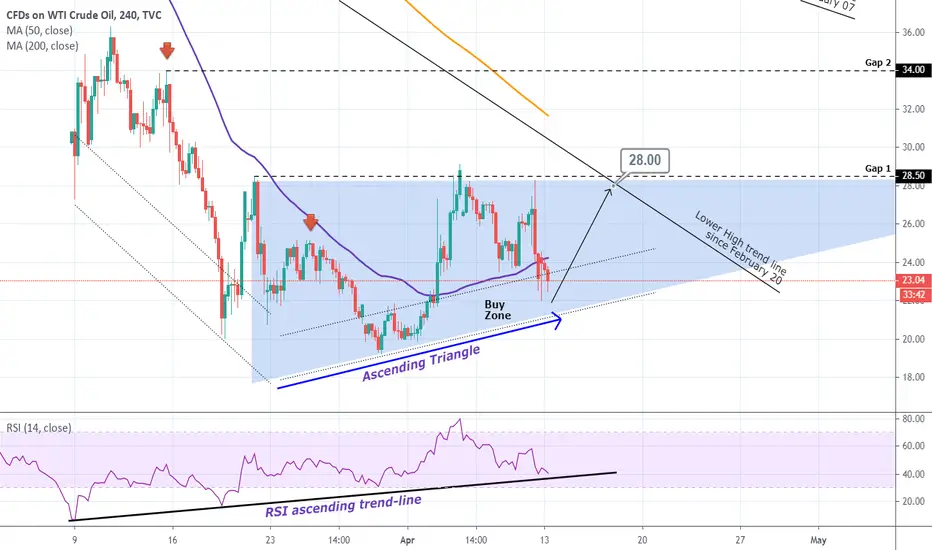
WTI Oil: Buy opportunity short term. Scenarios moving forward.Oil is trading sideways on the 1H chart (RSI = 47.613, MACD = -0.080, ADX = 28.589) as it is consolidating on the 19.20 Support. The MACD on the 4H chart just made a bullish cross and if the sequence of March 31 is repeated then we can have a rebound towards the 29.20 Resistance. That would however break the 4H MA200 (orange trend line) which hasn't been testes since January 10th and if broken would be a sign of stabilization and recovery for the market. So until then it is best to target the Lower High trend line of the Descending Triangle.
** If you like our free content follow our profile (www.tradingview.com) to get more daily ideas. **
Comments and likes are greatly appreciated.

USOIL Buy SignalPattern: Ascending Triangle on 4H.
Signal: Bullish as the price has entered the Buy Zone and the RSI has been ascending since March 9.
Target: 28.00 (contact with the Lower High trend-line since February 20.
OIL up movement but no plan yetThe oil market is overloaded with a geopolitical conjecture and I expect an up movement under the recent jawboning from Trump.
I've mentioned two levels where I'd expect it to come next periods, but for now, don't have any prepared scenarios, it looks like it can be an impulse up with some pretty short corrections.
What is important to mention here, we shouldn't forget that this virus based "switch-off and further expected switch-on" of the world economy can, and highly likely will cause market shares reshaping and higher oil demand.
So in the long perspective, I would expect oil prices much higher than they used to be in Q1 2020, but before this, we could observe many speculations from oil-producing countries in an aim to protect the status quo.

USOIL Buy SignalPattern: Parabolic rise.
Signal: Bullish either if 28.50 breaks (Gap 1) of if the 4H MA50 is tested as a Support (blue trend line).
Target: $34.00 (Gap 2).
Most recent Oil signal:

US-Oil : Crude Oil Strong Buy Huge Reward Trade Descending Channel pattern is a trend reversal pattern formation. looking for reversal upside.
ThankYou

USOIL Buy SignalPattern: Fibonacci retracement
Signal: Bullish as the price made a bullish cross on the MACD and the whole pattern is similar to the previous sequence that topped on the 0.618 Fibonacci.
Target: 22.80 (just below the 0.618 Fibonacci retracement).

Is it time to buy some OIL? EngineeringRobo warned you!Oil prices have plunged this year, as supply has jumped and demand has plummeted. They are down more than 50% just this month. On Monday, they took a new leg down, with West Texas Intermediate crude futures temporarily falling below $20. The last time Texas oil settled below $20 was in 2002.
Smart EngineeringRobo traders know when to enter when to exit OIL.
EngineeringRobo offers strategic trading entry and exit points, so you can preserve capital before markets tumble, and take full advantage as they start to rebound. At a glance, market timing indicators tell investors whether market conditions are right or whether it’s safer on the sideline.
When it comes to investing, time is of the essence. Keep tabs on market conditions, explore investing opportunities and trade; all in EngineeringRobo!
Sadly with the amount of wrong information out there, learning how to trade profitably alone has become almost impossible. Even most advanced traders are lacking some key tools that could unlock their potential. Thus, EngineeringRobo suits beginners as well as advanced traders because it gives basic to complex tools in a very progressive and easy to follow way.
---- Does EngineeringRobo compatible only with crypto?
No, our products are not only compatible with Crypto, but with Stocks, Commodities and Forex as well. Get benefited by using our products for all of the above markets.
Start your one week free trial today!

USOIL Action plan after the InventoriesPattern: Channel Down on the 4H chart.
Signal: (A) Bearish as long as the 4H MA50 is intact and (B) Bullish if it gets crossed.
Target: (A) 15.00 (-40% fall as in the previous Lower Low sequence) and (B) 34.00 (the previous Lower High of the pattern).
Previous signal:

Oil and corona the price of oil is going down to retest lower line of the chanal or maybe will go more to test 22 level before to start gos up . lets see if that area will be strong enough to buch the price to 27 or 30 or corona has something else ?
if you agreed follow me and share your comments .

LONG CRUDE OIL WTIThe drop in oil prices is caused by excess supply and shrinking demand (due to covid19 causing demand for oil to drop since industry like transportation don’t need that much anymore).
Russia refused to cut production, in a bid to drown America's high-cost shale producers in a sea of cheap crude. Saudi Arabia responded by slashing prices and ramping up production and this is exactly the opposite of what was needed to balance the market.
Major oil companies including Chevron (CVX) and ExxonMobil (XOM) have been said to have announced cost cutting measures. Another company, Occidental Petroleum (OXY) slashed its dividend by 86%.

USOIL Buy SignalPattern: 1H Channel Up.
Signal: Bullish as both the Lower High resistance since March 13 and 1H MA50 broke.
Target: 27.00 (just below the 27.30 March 9 Low and symmetrical Resistance now).


OILU LONG SET UP OILU ULTRAPRO 3X CRUDE OIL ETF
ENTRY 1 1.20
ENTRY 2 1.00
SL 0.13
TP.1 $8.00
TP.2 18.20
TP.3 28.20
TP.4 36.00
TP.5 48.00
act.webull.com
Your free stock is waiting for you! Join Robinhood and we'll both get a stock like Apple, Ford, or Facebook for free. Sign up with my link. join.robinhood.com

USOIL Buy SignalPattern: Channel Down on 1H.
Signal: Bullish as the pattern made a Lower Low.
Target: 31.30 the current level of the 1H MA50 as per the last Lower High.
Previous signal:

USOIL Buy SignalPattern: Channel Up on 1H.
Signal: Bullish as the MACD made a bullish reversal and the price a Higher Low on the pattern.
Target: 33.80 (+9.20% based on a similar fractal).


CRUDE OIL Price Will Drop To $20 or Worst $18.15| 3rd March 2020Price oil not only has been a target to a massive selling from investor but the oversupply from the country exporters while China that has to be no.1 oil purchaser has not buying oil price as per regular basis. As per chat on monthly timeframe, there was a significant supply has been going on in the market recently. The chart clearly shown that the supply of oil still continue to supply even the crisis of pandemic has gotten worst.
To prevent this to be oversupply, the oil producer has being in the decision to cut the oil supply so that to maintain the fair price of oil around $50 per barrel.
While this cut is implementing, it will takes time to be control. The price right now closed around $45 as 1st March 2020.
The price has done the correction pattern which is why it tends to slope against the prior uptrend. It is a short term pattern and this will tally to the cutting implementation from the oil producers countries.
I am predicting the price of oil will bearish hitting around $20.00 or worst $18.15 per barrel before it will continue bullish to meet the fair price.
Please like, subscribe and share this post. Dont forget to thumbs up if you like.
Please follow me to get the latest news regarding the trending topic of prophecy.
Regards,
Zezu Zaza

USOIL Why it MUST hold this Triangle. Danger for $42.5 otherwiseThe pattern is a Channel Down since the April 2019 66.60 top. However with the price rejected on the 54.60 Resistance and pulling back to the 49 region the very bearish fractal of 21 Nov - 14 Dec 2018 comes to my mind. See how both then and now the price traded within the 54.60 Resistance and 49.30 Support.
As a result buyers must defend the Lower Low zone of the long term Channel Down (which I have displayed it with the green Triangle) if they want to avoid an aggressive break down to the 42.30 1W Support (24 December bottom).
On the other hand, every time the Channel Down made a Lower Low, the price always made a pull back after the first rebound. I have illustrated that with the circles. It never jumped aggressively to a new High. So as long as the Lower Low zone holds, it is a long term technical buy.
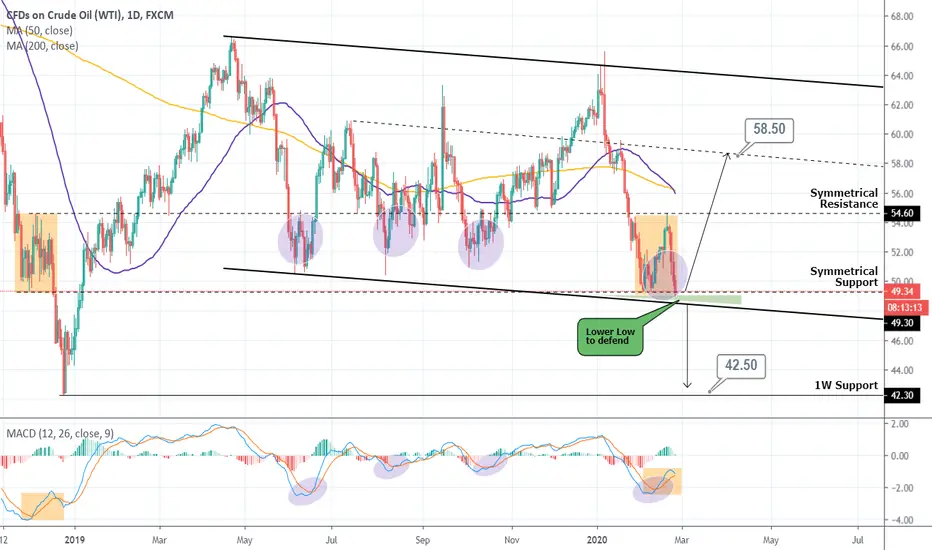
USOIL Buy SignalPattern: Channel Up on 4H.
Signal: Bullish as the pattern made a Higher Low and the price was supported on the 4H MA50.
Target: 54.35 (Symmetrical Resistance).
Recent long term outlook:

Oil to trade over $100 Beginning of 2019 we saw a change in character with a sharp bull move to 66.20 level end in May 2019.
Oil as been in a accumulation until February 2020 where we saw a run on equal lows. Sweeping out stops positioned below the 50.20 level then trading higher.
This area dips down into the buy zone of the 61.8 fib retracement level. Institutions are defending the 50.5 level with a higher move above $100 handle, with a projected target of 113.20
