SELL USOILIt’s been a while since I last posted about American market.
You can sell USOIL, the target is the daily Liquidity high and the stop is at the PVH of the reversal.
Follow for more!
Oiltrading

Crude oil------Buy around 74.00, target 75.00-76.50Crude oil market analysis:
Crude oil has been strong recently, and it is also because of the support of fundamentals and inventory data that crude oil has begun to strengthen. Today's idea is still bullish on crude oil. Continue to buy after the retracement. The daily moving average has begun to diverge. The small support for buying has reached around 72.00. The suppression position is around 74.00 and 77.60. I estimate that it will form a small shock and then break through and rise again. If it does not break 70.00, it is still strong. Buy crude oil around 74.00 today.
Fundamental analysis:
The interest rate results announced by the Federal Reserve last night remained unchanged at 4.25%-4.50%, and the fourth consecutive meeting remained unchanged, which was in line with market expectations. The uncertainty of the United States about the future has led to no major changes in monetary policy in the near future.
Operational suggestions
Crude oil------Buy around 74.00, target 75.00-76.50

WTI CRUDE OIL: There is no better time to sell that this.WTI Crude Oil has turned overbought on its 1D technical outlook (RSI = 71.048, MACD = 2.830, ADX = 41.529) and this is technically the most efficient level to sell on the long term. Not only is that the top of the dotted Channel Down but last week the price got very close to the 1W MA200, which has produced the last 3 major rejections since the week of August 12th 2024. Technically the market still has some room to move upwards and test it but since it rose purely on the latest Middle East conflict, it is more likely than not to see an equally quick price deflation and rebalancing. The earlier bearish waves (September 2023 onwards), initially targeted the 0.786 Fibonacci level and then bounced. That translates to TP = 61.00 (at least) towards the end of the year.
See how our prior idea has worked out:
## If you like our free content follow our profile to get more daily ideas. ##
## Comments and likes are greatly appreciated. ##

Crude oil---Buy near 72.00, target 72.90-74.90Oil market analysis:
Recently, the daily crude oil line has started to pull up, and buying has begun to rise. The retracement is our opportunity to buy again. The moving average support of the daily crude oil line has begun to move up, and the pattern has reached around 69.60. Today's idea is to buy at 72.00. The pattern is difficult to see, just buy repeatedly. The fight between Iran and Israel is a great support for crude oil. In addition, there is EIA crude oil inventory data today.
Fundamental analysis:
Previously, we have been paying attention to geopolitical factors in the fundamentals. Indeed, the situation in the Middle East has also changed the way of gold and crude oil. Today we focus on the monetary policy of the Federal Reserve, and Chairman Powell's speech during the US trading time.
Operational suggestions:
Crude oil---Buy near 72.00, target 72.90-74.90

Crude oil----Buy around 71.00-72.00, target 73.00-77.00Crude oil market analysis:
Last week's crude oil was very exaggerated because it broke the super suppression of 65.00 on the daily line. Once this position was broken, crude oil began to be standard. This is also the result of our many predictions of the cycle. Crude oil purchases will continue to soar this week. In addition, the escalation of the situation in the Middle East will make it difficult for crude oil to fall in the short term. I estimate that there is a possibility of repair. The retracement during the repair is our opportunity to buy again. In addition, the delivery period of crude oil futures contracts will also cause it to fluctuate violently again.
Fundamental analysis:
There are many fundamental analyses and data recently. Geopolitical factors are the main reason for its violent fluctuations. In addition, there is a holiday in the United States this week, and there is also a Federal Reserve interest rate result.
Operation suggestions:
Crude oil----Buy around 71.00-72.00, target 73.00-77.00

Brent OilGiven the conflicts in the Middle East, I think oil could reach $90. I hope that doesn't happen. What do you think? This is my analysis of oil. I think the upward trend will continue.

Crude oil---Buy near 71.00, target 76.00-79.00Crude oil market analysis:
We still buy crude oil in the recent daily line, but yesterday's crude oil daily line closed with a big negative line. Short-term crude oil is about to start repairing. The retracement during the repair is our opportunity to buy again. Crude oil follows the long-term trend. In addition, the war between Iran and Israel is a long-term support for crude oil purchases. If the situation escalates, crude oil may easily stand above the 100 mark in the later period. Consider buying crude oil at 71.00 today.
Fundamental analysis:
Yesterday, Iran and Israel began to bomb each other again, and the situation began to escalate.
Operation suggestions:
Crude oil---Buy near 71.00, target 76.00-79.00

CL Futures Weekly Trade Setup — June 17, 2025🛢️ CL Futures Weekly Trade Setup — June 17, 2025
🎯 Instrument: CL (Crude Oil Futures)
📉 Strategy: Short Swing
📅 Entry Timing: Market Open
📈 Confidence: 68%
🔍 Model Insights Recap
🧠 Grok/xAI – Bearish due to overbought RSI + price stalling near MAs
🤖 Claude/Anthropic – Bearish pullback expected, despite recent strength
📊 Llama/Meta – Overextended Bollinger Band + RSI = short bias
🧬 DeepSeek – Supports downside via divergence + high volatility
⚠️ Gemini/Google – Bullish thesis based on momentum; diverges from consensus
📉 Consensus Takeaway
While short-term momentum is strong, most models forecast a pullback due to:
🔼 Overbought RSI readings
📈 Price extended well above key moving averages
🧨 High volatility and profit-taking zone near $73–$74
✅ Recommended Trade Setup
Metric Value
🔀 Direction Short
🎯 Entry Price $72.65
🛑 Stop Loss $74.20
🎯 Take Profit $68.80
📏 Size 1 contract
📈 Confidence 68%
⏰ Timing Market Open
⚠️ Key Risks & Considerations
🌍 Geopolitical events or OPEC news can cause unexpected surges
📉 If bullish momentum resumes, upside breakout could invalidate short thesis
📏 Risk management is critical—stick to stop-loss if price breaks above $74.20
🧾 TRADE_DETAILS (JSON Format)
json
Copy
Edit
{
"instrument": "CL",
"direction": "short",
"entry_price": 72.65,
"stop_loss": 74.20,
"take_profit": 68.80,
"size": 1,
"confidence": 0.68,
"entry_timing": "market_open"
}
💡 Watch price action at the open. If oil opens weak or fails to reclaim $73, this short setup has a strong edge.

WTI - ANALYSIS BUY AREA This week the ongoing conflict seems to bring more uptrend to this commodity
I believe that the last broken resistance now turning support at 67.300 will be tested prior to the OIL raising again
If the conflict doesn’t end and we don’t have a ceasefire we could see this commodity running to the 78.000 and 82.000 levels

Oil Extends Rally as Israel-Iran Conflict Stokes Supply FearsBrent jumps 5.5 %, bullion hits fresh records, but analysts still see $65 crude by Q4 if key shipping lanes stay open
The crude-oil market loves nothing more than a geopolitical headline, and the one that flashed across terminals this past weekend was a whopper: escalating hostilities between Israel and Iran. Within minutes of the first wire stories, Brent crude vaulted 5.5 % to an intraday high of $76.02 a barrel—its largest single-session pop since Russia invaded Ukraine in early 2022—before giving back part of the gain to settle just under $76. West Texas Intermediate (WTI) traced a similar arc, peaking at $74.11 and closing fractionally lower.
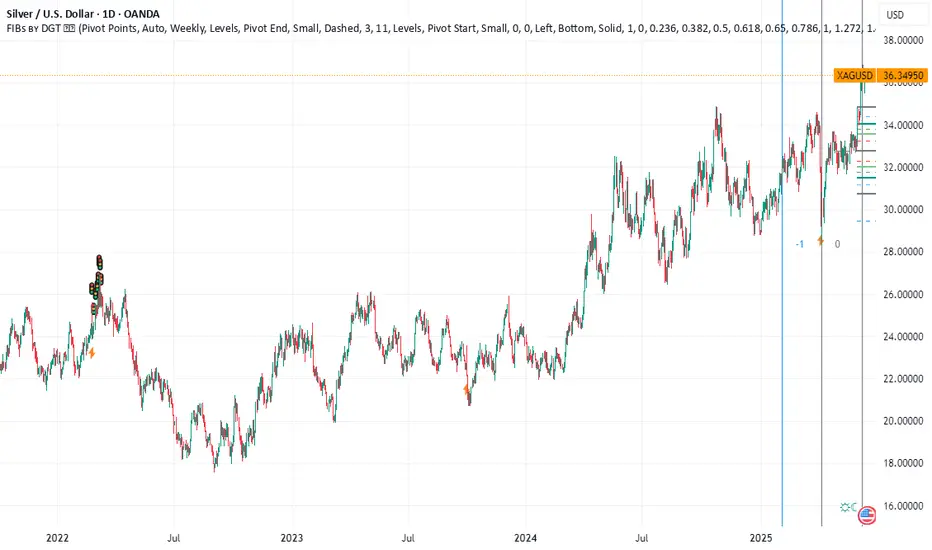
At the same time, investors stampeded into traditional havens. COMEX gold pierced $2,450 an ounce for the first time, while silver sprinted above $33—blowing past the decade-old high set during the meme-metal frenzy of 2021. The twin moves in energy and precious metals underscore how fragile risk sentiment has become even as global demand growth, OPEC discipline, and U.S. shale resilience point to a more balanced physical market later this year.
Below we dissect the drivers of crude’s latest surge, explore the scenarios that could push prices back toward—or away from—the $65 handle by the fourth quarter, and explain why bullion refuses to loosen its grip on record territory.
________________________________________
1. What Sparked the Spike?
1. Tit-for-tat escalation. Reports of Israel striking Iran-linked assets in Syria and Iran responding with drone attacks near the Golan Heights raised fears of a direct Israel-Iran confrontation—a worst-case scenario that could spill into the Strait of Hormuz and threaten 20 % of global seaborne oil.
2. Thin pre-holiday liquidity. Monday volume was 30 % below the 20-day average with several Asian markets closed, exaggerating price swings and triggering momentum-chasing algos.
3. Options market gamma squeeze. Dealers short upside calls scrambled to hedge as spot pierced $75, accelerating the melt-up. Open interest in $80 Brent calls expiring in June ballooned to 45,000 contracts—four times the 3-month norm.
________________________________________
2. How Real Is the Supply Risk?
While the headlines are chilling, physical flows remain intact for now:
• Strait of Hormuz: No tankers have been impeded, insurance premia have widened only 25 ¢ per barrel—well below the $3 spike seen after the 2019 Abqaiq attack in Saudi Arabia.
• Iraqi-Turkish Pipeline: Still shuttered for unrelated legal reasons; volumes have been offline since March 2023 and are therefore “priced in.”
• Suez Canal / SUMED: Egyptian authorities report normal operations.
In short, the rally is risk premia, not actual barrels lost. That distinction matters because premia tend to deflate quickly once tension plateaus, as the market witnessed in October 2023 after Hamas’s initial assault on Israel.
________________________________________
3. Fundamentals Point to Softer Prices by Autumn
Four forces could push Brent back into the $65–68 corridor by Q4 2025 if the geopolitical situation stabilizes:
Force Current Status Q3–Q4 Outlook
OPEC+ Spare Capacity ~5.5 mbpd, most in Saudi/UAE
Ability to add 1–2 mbpd if prices spike
U.S. Shale Growth 13.3 mbpd, record high +0.6 mbpd y/y, breakeven $47–55
Refinery Maintenance Peak spring turnarounds remove 1.5 mbpd demand Units restart by July, easing crude tightness
Global Demand +1.2 mbpd y/y (IEA) Slows to +0.8 mbpd on OECD weakness
Add seasonal gasoline demand ebbing after August, and the supply-demand balance tilts looser just as futures curves roll into Q1 2026 deliveries—a period typically beset by refinery slowdowns and holiday travel lulls.
________________________________________
4. Scenario Analysis: Three Paths for Brent
1. Escalation (20 % probability)
• Direct Israeli strike on Iranian territory → Tehran targets Hormuz traffic
• 3 mbpd disrupted for one month
• Brent overshoots to $100+, backwardation widens above $10
• Biden releases 90 mb from the SPR; OPEC signals emergency meeting
2. Containment (60 % probability)
• Hostilities remain proxy-based in Syria/Lebanon; shipping unscathed
• Risk premium bleeds off; Brent drifts to $70–72 by July
• By Q4 oversupply emerges; prices test $65
3. Detente (20 % probability)
• U.S.-mediated cease-fire; hostages exchanged
• Iran de-escalates to focus on reviving JCPOA talks
• Risk premium collapses; Brent revisits mid-$60s by August and low-$60s into winter
________________________________________
5. Why Gold and Silver Are On Fire
The precious-metals rally is less about oil and more about real yields and central-bank buying:
• Real 10-year U.S. yield sits at 1.05 %, down from 1.55 % in February, boosting gold’s carry cost competitiveness.
• PBoC & EM central banks added a net 23 tonnes in April—the 17th straight month of net purchases.
• ETF inflows turned positive for the first time in nine months, adding 14 tonnes last week.
Silver benefits from the same macro tailwinds plus industrial demand (solar panel capacity is growing 45 % y/y). A tight COMEX inventory cover ratio—registered stocks equal to just 1.4 months of offtake—amplifies price sensitivity.
________________________________________
6. Cross-Asset Implications
1. Equities: Energy stocks (XLE) outperformed the S&P 500 by 3 % intraday but could retrace if crude fizzles. Miners (GDX, SILJ) may enjoy more durable momentum given new-high psychology.
2. FX: Petro-currencies CAD and NOK rallied 0.4 % vs. USD; safe-haven CHF gained 0.3 %. JPY failed to catch a bid, reflecting carry-trade dominance.
3. Rates: U.S. 2-year yields slipped 6 bp as Fed cut odds edged up on stagflation fears, but the move lacked conviction.
________________________________________
7. What Could Invalidate the Bearish Q4 Call?
• OPEC+ Discipline Frays: If Saudi Arabia tires of single-handedly absorbing cuts and opens the taps, prices could undershoot $60—but Riyadh’s fiscal breakeven (~$82) makes this unlikely.
• U.S. Election Politics: A new White House may re-impose harsher sanctions on Iran or ease drilling restrictions, tilting balances either way.
• Extreme Weather: An intense Atlantic hurricane season could knock Gulf of Mexico output offline, squeezing physical supply just as refineries demand more feedstock.
________________________________________
8. Trading and Hedging Playbook
Asset Bias Vehicles Key Levels
Brent Crude Fade rallies toward $80; target $68 by Oct ICE futures, Jul $70 puts Resistance $78.80 / Support $71.30
WTI Similar to Brent NYMEX CL, calendar-spread (long Dec 24, short Dec 25) Resistance $75.20
Gold Buy dips if real yields fall below 0.9 % Futures, GLD ETF, 25-delta call spreads Support $2,390
Silver Momentum long until $35; tighten stops Futures, SLV ETF, 2-month $34 calls Resistance $36.20
Energy Equities Pair trade: long refiners vs. short E&Ps ETFs: CRAK vs. XOP Watch crack spreads
Risk managers should recall that correlation spikes under stress: a portfolio long gold and short crude looks diversified—until a Middle-East cease-fire nukes both legs.
________________________________________
9. Macro Backdrop: Demand Still Fragile
Even before the flare-up, oil demand forecasts were slipping:
• OECD: Eurozone PMIs languish below 50; German diesel demand –7 % y/y.
• China: Q2 refinery runs flatlining; teapot margins < $2/bbl.
• India: Bright spot with gasoline demand +9 %, but monsoon season will clip growth.
On the supply side, non-OPEC production is rising 1.8 mbpd this year, led by Brazil’s pre-salt, Guyana’s Stabroek block, and U.S. Permian efficiency gains. Unless Middle-East barrels exit the market, the call on OPEC crude will shrink from 28 mbpd in Q2 to 26.7 mbpd in Q4, forcing the cartel to decide between market share and price.
________________________________________
10. Historical Perspective: Geopolitical Risk Premiums Fade Fast
Event Initial Brent Jump Days to Round-Trip Barrels Lost?
2019 Abqaiq Attack +15 % 38 < 0.2 mbpd for 30 days
2020 U.S.–Iran (Soleimani) +5 % 10 None
2022 Russia-Ukraine +35 % Still elevated > 1 mbpd rerouted
Based on precedent, a 5–7 % surge without real supply disruption typically unwinds within six weeks.
________________________________________
11. Outlook Summary
• Base Case: Containment; Brent averages $70–72 through summer, melts to $65–68 Q4. Gold consolidates above $2,350; silver churns $30–34.
• Bull Case (Oil): Hormuz threatened; Brent $100+, gas prices soar, Fed forced to juggle inflation vs. growth.
• Bear Case (Oil): Cease-fire + soft demand; Brent breaks $60, OPEC+ grapples with fresh round of cuts.
•
________________________________________
12. Conclusion
The Israel-Iran flashpoint has injected a fresh geopolitical premium into oil and turbo-charged safe-haven metals, but history suggests emotion-driven rallies fade quickly when physical barrels keep flowing. Unless missiles land near Hormuz or an errant drone strikes a Saudi export terminal, the structural forces of rising non-OPEC supply and cooling demand should reassert themselves, dragging Brent back toward the mid-$60s by year-end.
For traders, that means respecting the tape today but planning for mean reversion tomorrow—selling gamma-rich call structures in crude, rolling stop-losses higher on bullion longs, and watching like hawks for any hint that shipping lanes are no longer merely a headline risk but a tangible bottleneck. Until that line is crossed, the smart money will treat each price spike not as the dawn of $100 crude, but as an opportunity to hedge, fade, and position for a calmer, cheaper barrel in the months ahead.
USOIL:Go long
Stay on the long side.
Trading Strategy:
BUY@71.8-72.3
TP: 74-74.3
↓↓↓ More detailed strategies and trading will be notified here ↗↗↗
↓↓↓ Keep updated, come to "get" ↗↗↗

wti looking for reversalSwing trade
Wti looking for reversal 3 Major bull points
Trend reversal
Rsi divergence
Reversal chart pattern Head and shoulder
Manage your risk before putting trade on real account

Iran tensions rise: a setup brewing for gold and oil Geopolitical tensions surrounding Iran might fuel safe-haven demand for gold.
A break above $3,403 might open the door for a test of the May high at $3,437. However, price action over the last two sessions potentially indicates that buyers are reluctant to drive spot prices above $3,400.
At the same time, analysts are suggesting that oil could climb toward $120 if Israel takes military action against Iran. “I don’t want to say it’s imminent, but it looks like something that could very well happen,” President Trump said during a White House event.
Meanwhile, cooler-than-expected US CPI and PPI prints have potentially strengthened expectations that the Federal Reserve could begin cutting interest rates by September, with a second cut possibly following before year-end.

USOUL:Go long near 65.5
USOIL:Crude oil broke through the watershed 64.85 after the emergence of strong unilateral bulls, daily cycle relying on short-term average to go even Yang form, rising space has opened, pay attention to the strong will continue at least a few trading days, short-term relying on 65 defense needs to be more, pay attention to 65.5 near the long, see 66.7-67
Trading Strategy:
BUY@65.5
TP: 66.7-67
↓↓↓ More detailed strategies and trading will be notified here ↗↗↗
↓↓↓ Keep updated, come to "get" ↗↗↗

WTI Crude Oil Stalls At Technical JunctureCrude oil has enjoyed a decent rally in recent weeks thanks to improved sentiment and OPEC+ scaling back production. Yet momentum turned against bulls on Tuesday, despite positive trade talks between the US and China. Today I discuss whether this could be a turning point for oil, or simply a bump in the road.
Matt Simpson, Market Analyst at City Index and Forex.com

WTI CRUDE OIL: Channel Down needing to fill its top. Bullish.WTI Crude Oil turned bullish on its 1D technical outlook (RSI = 62.137, MACD = 0.740, ADX = 26.844), having completed a very strong 1W candle last week. This is the continuation of the May 5th bottom rebound. All prior such rebounds have filled at least the 1W MA50, having touched the 0.618 Fibonacci retracement level. The 1W RSI LH trendline gives a good sense of where to sell, but since the 0.618 Fib is the guide, the target is TP = 71.15.
## If you like our free content follow our profile to get more daily ideas. ##
## Comments and likes are greatly appreciated. ##

Crude oil-----Sell near 64.00, target 63.00-62.00Crude oil market analysis:
Crude oil is still bearish, and we will continue to sell on rebounds. If it does not break 65.00, it will fluctuate. The general trend is bearish. If it breaks, we will adjust our thinking. Today's crude oil is the key. Will it start to take off before the data? The previous crude oil inventory data did not allow crude oil to break the position. The crude oil fluctuation range is 60.00-65.00. If it breaks this range, we will adjust our thinking on fluctuations.
Operational suggestions
Crude oil-----Sell near 64.00, target 63.00-62.00

USOIL:Go short first today
USOIL: Crude oil downward momentum gradually stronger, the day's trend is weak, trading ideas first short.
Trading Strategy:
SELL@63.3-63.5
TP: 62.5-62.3
↓↓↓ More detailed strategies and trading will be notified here ↗↗↗
↓↓↓ Keep updated, come to "get" ↗↗↗

Crude oil----sell near 64.00, target 63.00-60.00Crude oil market analysis:
Yesterday's crude oil still failed to rise. The buying price still failed to stand above 65.00 and was still fluctuating. Today, we continue to look at the range wave. We still consider selling it when it is close to 64. The crude oil inventory data does not give us much room for imagination. In addition, the recent fundamentals of crude oil are not strong, and they do not support the long position of crude oil, which has caused crude oil to fluctuate and hover. The current fluctuation range we see is 65.00-60.00.
Operation suggestions:
Crude oil----sell near 64.00, target 63.00-60.00

USOIL:Go long
Crude oil prices rose due to ongoing tariff uncertainty as well as ongoing geopolitical tensions in the Middle East.
From the chart, the K line has repeatedly appeared long lower shadow small solid positive line, indicating that the lower buying long support is strong. Expected intraday crude oil short - term trend still exists a wave of upward space.
Trading Strategy:
BUY@62.5-62.6
TP: 63.5-64
↓↓↓ More detailed strategies and trading will be notified here ↗↗↗
↓↓↓ Keep updated, come to "get" ↗↗↗

Crude oil futures Trade the range In this video I look at the current range that we are in and I have laid out a plan in the scenario that we break that range to the upside and what we could possibly expect .
I have given some reaction zones where I anticipate price to react when we reach there .
I have used Fibonacci, volume profile, and vwap in this video .
Thankyou for your support

WTI CRUDE OIL: Repeated rejections on the 1D MA50.WTI Crude Oil is neutral on its 1D technical outlook (RSI = 46.483, MACD = -0.530, ADX = 16.270) as it is trading sideways for the past 2 weeks, unable however to cross above the 1D MA50, which along with the LH trendline, keep the trend bearish. Sell and aim for thr S1 level (TP = 56.00). Emerging Bearish Cross also on the 1D MACD.
## If you like our free content follow our profile to get more daily ideas. ##
## Comments and likes are greatly appreciated. ##

BRENT outlook: Watching for a move toward the upper boundary (D)Price is currently trading within a broad range, and the main expectation is a move toward the upper boundary — but confirmation is key.
I'm watching the high of the May 22 bar as a key level, since it holds the highest traded volume in recent days.
If price breaks and holds above 64.987 ,
🎯 First target: 67.791
🎯 Second target: 68.619
