USOIL:Long at 61.3-61.5
Last week's long target has been completed, the current decline is mainly due to concerns that global supply growth may exceed demand growth, from the technical trend, the objective trend of the middle line downward, short term long and short frequently alternate, pay attention to the support point of 60.3-60.5 within the day. Considering that it has been around this point of shock and not broken, short - term trading to do more.
So the trading strategy :BUY@61.3-61.5 TP@62.5-62.7
↓↓↓ More detailed strategies and trading will be notified here →→→
↓↓↓ Keep updated, come to "get" →→→
Oiltrading

USOIL:Go long first
Crude oil short-term trend to maintain weak shock upward rhythm, K line closed long lower shadow line, there are signs of rebound. Short - term moving average system gradually long arrangement, relying on oil prices, short - term objective trend direction to upward. It is expected that the intraday trend of crude oil will continue to extend upward, hitting around 62.8-63
Recommended Trading Strategies:
61-61.2 range to be long, short-term target to see 62, break through the target to see 62.8-63
↓↓↓ The detailed strategy club will have tips, updated daily, come and get them →→→

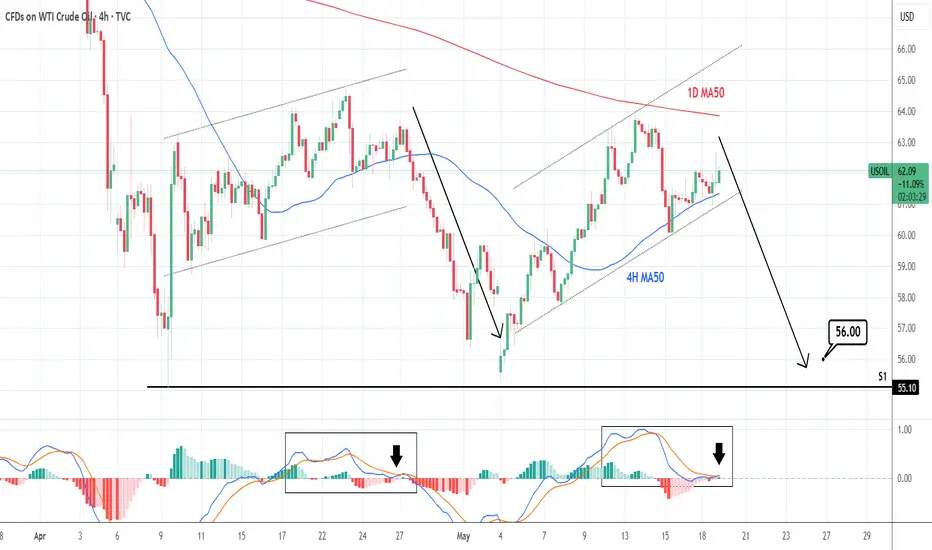
WTI CRUDE OIL: Mirror pattern calls for a sell.WTI Crude Oil is neutral on its 1D technical outlook (RSI = 50.222, MACD = -0.370, ADX = 25.154) as the price is just under the 1D MA50, where it got rejected last Tuesday. In the meantime, it has the support of the 4H MA50, hence stuck inside a neutral range. This pattern is however identical to April, after which the price declined aggressively to the S1 level. Sell, TP = 56.00.
See how our prior idea has worked out:
## If you like our free content follow our profile to get more daily ideas. ##
## Comments and likes are greatly appreciated. ##
TP REACHED ON USOILEarlier I posted to buy on USOIL, now the price reached our target to leave us with he first profitable trade of the day!
Follow for more!

BUY USOILBeen a while since I last posted about American Market,
I'm sharing with you a trade I caught on OIl that you still can take with the same SL and TP as mine.
Follow for more!

Bullish bounce off overlap support?WTI Oil (XTI/USD) is falling towards the pivot and could bounce to the 1st resistance, which is a pullback resistance.
Pivot: 59.97
1st Support: 57.60
1st Resistance: 63.27
Risk Warning:
Trading Forex and CFDs carries a high level of risk to your capital and you should only trade with money you can afford to lose. Trading Forex and CFDs may not be suitable for all investors, so please ensure that you fully understand the risks involved and seek independent advice if necessary.
Disclaimer:
The above opinions given constitute general market commentary, and do not constitute the opinion or advice of IC Markets or any form of personal or investment advice.
Any opinions, news, research, analyses, prices, other information, or links to third-party sites contained on this website are provided on an "as-is" basis, are intended only to be informative, is not an advice nor a recommendation, nor research, or a record of our trading prices, or an offer of, or solicitation for a transaction in any financial instrument and thus should not be treated as such. The information provided does not involve any specific investment objectives, financial situation and needs of any specific person who may receive it. Please be aware, that past performance is not a reliable indicator of future performance and/or results. Past Performance or Forward-looking scenarios based upon the reasonable beliefs of the third-party provider are not a guarantee of future performance. Actual results may differ materially from those anticipated in forward-looking or past performance statements. IC Markets makes no representation or warranty and assumes no liability as to the accuracy or completeness of the information provided, nor any loss arising from any investment based on a recommendation, forecast or any information supplied by any third-party.

Crude oil------sell near 65.00, target 63.00-62.00Crude oil market analysis:
Gold has been moving recently, and crude oil has also moved with it. Yesterday's crude oil daily line closed with a big positive, and is currently testing the big pass near 65.00 on the weekly line. If this position is broken, we will be bullish on the long-term trend of crude oil. Today's crude oil idea is to rebound in the short term, and the general trend is bearish. Consider selling when it approaches 65.00 for the first time. 61.30 is the buying and receiving position. Pay attention to the inventory changes of crude oil later.
Operational suggestions:
Crude oil------sell near 65.00, target 63.00-62.00

USOIL UPDATEHello friends
Given the recent growth in oil prices, it is natural for the price to correct. Now we have obtained the most important price support areas for you and we have also specified the target. If you are willing to enter the transaction, be sure to observe capital management.
*Trade safely with us*

XTIUSD Crude oil Raid Plan: Snag Profits Before the ATR Trap!🌍 Greetings, Wealth Warriors! Salut! Ciao! Salaam! 🌟
Fellow Profit Pirates, 🤑💰🚀
Crafted with 🔥Bandit Blueprint analysis🔥 (technical + fundamental), here’s our cunning scheme to raid the "XTIUSD / WTI Oil" Energy Market. Follow the charted course for a long entry, aiming to slip away near the high-stakes ATR Zone. Watch out—overbought signals, consolidation, or a trend flip could trap the unwary where bearish bandits lurk! 🏴☠️💸 "Cash out and celebrate, traders—you’ve earned it! 🎉💪"
**Entry 📈**: "The vault’s open! Await the MA breakout (64.00), then strike—bullish riches await!"
Pro tip: Set buy stop orders above the Moving Average or place buy limit orders at the latest 15/30-min swing low/high for pullback entries.
📢 Set a chart "alert" to catch the breakout moment!
**Stop Loss 🛑**: "📣 Heads up, crew! 🗣️ For buy stop orders, hold off on placing that stop loss until the breakout sparks 🚀. Stick to my marked spot 📍 or go rogue at your own peril 😎—it’s your gamble! ⚠️"
📍 Bandit SL set at the recent 3H swing low (60.00) for swing trades.
📍 Adjust SL based on your risk, lot size, and number of orders.
**Target 🎯**: 70.000 or bail out before the finish line.
🧲 **Scalpers, listen up** 👀: Stick to long-side scalps. Big bankrolls can dive in; smaller stacks, join the swing trade heist. Use trailing SL to shield your loot 💰.
💸 **US Oil Spot / WTI** Swing Trade Plan: Bullish vibes 🐂 are surging, fueled by key drivers. ☝
📰 **Dive Deeper**: Check Fundamentals, Macro Trends, COT Reports, Seasonal Patterns, Intermarket Insights, Inventory Data, and Future Targets 👉🔗
⚠️ **Trading Alert: News & Position Tips** 🗞️ 🚨
News drops can shake prices and volatility. To protect your haul:
- Skip new trades during news events.
- Use trailing stops to lock in gains.
💖 **Fuel our heist!** 💥Tap the Boost Button💥 to power up our profit raid. Join the Bandit Trading Crew, snatching wins daily with ease! 🏆🤝🎉
Stay sharp for the next caper—see you soon! 🤑🐱👤🚀
---
Real-Time Data (UTC+1, May 14, 2025) 📊
**WTI Oil (XTIUSD)**:
- **Price**: ~$63.80 (based on latest market data)
- **MA Breakout Level**: ~$64.00 (as per strategy)
- **Stop Loss Level**: ~$60.00 (3H swing low)
- **Target**: $70.00
- **Market Sentiment**: Bullish 🐂, driven by inventory draws and geopolitical factors (per recent analysis).
**Latest COT Data (Friday, May 9, 2025)**:
- **Commercial Hedgers**: Increased net long positions in WTI futures, signaling bullish bias.
- **Large Speculators**: Moderately net long, cautious due to overbought risks.
- **Data Source**: CFTC (official Commitment of Traders report).
**Key Fundamental Drivers**:
- **Inventory**: EIA reported a -2.5M barrel draw last week, supporting bullish momentum.
- **Geopolitical**: Middle East tensions continue to prop up oil prices.
- **Seasonal**: Summer demand expectations rising.
🔔 **Note**: Monitor upcoming EIA inventory data (Wednesday, May 14, 2025) for volatility.
---
💥 Boost this plan and let’s plunder the markets together! 🚀

US-Oil will further push upside After Testing TrendlineHello Traders
In This Chart XTIUSD HOURLY Forex Forecast By FOREX PLANET
today XTIUSD analysis 👆
🟢This Chart includes_ (XTIUSD market update)
🟢What is The Next Opportunity on XTIUSD Market
🟢how to Enter to the Valid Entry With Assurance Profit
This CHART is For Trader's that Want to Improve Their Technical Analysis Skills and Their Trading By Understanding How To Analyze The Market Using Multiple Timeframes and Understanding The Bigger Picture on the Charts

WTI CRUDE OIL: Short term rebound on RSI Bullish DivergenceWTI Crude Oil is bearish on its 1D technical outlook (RSI = 38.958, MACD = -2.110, ADX = 28.985) as it remains on a multi-month Low. The 1D RSI however displays a HL Bullish Divergence and this can cause a short term price rebound. The Resistance is the Pivot Zone and short term the LH trendline is what maintains the downtrend. Consequently, we are now bullish, TP = 64.90.
## If you like our free content follow our profile to get more daily ideas. ##
## Comments and likes are greatly appreciated. ##

Oil - Short Term Sell Trade Update!!!Hi Traders, on April 17th I shared this idea "Oil - Looking To Sell Pullbacks In The Short Term"
I expected to see bearish continuation until the two Fibonacci resistance zones hold. You can read the full post using the link above.
Price moved lower as per the plan here!!!
Price respected the first Fibonacci resistance zone, created a false break of it and moved lower as expected!!!
If you enjoy this idea, don’t forget to LIKE 👍, FOLLOW ✅, SHARE 🙌, and COMMENT ✍! Drop your thoughts and charts below to keep the discussion going. Your support helps keep this content free and reach more people! 🚀
-------------------------------------------------------------------------------------------------------------------
Disclosure: I am part of Trade Nation's Influencer program and receive a monthly fee for using their TradingView charts in my analysis.

Price OIL will continue falling ?!According to Global Channel
According to minor channel
According to Flag Pattern
According to CCI under zero
According to Breakout Support Level @ 66 USD.

Crude Oil | Support Level 62.700-61.700Crude Oil reached support level.
Take Profit : 71.750
Stop Loss : 60.680

Short on Oil/Back to 57$ SOONI believe we can continue the retest of previous major support level at 65-66$ and fibonacci 0.618. This major support will be flipped to resistance in my opinion. We can see a significant sell-off back towards the 57$ area and below from this location.
I will be looking to enter a short trade from the 0.618 region/66$ if there is a rejection.
My mid-term/end-of-year prediction for US OIL is between 45-50$ and possibly lower.
If you believe in the fundamentals and idea of this setup, feel free to follow and use it.
Not financial advice.

Oil : April Could Be the Worst Month in Three and a Half YearsOil Prices: April Could Be the Worst Month in Three and a Half Years
As the XTI/USD chart shows:
→ at the beginning of April, WTI crude was trading above $71 per barrel;
→ this morning, on the last day of the month, the price has fallen below $60.
The overall decline may reach 16% — the worst monthly performance since November 2021.
Why Is Oil Falling?
The primary driver behind the sharp drop in oil prices earlier this month was the introduction of new US tariffs, particularly targeting China and the EU. This raised concerns that a potential global trade war could slow economic growth and, in turn, reduce global oil demand.
According to a Reuters poll, the tariffs imposed by Trump have made a global recession in 2025 a realistic risk.
In addition, growing attention is being paid to OPEC+ and its plans to increase oil production. The next meeting is scheduled for 5 May.
Technical Analysis of the XTI/USD Chart
Oil price fluctuations in 2025 have formed a descending channel (highlighted in red), with lower highs and lower lows reflecting continued bearish sentiment.
Bulls may hope for support to emerge around the $58.85 level, as:
→ this has acted as support before (as indicated by arrows);
→ this level aligns with the lower boundary of a local upward trend (shown in blue), which formed after news broke that Trump had postponed the implementation of some tariffs — triggering a sharp rebound in oil prices from the 9 April low.
Nevertheless, the broader structure remains bearish: the rise towards point C appears to be a corrective recovery following the impulse drop from A to B. Given the potential impact of upcoming news — including statements from the White House and OPEC+ decisions — a bearish breakout below the blue channel cannot be ruled out.
This article represents the opinion of the Companies operating under the FXOpen brand only. It is not to be construed as an offer, solicitation, or recommendation with respect to products and services provided by the Companies operating under the FXOpen brand, nor is it to be considered financial advice.

Oil - Short Term Sell Trade Update!!!Hi Traders, on April 17th I shared this idea "Oil - Looking To Sell Pullbacks In The Short Term"
I expected to see bearish continuation until the two Fibonacci resistance zones hold. You can read the full post using the link above.
The price is currently holding in the first Fibonacci resistance zone.
Until both the Fibonacci resistance zones hold my bearish view still remains.
If you enjoy this idea, don’t forget to LIKE 👍, FOLLOW ✅, SHARE 🙌, and COMMENT ✍! Drop your thoughts and charts below to keep the discussion going. Your support helps keep this content free and reach more people! 🚀
-------------------------------------------------------------------------------------------------------------------
Disclosure: I am part of Trade Nation's Influencer program and receive a monthly fee for using their TradingView charts in my analysis.

Crude oil---sell near 63.00, target 60.00-58.00Crude oil market analysis:
The recent crude oil daily line has also begun to decline. Yesterday, the daily line closed negative, and the selling began to decline. Today's idea is to consider selling opportunities near the rebound of 63.00. Crude oil continues to be bearish. No matter the fundamentals or technical aspects, there is no sign of bullishness. Today, crude oil is expected to fluctuate and fall. Don't chase the rebound. We are considering it. In addition, crude oil will also close the monthly line. Pay attention to its monthly line.
Fundamental analysis:
This week is a data week. Starting from Wednesday, big data will be released one by one. In addition, continue to pay attention to the situation of the US dollar and the changes in tariff policies.
Operation suggestions:
Crude oil---sell near 63.00, target 60.00-58.00

WTI CRUDE OIL: Buy signal at the bottom of the Channel Up.WTI Crude Oil turned bearish on its 1D technical outlook (RSI = 42.387, MACD = -1.000, ADX = 27.186) as it crossed under the 4H MA50. Still, it hit and is so far contained at the bottom of the Channel Up, which makes it a strong short term buy opportunity. Aim for the 4H MA200 (TP = 65.00).
## If you like our free content follow our profile to get more daily ideas. ##
## Comments and likes are greatly appreciated. ##

Crude oil------sell near 64.30, target 60.00-58.00Crude oil market analysis:
Crude oil has been fluctuating recently. Today, we focus on the rhythm and range of its fluctuations. The suppression near 65.30 is successful. The selling trend is downward. Let's sell on the rebound today. Pay attention to the suppression near 64.00. There is still room for selling. The recent data and tariff war on crude oil have not had a big impact on it, so it has been hovering.
Crude oil market analysis:
Crude oil has been fluctuating recently. Today, we focus on the rhythm and range of its fluctuations. The suppression near 65.30 is successful. The selling trend is downward. Let's sell on the rebound today. Pay attention to the suppression near 64.00. There is still room for selling. The recent data and tariff war on crude oil have not had a big impact on it, so it has been hovering.
Operational suggestions
Crude oil------sell near 64.30, target 60.00-58.00

OIL...SHORT BLACKBULL:WTI
is approaching the key resistance zone at .
I'm watching closely for a valid reaction before considering any position.
***If the level breaks and price retests it successfully, I may consider a counter-directional setup.

Crude oil---sell near 63.90, target 60.00-58.00Crude oil market analysis:
The recent crude oil has been delivered. The new contract is relatively strong at present. Yesterday's daily line closed with a positive line. In the short-term bottom shock, we are still bearish on crude oil today. We continue to sell. The large pattern suppresses around 65.30. The daily moving average suppresses around 65.700, which means that buying needs to break this position to reverse. Today's crude oil is suppressed at 63.90.
Operational suggestions:
Crude oil---sell near 63.90, target 60.00-58.00
Oil slumps as demand outlook dims and supply risesMacro:
- Oil prices stay weak as trade war fears weigh on global growth and energy demand.
- The IEA cut its 2025 oil demand growth forecast to just 730k bpd, the slowest pace in five years, down from 1.03 mln.
- Meanwhile, OPEC+ output is rising, with Saudi Arabia set to boost exports to China in May and Russia maintaining steady production, fueling oversupply concerns.
Technical:
- USOIL is in a clear downtrend fueled by lower highs and lows. The price is below both EMAs, indicating persistent downward momentum.
- If USOIL closes above the resistance at 63.30, the price may retest the following resistance at 65.80.
- On the contrary, remaining below 68.30 may pave the way to retest the support at 57.25 and 53.85, respectively.
Analysis by: Dat Tong, Senior Financial Markets Strategist at Exness
