XRPUSDT.P — Is This the Beginning of the Next Pump?
BINANCE:XRPUSDT.P is bouncing back with style — and this long setup is giving off real “king of the charts” vibes. Look at that clean risk-to-reward!
Entry: 2.0905 USDT
Stop-loss: 2.0574 USDT
Take-Profit: 2.2238 USDT
R:R Ratio: 3.28
Why this setup matters:
Confirmed bounce off intraday support
Momentum shift with bullish engulfing candle
Targeting a clean resistance level for optimal exit
Tight stop, juicy upside — exactly what scalpers and day traders crave. Add to watchlist and get ready to trail that stop if momentum holds.
Okx

Will APTUSDT Bounce or Break? Last Chance for the Bulls?BINANCE:APTUSDT.P
🚨 APTUSDT is sitting at a crucial level. After multiple CHoCH and BoS signals, price has dumped into the key Demand Zone (PDL) . Now it’s either a spring up or a deeper dump to the next liquidity zone.
📌 Technical Outlook:
CHoCH → BoS → Liquidity Grab: Clear bearish structure.
Equilibrium broken: Bulls failed to hold control.
Now: Price is testing the blue Demand Zone (PDL) with big orders possibly resting.
🎯 Trade Plan:
Scenario 1: Long from support zone
Entry: bounce from 5.45–5.50 USDT
Stop-Loss: under wick low at <5.38 USDT
Take-Profits:
TP1: 5.70 USDT
TP2: 5.90 USDT (Equilibrium zone)
TP3: 6.00–6.15 USDT (Imbalance + Premium zone)
Scenario 2: Short after PDL breakdown
Entry: break and retest below 5.45 USDT
Stop-Loss: above 5.55 USDT
Targets:
TP1: 5.20 USDT
TP2: 5.00 USDT
📊 Confluence Factors:
Volume spike = buyer activity
Local CHoCH inside zone = reversal signal
Strong impulse down may sweep liquidity
💬 Final Thought:
APT is at a pressure point — it’s spring or capitulation. Clear setup, no tilt.

$XCH ANALYSIS! NASDAQ:XCH is testing the red resistance zone 🟥.
✅ If breakout is successful, the first target is the green line level 🟩.

XLMUSDT: Bearish Pressure Rising – Breakdown or Fakeout?
💥 BINANCE:XLMUSDT.P continues its downtrend, struggling under a descending trendline, currently trading around 0.42018 USDT . The price has failed to break above resistance, strengthening the bearish momentum. Will we see a breakdown or a reversal soon?
---
🔑 Key Levels:
Support:
0.41998 USDT — immediate support currently being tested.
0.41651 USDT — a key level where buyers may step in.
0.40268 USDT — if price reaches here, bears are fully in control.
Resistance:
0.44319 USDT — critical level, a breakout here could break the downtrend.
0.44763 USDT — liquidity zone, potential upside target.
0.50000 USDT — longer-term target, requiring strong demand.
---
🚩 Trading Strategy:
Entry Points:
- A short setup if price breaks below 0.41998 USDT with strong volume confirmation.
- A long setup only if price shows a clear reversal above 0.44319 USDT .
Stop-Loss:
- Shorts should have SL above 0.44319 USDT .
- Longs should place SL below 0.41651 USDT to avoid liquidity traps.
Take-Profit Targets:
0.41530 USDT — first target for shorts.
0.40268 USDT — potential bottom where buyers may appear.
0.44763 USDT — in case of a bullish breakout.
---
📈 Technical Analysis:
The downtrend remains intact as long as price stays below the descending trendline.
Low trading volume suggests weak bullish momentum.
A breakdown could accelerate selling as long positions get liquidated.
---
💡 Conclusion:
Price is at a critical zone – if support fails, bears could push it below 0.40 USDT. The big question is: will this be a liquidity grab with a sharp reversal, or will bears keep the pressure on? Let's discuss! 🐻📉

TradeCityPro | OKB: Uptrend in HWC with Fresh Bullish Momentum👋 Welcome to TradeCityPro!
In this analysis, I want to examine the coin OKB, the official cryptocurrency of the OKX exchange, one of the world's largest exchanges. Currently, with $4 billion in daily spot trading volume and $34 billion in futures, it ranks fourth among crypto exchanges globally.
📅 Weekly Timeframe: Long-Term Ascending Structure
In the weekly timeframe, we are witnessing a long-term uptrend in a High Wave Cycle (HWC), which has been evident since the coin's launch, moving within an ascending channel. Initially, the price moved to a resistance at $33.45, and after breaking this level, it created a new high at $67.87 and has pulled back to $33.45 once.
🔍 Currently, the price is in a range between $33.45 and $67.87. After reaching $33.45, this area aligned with the channel's lower trend line, and considering the proximity to the 0.382 Fibonacci level, it formed a very strong Potential Reversal Zone (PRZ), propelling the price upward again. The price is now moving towards $67.87, a strong supply area and the coin's all-time high (ATH) resistance.
🚀 If this area is broken, the price could potentially move towards $110 and $230, targets based on Fibonacci levels. With a market cap of $3.5 billion, if this project enters the top 20 and pushes its market cap above $10 billion, these targets could be easily reached. Entry into overbuy conditions on the RSI could assist in reaching these targets.
🔽 If the price corrects further and breaks below $33.45, the next areas would be the 0.618 and 0.786 Fibonacci levels. However, if $33.45 is broken, it could introduce a strong bearish momentum into the market, possibly turning the HWC into a bearish trend.
📅 Daily Timeframe: Reintroduction of Bullish Momentum
In the daily timeframe, we are observing a momentum shift starting from the price reaction at $33.45. After breaking $43.33, more volume and momentum entered the market, and the price has since pulled back to the SMA99 twice.
👀 Today’s candle is a large green one, approximately 20% in size, reaching up to resistance at $62.01. If the RSI enters overbuy conditions and $62.01 is broken, the price could move towards $72.68. If this resistance is also broken, as mentioned, the price could register new ATHs. In addition to the targets outlined in the weekly timeframe, the middle line of the ascending channel could serve as a new target.
🧩 For now, I see no signs of a trend reversal and suggest if you hold this coin and are in profit, keep it as long as the price stays above the channel's lower line. A break below 50 on the RSI could increase the likelihood of this scenario unfolding.
⏳ 4-Hour Timeframe: Futures Triggers
I've discussed various scenarios in higher timeframes, and in this timeframe, I want to outline just the futures triggers.
🔼 For long positions, first, I must note that since the RSI is in overbuy territory, I personally prefer not to open a long position and wait until this oscillator returns to a normal range. Then, wait for the price to stabilize above $60.67 before opening your position, with a potential target of $72.68.
🔽 For short positions, I recommend not opening a short on this coin due to the clearly bullish trend seen in the weekly and daily timeframes. If you insist on shorting, breaking supports at $51.30 and $45.21 could serve as triggers, but as mentioned, I will not be joining you in this as it goes against the main market trend.
📝 Final Thoughts
This analysis reflects our opinions and is not financial advice.
Share your thoughts in the comments, and don’t forget to share this analysis with your friends! ❤️

TURBOUSDT: Breakout Incoming or Another Fakeout?
Hey traders! Today we’re watching BINANCE:TURBOUSDT.P The price is consolidating around 0.0084450 USDT , testing a key resistance level. We’re seeing a classic ascending triangle forming — a textbook pattern before a big move. Will we see a breakout, or is this just another fakeout?
---
🔑 Key Levels:
Support:
0.0082000 USDT — a key level where buyers could step in again.
0.0080000 USDT — the last line of defense before a potential drop.
Resistance:
0.0087261 USDT — the first barrier keeping price in check.
0.0087928 USDT — the final line before a potential surge.
---
🚩 Trading Strategy:
Entry Point:
- Long entry on a confirmed breakout above 0.0087261 USDT with volume confirmation.
Stop-Loss:
- Place a stop below 0.0082000 USDT to avoid unnecessary drawdowns.
Take-Profit Targets:
0.0087928 USDT — the first level to lock in some profits.
0.0090000 USDT — a target in case of a strong impulse.
---
📈 Technical Analysis:
An ascending triangle is forming, signaling potential accumulation.
Increasing volume near resistance indicates strong buyer interest.
If the breakout fails, we may see a retest of support before another attempt.
---
💡 Conclusion:
This setup looks promising, but confirmation is key. What do you think? Seeing order book liquidity or potential rejection signs? Let’s discuss in the comments!

NEIROUSDT: Is the Market Ready for a Breakout?
Hello, traders! Today we’re analyzing $NEIROUSDT. The chart is showing an upward trend with key resistance at 0.0008378 USDT . The current price sits at 0.0008189 USDT , and the market appears poised for a move. Will it be a pump, or are we in for a pullback?
---
🔑 Key Levels:
Support:
0.0008100 USDT — a zone where buyers may hold the market steady.
0.0007800 USDT — a backup support level in case of a dip.
Resistance:
0.0008378 USDT — the critical level that must break for continued growth.
0.0008700 USDT — a profit-taking target after the breakout.
---
🚩 Trading Strategy:
Entry Point:
- Consider going long after a confirmed breakout above 0.0008378 USDT with volume confirmation.
Stop-Loss:
- Place your stop below 0.0008100 USDT to minimize risk.
Take-Profit Targets:
0.0008500 USDT — the first target for partial profit-taking.
0.0008700 USDT — the final target for this move.
---
📈 Technical Analysis:
The upward trend signals increasing buyer interest.
Volumes are gradually increasing, confirming bullish intentions.
If the price consolidates above 0.0008378 USDT , it could trigger a significant impulse.
---
💡 Conclusion:
The NEIROUSDT market is at a critical decision point. Will buyers maintain control, or are we heading for a pullback? Share your thoughts in the comments and keep an eye on key levels!

BITCOIN - THE KING OF CRYPTO (TECHNICAL ANALYSIS + TRADE PLAN)Descending Trading Channel:
Bitcoin is currently in a descending trading channel, indicating short-term bearish pressure but within a larger bullish structure.
The breakout above the channel's resistance line signals a potential reversal to an uptrend.
Support Zone:
A strong support zone is marked around the $92,000–$94,000 range, where demand is evident, as indicated by price consolidation.
Indicators:
RSI (Relative Strength Index):
RSI near 47 suggests the asset is in neutral territory but trending upwards, moving away from oversold conditions.
Stochastic Oscillator:
Bullish crossover near 66 indicates increasing momentum toward an overbought state, confirming the breakout possibility.
Money Flow Index (MFI):
Rising MFI implies capital inflow, supporting the likelihood of upward price movement.
VMC Cipher B Indicator:
Bullish divergences are forming, suggesting a potential trend reversal.
Volume Profile:
While not explicitly shown, the lack of significant volume during the recent decline confirms a corrective phase rather than a bearish trend.
Target Zones:
Initial target post-breakout: $100,000 (psychological resistance).
Secondary target: $108,000–$112,000, where historical resistance might emerge.
Trading Plan:
Entry Strategy:
Enter once Bitcoin decisively breaks above the descending trading channel resistance with strong volume confirmation.
Support Buy:
Accumulate near $92,000–$94,000 if the price retests the support zone.
Stop-Loss Placement:
Place stop-loss below the $90,000 mark to minimize risk if the breakout fails or support zone does not hold.
Short-Term Target:
Set take-profit at $100,000, just below psychological resistance to ensure execution.
Medium-Term Target:
Partial profit at $108,000 and $112,000 for extended upside.
Risk Management:
Limit exposure to 1-2% of total capital per trade.
Maintain a risk-reward ratio of at least 1:3 to optimize profitability.
Watch for increased volume during breakout confirmation.
Monitor macroeconomic factors and news affecting Bitcoin, as sudden events may invalidate technical setups.

ETHUSDT: Attempting a Recovery After the Dump
Hey, traders! Today, we’re focusing on $ETHUSDT. The price is trying to recover after a sharp dump, currently sitting at 3,345.52 USDT . We see a support level at 3,308.46 USDT , which has held up under pressure, but its retention remains critical.
---
🔑 Key Levels:
Support:
3,308.46 USDT — the key zone where buyers might keep the market steady.
3,302.52 USDT — an additional defense level in case of renewed pressure.
Resistance:
3,360.00 USDT — the nearest target to test the bulls' strength.
3,400.00 USDT — a zone for partial profit-taking if the upward momentum continues.
---
🚩 Trading Strategy:
Entry Point:
- Consider a long position after confirming the support at 3,308.46 USDT and observing a bullish impulse.
Stop-Loss:
- Place your stop below 3,302.52 USDT to minimize risks.
Take-Profit Targets:
3,360.00 USDT — the first profit-taking point.
3,400.00 USDT — the final target for this upward move.
---
📈 Technical Analysis:
The sharp volume dump indicates a liquidity grab attempt.
If bulls can hold the 3,308.46 USDT level, recovery toward resistance is possible.
It’s important to monitor volume and price reaction at key levels.
---
💡 Conclusion:
Ethereum is clearly attempting to recover after a strong dump, but buyers must hold support. Will the market manage to reclaim lost ground? Share your thoughts in the comments!

Usual/UsdtBINANCE:USUALUSDT
Right now, the price of the asset is at **0.9789** 📊. This is a crucial level because if the price starts to fall and can’t maintain its position above **0.900** 🚨, this would signal a potential downturn. **0.900** is considered the "last hope" support level for this price action—if the price drops below that, things could get tricky.
If the price falls below **0.900**, the next level of support to watch for is **0.8308** 📉. Support is where the price tends to find buying interest, so if it reaches this point, there might be a chance for it to bounce back up. However, if it breaks through this, further downward movement could be expected.
On the flip side, if the price holds and continues to rise, it will face resistance levels that could prevent it from moving higher. These resistance levels are key price points where sellers might step in to take profits, or where the price could struggle to break through. In this case, the resistance levels are:
- **1.00** 🔴: This is a round number, which tends to be a psychological resistance point.
- **1.1544** 🔴: A higher level, possibly linked to previous market highs.
- **1.253** 🔴: Another key resistance, which could be a tough barrier for the price to pass.
- **1.432** 🔴: The highest resistance level to watch; if it breaks through here, it could signal a strong bullish movement.
To recap, **0.900** is your “last hope” support, and **0.8308** is your next major support level if the price falls. On the upside, watch the resistance levels at **1.00**, **1.1544**, **1.253**, and **1.432**.
And remember, all of this is purely based on technical analysis, and **this is not financial advice** ⚠️💸. Always make sure to do your own research before making any financial decisions! 🧠💡

BTC Adjusting December 12, 2024BTC in the medium term may have a correction phase in the next 1-2 weeks to complete the 4th wave if the previous wave is an extended wave, in case it ends then the abc model will run.

MEMEFI ... next x10-100 upcoming! 5 reasons to buy MEMEFI right now...
Fundamental Analysis:
Innovative Concept: MemeFi combines meme culture with decentralized finance (DeFi) on the Sui blockchain, offering a unique and engaging gaming experience.
Community Focus:
The game emphasizes social interaction and community involvement, which can drive user engagement and retention.
Token Economy:
MemeFi has a rich token economy that rewards players for their participation, making it attractive for both gamers and investors.
Strategic Blockchain Choice:
By choosing the Sui blockchain, MemeFi benefits from lower transaction fees and faster processing times, enhancing user experience.
Future Growth Potential:
The project has a solid roadmap for future development, indicating potential for long-term growth and increased value.
Buy by spot and keep your risk management.
JB.-

The TradingView Show: Strategy Session with OKX Product PartnerWelcome, TradingViewers! 🚀
Get ready for an exciting and educational live stream designed to empower traders of all levels! In this broadcast, we’ll dive deep into markets starting with a top down research process, looking at the macro picture first, then zooming in to the moves that are shaping markets right now. We'll also dive into Pine Script, the election, recent moves as the year comes to an end, and much more.
Our partner OKX has brought on one of their product partners to walk our audience through the charts. Remember: OKX is a partner and integrated broker of ours. Connect your OKX account to your TradingView account to get started by clicking the Trading Panel below the chart.
Here’s what we’ll cover:
1. Top-Down Market Research: Start with a macro view of the markets and learn how to break down the big picture to make better, more informed trading decisions.
2. Crypto Market Updates: Get the latest insights and analysis on cryptocurrencies and what’s driving the market right now.
3. Pine Script Deep Dive: Learn how to leverage Pine Script to enhance your trading strategies and build custom indicators on TradingView.
4. Trading the Election & Year-End Moves: Understand how political events and seasonal market shifts are influencing price action as we approach the end of the year.
5. Live Q&A: Have your trading questions answered in real time by industry experts, and get tailored advice to level up your trading skills.
Follow OKX on TradingView here: www.tradingview.com
Sit back, ask questions, and enjoy the show! Please note: This show is only for education and entertainment.

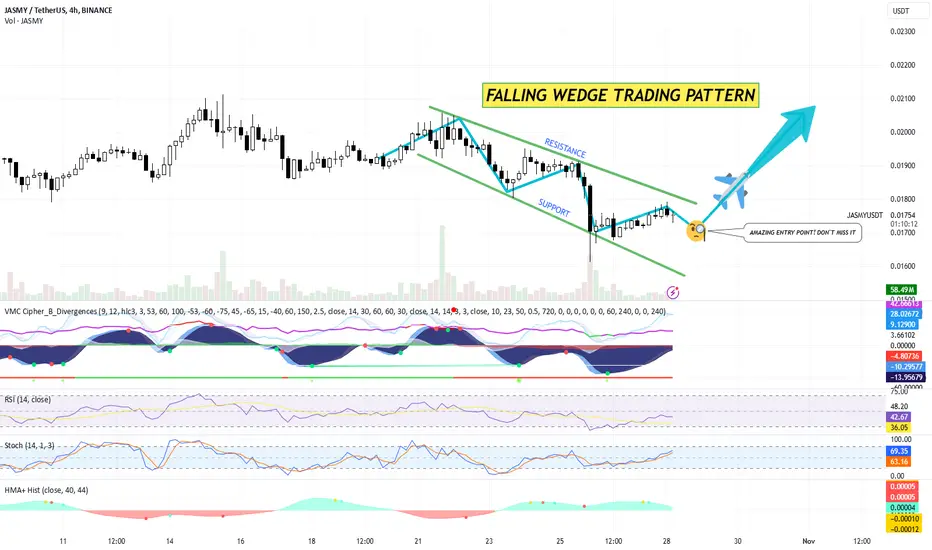
JASMY AT A PERFECT ENTRY POINT FOR A LONG POSITION! TRADE PLANTechnical Analysis by Blaž Fabjan
Pattern Identification:
The chart displays a falling wedge pattern , a bullish reversal pattern often signifying a potential trend change from bearish to bullish.
The price action is currently testing the upper boundary of the wedge pattern, indicating that a breakout could be imminent if there’s sufficient buying momentum.
Support and Resistance:
Support Line: The lower green line in the falling wedge acts as support. This line has been consistently respected, indicating strong buying interest at those levels.
Resistance Line: The upper green line marks the resistance level within the pattern. A breakout above this line would be considered a strong bullish signal.
Volume Analysis:
There’s a noticeable decrease in volume within the wedge, which aligns with typical falling wedge characteristics. Look for a volume increase on a breakout to confirm the move.
Indicators:
VMC Cipher: Divergences and buy signals have been detected, showing signs of potential momentum shifts.
RSI: At around 41.07, the RSI is approaching the neutral zone (50), suggesting the potential for further upside if it breaks above 50.
Stochastic: Currently around 60.48, indicating upward momentum and possibly further bullish action if it continues moving up.
HMA+ Histogram: Showing minor bullish signals that could align with a breakout confirmation.
Entry Signal:
The wedge breakout zone is highlighted as an “Amazing Entry Point.” The suggested entry is around the resistance line in the pattern, currently close to $0.01743.
Trading Plan
Entry:
Enter a long position once JASMY/USDT breaks and closes above the falling wedge resistance line with increased volume. This would be near or slightly above the $0.0175 level, depending on price action confirmation.
Stop Loss:
Place a stop loss slightly below the wedge’s recent support level or just below the most recent swing low at around $0.016 to mitigate risk.
Take Profit Levels:
First Take Profit (TP1): Set around the recent swing high near $0.019.
Second Take Profit (TP2): For a more extended target, aim around $0.0205, where the price previously found resistance.
Final Take Profit (TP3): Around $0.022, aligning with previous higher resistance levels.
Risk Management:
Calculate position size to risk no more than 1-2% of your trading account per trade.
Monitor volume closely, as a breakout with low volume may indicate a false breakout, in which case exiting the trade early could be advisable.
Alternative Scenario:
If the price fails to break the resistance and moves back within the wedge, refrain from entering. In this case, wait for a possible retest of the support level around $0.016 as a secondary entry point.
Summary
Pattern: Falling Wedge (Bullish).
Buy Zone: Above $0.0175, confirmed with volume.
Stop Loss: Below $0.016.
Take Profit Targets: $0.019 (TP1), $0.0205 (TP2), $0.022 (TP3).
btw: VERY GOOD ENTRY POINT AT THE MOMENT!
BITCOIN is the KING and upward movement is highly expected!Technical analysis and trade plan by Blaž Fabjan
Support and Resistance Levels:
Resistance Levels:
72,198.87 USDT
68,556.87 USDT
64,591.15 USDT
Support Levels:
66,333.98 USDT
61,758.48 USDT
60,301.68 USDT
56,902.49 USDT
The key levels indicate potential areas where price action could face resistance or find support, which might serve as entry or exit points.
Indicators:
Wave Cipher Divergences:
Wave Cipher shows divergences suggesting a possible upward momentum. Positive divergences with green dots could imply bullish continuation.
Relative Strength Index (RSI):
RSI currently reads 55.19, indicating a neutral zone, leaning slightly bullish if it moves towards 60. This suggests Bitcoin isn't overbought or oversold and could continue a gradual trend.
Stochastic Oscillator:
The Stochastic shows a value around 70.52, close to the overbought region (above 80). If it breaks further upward, it may signal an overbought state, potentially leading to a correction.
Hull Moving Average (HMA):
HMA appears to trend slightly downwards, showing a bearish trend in the short term. The value of -6.58 indicates a bearish momentum, which may warn of a potential short-term pullback before any significant uptrend resumes.
Price Action:
The chart shows a potential breakout attempt around the 66,333.98 USDT level, where price action previously tested and retraced. A consolidation near this level could suggest that bulls are preparing for an upward push, especially if price breaks above 68,556.87 USDT.
Volume Analysis:
Volume shows a steady, moderate increase, supporting the upward trend. This moderate volume increase without large spikes could imply gradual accumulation rather than distribution.
Trading Plan
Long Position (Bullish Scenario)
Entry: Consider entering a long position if the price breaks and holds above the 68,556.87 USDT resistance level with volume confirmation.
Stop Loss: Set a stop loss slightly below the 66,333.98 USDT support level to mitigate risk in case of a false breakout.
Targets:
Target 1: 72,198.87 USDT — aligns with a strong resistance level and provides a conservative target.
Target 2: 75,553.67 USDT — the next significant resistance level, offering a favorable risk-to-reward ratio.
Short Position (Bearish Scenario)
Entry: Consider shorting if the price fails to hold above 66,333.98 USDT and shows bearish confirmation, such as a breakdown with high volume.
Stop Loss: Set a stop loss above 68,556.87 USDT to avoid risks from potential false breakdowns.
Targets:
Target 1: 61,758.48 USDT — a nearby support level that provides a logical take-profit point.
Target 2: 60,301.68 USDT — serves as a secondary target if the bearish trend strengthens.
Risk Management: Given the proximity to resistance and support levels, using a risk/reward ratio of 1:2 or higher is advisable to maintain favorable trade setups.
Monitor Divergences: Keep an eye on divergences in the Wave Cipher, RSI, and Stochastic Oscillator for potential trend reversals or continuations.
News and Market Sentiment: Be mindful of broader market sentiment and news events, as these can influence Bitcoin's price behavior, particularly near key levels.
This trading plan provides a structured approach to capitalize on potential breakouts or breakdowns, balancing both bullish and bearish scenarios.

Trading opportunity for FLRUSDTBased on technical factors there is a Buy position in :
📊 FLRUSDT
🔵 Buy Now
🪫Stop loss 0.01400
🔋Target 1 0.01800
🔋Target 2 0.02121
🔋Target 3 0.02600
💸RISK : 1%
We hope it is profitable for you ❤️
Please support our activity with your likes👍 and comments📝

TURBOUSDTBINGX:TURBOUSDT.P
If the price can break above the red zone, it can certainly give you a significant profit after the pullback at the two specified prices, the risk-reward ratio will be 1:3.
As simple as this delicious.

1000PEPEUSDTBINGX:1000PEPEUSDC.P
Well, in updating this analysis, I have to add a point that the red range drawn in the 4-hour period caused the price to fall in the previous downward trend, but pay attention to the fact that it formed a higher floor, so most likely, after crossing the red range to On the upper side, we will enter into the purchase transaction in the first pullback and earn a profit of 1:6 risk to reward.
As simple as this delicious.

BTCUSDTBINGX:BTCUSDT.P
With money back, we will go up to the range of 59800-60300 to around 62400, with a risk-to-reward ratio of 1:3.
Important note: Be careful that this is a pressured broken range, and if it fails, we will enter a buy order according to the pattern ahead.
As simple as this delicious.

1000PEPEUSDTBINGX:1000PEPEUSDC.P
The red line is the 4-hour trend, the gray range is the price compression in 30 minutes, if the trend line is broken and the price closes below the green range, you can enter a sell order in pullback, keep in mind that the big red range that It is at the top of the price, it was the 4-hour range, and the price has retraced its money in that time frame, so eventually we will have a decline, according to the previously mentioned conditions.
This is a simple method of chart analysis.

NOTUSDTBINGX:NOTUSDT.P
The specified breakout range, if not fielded, the pullback strategy will cause the price to move up to the specified profit limit.
This is a simple method of chart analysis.

SOLUSDTBINGX:SOLUSDT.P
The specified breakout range, if not fielded, the pullback strategy will cause the price to grow to TP1 and TP2.
This is a simple method of chart analysis.

Bitcoin UpdateOn August 5th, Bitcoin dropped below the 50,000 mark, invalidating a previously established channel. Currently, Bitcoin is testing the 57,000 level. If this test is successful, Bitcoin could rise to the 61,000 level, where it may face a minor retest before continuing its upward trajectory. However, the heavy order concentration and liquidations between the 60,000 and 63,000 levels could present significant challenges.
Optimistic Scenario (Green Arrow):
After navigating the fluctuations above the order block, Bitcoin successfully tests the blue line, confirming support, and continues its upward trend.
Pessimistic Scenario (Red Arrow):
Bitcoin faces substantial resistance within the 60,000 to 63,000 range due to high order activity, leading to a reversal and a potential decline back to the 45,000 level.
