Human Vs Machine : Focusing On One Thing In Trading"HUMANS CANNOT IMITATE MACHINE ABILITY. YOU ARE JUST P-?!?!?!?."
.
.
.
Hey there, fellow Traders! Listen up, 'cause I've got some deep thoughts for you. So, you know how our minds Work, right?.
It's like Focus that Controls everything: how we see things, what we remember, how we learn, how we solve problems, and even how we make decisions. It's like the control center of our Brain!
Now, imagine this: Trading is like a mental marathon, and you need to be mentally fit to win the race. And guess what? Focus is the ultimate key to unlock that mental fitness. Without it, your Trading game will be a total mess. It's like trying to Drive a Car with no steering wheel - you're gonna crash and burn!
But hey, don't worry, it's not all doom and gloom. I've got a joke for you: Why did the Trader lose all his money? Because he couldn't keep his Focus and kept Chasing Shiny Distractions! Ba dum tss!
(no nevermind)
GOING DEEPER AND SERIOUS
Ever wondered why they call it 'focus'? It's because when you focus, you're actually bringing the power of the Universe to converge on a single point in your mind. It's like creating a Black Hole of thoughts that sucks in all your Mental Energy and Compresses it into a laser beam of Concentration.
It's like having a psychic bulldozer that flattens distractions and obstacles in your path, leaving you with a clear mental highway to success. So, folks, let your Mind be the Master of the Universe, and let focus be your Cosmic Superpower in the World of Trading.
AGAINST THOUGHT OVERLOAD
a Thought Overload is like a monkey on caffeine, jumping from one thought to another. It's hard to concentrate when your mind is busy juggling tasks from yesterday, today, and tomorrow. Especially during those long waiting periods when boredom lurks around the corner, your mind craves distractions. So, why not declutter your mind and make it a Zen Master?
Prioritize and structure your day. Give each task its own time slot, and create a special time slot for Trading where you can focus solely on that activity. Say goodbye to irrelevant thoughts that don't serve the task at hand. Keep your mind on a tight leash and don't let it wander off. Remember, less mind clutter equals better Focus, and better Focus leads to Success!
"Life is like a sandwich, the more you add to it, the messier it gets. So, keep it simple, with just the right amount of condiments to savor its taste. Too much, and you'll end up with a soggy mess. Too little, and it'll be a bland experience. Find the perfect balance, and enjoy the deliciousness of life - Me"
MASTERING THE TECHNOLOGY
Technology can be super distracting, you know? Like, you're just trying to focus on your work, but your computer, tablet, and phone keep buzzing and beeping with notifications. Newsletters, voice messages, social media updates, they just keep coming at you like an avalanche. It's like they're all shouting, "Hey, look at me!" It's so hard to resist the urge to check them all the time.
But, here's the thing. If you want to be productive, especially during Trading Sessions, you gotta Minimize those distractions. It's like putting on noise-canceling headphones for your brain. You need to create some boundaries and make those notifications less available. Maybe put your smartphone and tablet on Airplane mode, so you can cut yourself off from the biggest distraction potential. It's like a digital detox for your sanity!
It's kinda funny, though. We live in a world where technology is supposed to make our lives easier, but sometimes it feels like it's doing the opposite. It's like having a super cool gadget that comes with a built-in "distract-o-matic" feature. But hey, we're all in this together, trying to navigate the digital jungle while staying focused on our goals.
So, let's embrace the Awesome potential of Technology, but also be Mindful of its Distractions. Let's put those Notifications on Silent, switch to Airplane Mode, and take control of our Focus. After all, the real "Smart" part of Smartphones and Tablets is the one using them, not the other way around! right?
TRADING LIKE A CHEF, WIZARD, JEDI, AND SORCERER
CHEF : The Secret Sauce of Preparation. Just like a Master Chef preps their ingredients before cooking up a Storm, Successful Traders know that preparation is the key to unlocking their trading prowess. It's like a Secret Sauce that adds Flavor to your performance, giving you an Edge in the Market Kitchen.
WIZARD : The Wizardry of Strategy. Trading is like a Chess game, and your strategies are your moves. But beware, the market is a cunning opponent that's always trying to outsmart you. To win this game, you need to be a Wizard, constantly adapting your strategies and Conjuring up new ones to stay ahead of the game.
JEDI : The Jedi Mind Tricks of Mindfulness. Just like a Jedi, Day Traders need to master the art of mindfulness. It's not just about being present in the moment, but also about using the Force to tap into the Market's energy. Trust your instincts, Read the Signs, and let the Jedi mind tricks guide you to Trading Victory.
SORCERER : The Sorcery of Time Management. Time is the most precious resource in day trading, and successful traders are like sorcerers who know how to wield it. They use spells like FOCUS, discipline, and efficiency to bend time to their will and create a trading kingdom where productivity reigns supreme.
READY FOR BRAIN TRAINING?
There a Cool Exercise to improve your Focus. Grab something interesting to read and set a timer for 30 minutes. But here's the twist: set another timer to go off every five minutes. When it beeps, ask yourself if your mind has wandered. If it has, no worries! Just bring your attention back to what you're reading. This helps strengthen your brain's ability to stay on task and keep your focus sharp, like a ninja!
"Chase your Dreams 🌊✨"
Don't be afraid to dream big, even if your dreams seem far away. We must dare to face challenges, face obstacles, and face uncertainty. We must follow the flow of the waves of life, with determination and perseverance, because it is there that we will find new opportunities and possibilities that we have never imagined before.
ahhh Thank you For Reading, I Love Writing about This, i Hope you Have Something that you Can Learn.
Please Stay Safe and Always Be there to someone you Loved,
Wishyou Profitable Months 😸.
Source Images :
D5000
Gian Cescon
jarmoluk
Image by Freepik
Jan Weber
NWimagesbySabrinaEickhoff
Okx

OKB falls with the help of Expanding Flat(Short term)❗️OKB is moving above the descending channel and near the 🔴 resistance zone($ 47-$ 46.6) 🔴.
In terms of Elliott waves, the rise of OKB to the above descending channel happened with the help of the common Expanding Flat pattern(ABC/3-3-5).
I expect OKB to fall to at least the middle line of the descending channel after breaking the 🟢 support zone($ 46.25-$ 46) 🟢.
OKB Analyze ( OKX:OKBUSDT ), 15-minute time frame ⏰.
Do not forget to put Stop loss for your positions (For every position you want to open).
Please follow your strategy, this is just my Idea, and I will be glad to see your ideas in this post.
Please do not forget the ✅' like '✅ button 🙏😊 & Share it with your friends; thanks, and Trade safe.

BTCUSDTHello to all small and big traders, today I was checking all the empty spaces of CME when I noticed 3 gaps that have not been filled yet, one is in the area of 34000 to 34800, one is in the area of 21000 to 20000 and the other is in the area of 9500 to 10600. It doesn't matter if it is filled, but it must be filled. This plan is for a long-term view. Now or first, we will pay 34,000 dollars, and then the drop and the new floor, and then we will move right at the time of halving for the new ATH, or it will be filled later, whatever the case may be. be careful .

PEPE IS DANGEROUS take carePepe coin , like many other cryptocurrencies, is subject to volatility in its price, which can be affected by a range of factors such as market sentiment, news events, and technical analysis. In recent weeks, Pepe coin has been retesting and consolidating between two key levels, represented by a red line and a green line on the chart. This consolidation suggests that buyers and sellers are in a state of equilibrium, which could lead to a potential rise in price if the balance tips in favor of the buyers.
If Pepe coin breaks out of this consolidation range and moves above the red line, it could signal a bullish trend and attract more buyers into the market. This increased demand could drive up the price of Pepe coin, potentially leading to a surge in value. However, it's important to note that cryptocurrency markets are highly unpredictable and investors should always exercise caution and do their own research before making any investment decisions.

$OKX:LTCBTC - 4.2 R;R OKX:LTCUSDT halving is close and NYSE:LTC could overperform OKX:BTCUSDT in next period . A R;R ratio of 4,2 for this trade

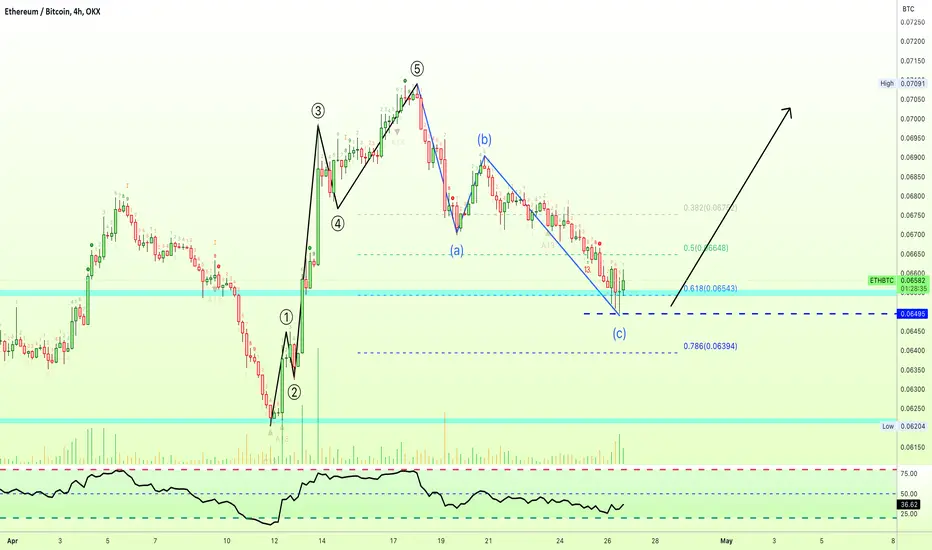
✳️ Ethereum vs Bitcoin & Elliot Wave Theory | #OKXIdeasHere we have a chart for ETHBTC with a perfect Elliot Wave sequence... Let's dive into it!
- First, we have a 5-Up Wave pattern, it starts 11-Apr. and peaks 18-Apr.
- Second, we have a perfect Zig-zag or ABC correction.
(Notice that this correction ends right at the 0.618 Fib. retracement level with a Doji, EW is big on Fib. proportions. This is also supported by increasing volume and a bottomed out RSI).
We have the perfect 5-Up and then the ABC... What follows, is a new impulse based on EW.
This setup is invalidated on a close below the 26-Apr. low.
This is not financial advice.
Thank you for reading and for your continued support.
Namaste.
✴️ Cronos Starts To Recovery (333%- 700%+ Potential) | #OKXIdeasPlease, allow me to share with you another chart that is showing huge potential for growth; Cronos (CROUSDT).
This one hit bottom November 2022, right on this date we can see a massive increase in trading volume.
Volume hadn't move strongly since a year before in November 2021.
We can see the same pattern as repeated across the Altcoins market.
✔️ The initial breakout in January followed by a peak in February, then a correction that ends mid-March and now the resumption of the bullish trend...
We can say that the probabilities are high for the bullish trend to resume going back to the volume signal. Today we have the highest volume in months... This is supported by a strong RSI.
There are many resistance levels along the way, many targets on the way up.
Here I am mapping a potential mid to long-term ranging from 333% to 700%+.
This is not financial advice.
Remember to do your own research, your own planning.
Thanks a lot for reading.
Thank you for your continued support.
Namaste.

✴️ Ethereum Weekly, Keeping It Simple | #OKXideasWe always say simple is best... If you can't explain something in a simple matter, then it is likely that you do not understand it well enough.
Yesterday I shared a trade idea for Bitcoin looking at multiple timeframe. The weekly signal which revealed that Bitcoin was still bullish was the fact that it continued to trade above EMA50 as well as EMA10.
Now we get into Ethereum and we can see the exact same.
Weekly prices continue safely trading above EMA50 and EMA10.
As long as ETHUSDT is trading above these levels, magenta and green lines on the chart, we know the bulls are ahead.
This is the easiest I can make it but we can support this signal with more.
The RSI is at 59, which is super strong.
Notice the marked candle, "6-Mar Doji", this is a strong reversal signal and definitely points to a higher high, it supports the bullish sentiment and strong RSI.
Ethereum bottomed in June 2022... Almost a year ago.
We are already in a bullish trend... Corrections and retraces are a normal part of the market action, we can use them as breaks.
When red/support/low we can buy and hold.
When green/resistance/high we can sell and wait.
Ethereum is showing potential for additional growth.
This potential is only invalidated on a weekly close below EMA10, EMA50 and EMA21 (1690 - 1800).
Namaste.

✴️ Cardano: Look Closer, The Potential is Huge | #OKXideasLet's go back to Cardano because this is one chart, one Altcoin, one pair that looks really good... Let's focus on the bigger picture and not just the short-term.
Notice on the left side of this chart, the black downtrend line... It has been broken.
When a trend is over, ends, a new trend develops.
As the bearish trend is over, a new bullish trend takes place.
Now, a bullish trend is not just one high or some growth for a few weeks or months... A bullish trend is defined by sustained higher highs and higher lows.
What this means is that we are set for growth.
Once we hit bottom, the only place left to go is up.
Cardano did hit bottom... We are very happy to see it recover and grow.
Namaste.

OKB/BTC in ascending triangleOKB is a utility token from OKX exchange.
With it, it is possible to have discounts on trading fees and passive income in DeFi/CeFi.
On the chart we have an ascending triangle about to be broken.

OKB analysis: expecting wave 5 🚀Hello, in this post I will share a detailed analysis of OKB.
🛠️ OKB is a utility token from OKX exchange.
With it, it is possible to have discounts on trading fees and passive income in DeFi/CeFi.
OKX is one of the largest CEX (Centralized Exchange).
📆 Previously on August 2, 2022, I had already analyzed this token, but in the BTC quote:
As seen, the Fibonacci target of 1,618 has already been reached.
Now the next target is on projection 2, copying the same height as the triangle below.
🟢 Going back to the USDT quoted chart, reducing the timeframe to 1 day, we have a symmetrical triangle.
Price broke above the triangle, and performed a throwback, allowing for an entry.
That said, we have a bullish bias for this asset.
🌲 So far we've analyzed the tree.
Let's analyze the forest.
Comparing the 1-year performance of the main exchanges plus BTC:
Which shows that the token is above average.

🅱️ Bitcoin Multiple (4H, Daily & Weekly) Timeframes | #OKXIdeasThe question is simple: Will Bitcoin continue lower or is the correction over?
Let us see what the chart has to say on multiple timeframes.
We start with BTCUSDT 4H (short-term)
Notice the volume 19-Apr. High bear volume.
21-Apr lower low yet lower volume and Doji.
24-Apr lower low yet bear volume continues to decrease. The session ends in a Doji, green.
So, when we see new lows being hit yet the volume starts to decrease, it means the trend is losing strength, in this case the bearish trend.
The current action is happening above the 3-Apr. low (bullish).
Prices moving above EMA10 and RSI moving up after hitting weak/oversold (bullish).
Let's move to the daily timeframe.
The correction is ultra-weak, why? There is no volume/bear volume is low.
BTCUSDT is trading above 0.382 Fib. retracement short and mid-term which is a signal of strength.
Yesterday's session is a Doji after a new low which is an indecision candle. Indecision after prices moved lower can mean that the market is not sure if continue lower or change.
As long as Bitcoin stays above 26,650 daily the bears are weak, the probabilities favor the bulls, consolidation or the resumption of the uptrend.
If the above mentioned level is compromised the correction can extend.
Another bullish signals comes from the Altcoins but that is a bit too much for many so let's continue with the weekly timeframe.
This is a pretty interesting chart, we will focus on the technicals.
Thanks a lot for your continued support.
I can come up with a million different stories and with all sorts of conclusions looking at these charts but the basics, keeping it simple, always works best.
BTCUSDT trades above EMA10 weekly (26688). As long as the price stays above this level, the bulls are in full control.
This is supported by a long lower wick on the current session, a strong RSI and the bigger picture that we've been tracking for many months.
Conclusion
Back to the initial question: Will Bitcoin continue lower or will it move up?
The charts are bullish and pointing higher.
We say Bitcoin goes higher unless the charts change of course.
There is plenty of room/space for Bitcoin to correct, but looking at the short-term, we are more than safe above 25,000 and 26K.
I can expand but this should be good for a few days...
We can focus on the bigger picture next time.
This trade idea is done for you!
#OKXideas...
Namaste.


SHIB Back To Previous Support | 50% Profit PotentialSHIB is looking beautiful on the daily timeframe! The price is currently moving within a symmetrical triangle. The past month, the price has been accumulating in an ascending triangle, pointing toward a breakout as soon as the daily price action closes above the 0.00001200 level.
The profit potential is ~50%, with the price climbing to the previous high as well as the previous support, which now might act as a resistance.

Over 10000% Increase In 4 Years? | Bull Market Yet To ComeIt seems like exchange tokens such as Binance's BNB, the MX token from MEXC Global, or OKB from OKX. All of them seem to perform very well, no matter where to rest of the market is heading. This is mainly due to the fact, that each of these tokens is the heart of the cryptocurrency exchange. Promotions, events, and even the salary of the employees are often paid in the said token.
Binance is a perfect example of scaling a business in parallel to increasing the price of their tokens, for example with the help of burns and a fee reduction while using BNB. The same approach is common for other exchanges too.
Another interesting perspective is marketing. Especially on YouTube, you will so a high appearance of these exchanges. Their business model is very simple,
users generate fees by placing their orders. A cut of the fee (usually ranges from 30% - 70%) is for the friend, that referred the trader. The remaining amount is mainly profit. With increasing activity - hence increasing volume - there's more profit to make. And more money to put towards expansion.
Having one of these tokens in your long-term portfolio definitely makes sense, even though some of us have issues with trusting an exchange after the most recent events surrounding FTX. Nonetheless, there are some candidates that have a proven track record of successfully growing their market share. According to that, you can observe price increases such as the one we're looking at in this idea.
Feel free to do your own research and pick the best one. There are almost 700 different exchanges nowadays (with more to come). You can even build your own portfolio based on this kind of investment.

OKX Coin Weekly ChartHello traders,
OKX is a cryptocurrency exchange the third biggest cryptocurrency exchange by trading volume serving over 20 million people globally.
Currently cryptocurrency is just going up everyone try to enter in the market and make some profits but i am pretty much sure that one drop is coming in all cryptocurrency before move up.
OKX is setting up for a potential 100% gain, watch price to drop and look for a buy opportunity around 25 to 19 price levels.
This is just analysis, not the exact trade or any kind of signal that proven with wining or losing % so be sure trade with your own according strategy do not depend on my analysis.
I wish you good luck and good trading.

btc/usdtthis line is so powerfull we will see a big drop if we break it its win win cuz i all in 17k if we rejeckt that line it will be liq grab also huge rejection next 10 days it will be green but its so hard to breake 31.5k

Coreusdt longed My trade on coreusdt gartley pattern in formation trying to take long to D
SL mentioned in chart

ETHUSDT - 3 price points that it will go to.
OKX:ETHUSDT is at a daily resistance level
Move 1: Price rejects resistance, moves down to 1560 to retest support zone
Move 2: Price rejects resistance, moves down to 1769 to retest minor support before bouncing back up. Targeted TP at 2160
Move 3: Price breaks resistance to 1990 (Week resistance), retrace to 1933 before making its way up to final TP at 2160/
Entry Tf: 1 hour
Entry style: Breakout with confirmation, or Breakout during volume period, or Breakout with news
Enter after price moves. Don't predict.


This FIB settings work for me 8/10 of the timeI've been using Price action and SnD levels to scalp / day trade for the past 6years, and FIbs are one of my favourite tool to use on the Day and 4 hour time frame , to gauge the possible short term movement.
Fibs Values: Only the first 5 boxes, right and left
1st pair: 0 <> 0.236
2nd pair: 0.382 <> 0.618
3rd pair: 0.764 <> n/a
4th pair: 1 <> -0.25
5th pair: -0.618 <> 0.5
Feel free to copy my Fibs values. Match it to the fibs on the OKBUSDT chart to check for accuracy. Let me know in the comment if it works for you as well!
Happy trading!

ETHEREUM GOES UP! OKXIDEASEthereum is below new resistance, it could continue as high as 2168 USDT after breaking the 1940 USDT resistance.

INTUSDT technical Analysis From technical analysis wise, a clear breakout from a falling wedge on W & 3D frames, it is retesting, I think it will make 10x from here.
According to INTchain twitter account: “The INT Chain Foundation officially announced that it will conduct in-depth research and expansion on AIGC and ChatGPT related technologies, with an ever-changing pace, profoundly, quickly, and thoroughly changing the existing IoT chain model.”
That’s BULLISH but you need to keep in mind the following.
1- It’s a small cap project with huge potential but with a low liquidity “ manage your risks”
2- Take profit along the way and enjoy.
Good luck
