OM / USDT : Breaking out from Trendline resistanceOMUSDT has broken above a descending trendline on the 4H timeframe after multiple rejections in recent weeks. This breakout could signal a shift in momentum from bearish to bullish.
If price holds above the breakout level around 0.262, the next potential target lies near 0.31, representing an estimated 19% upside from current levels.
Key points:
Timeframe: 4H
Setup: Descending trendline breakout
Breakout level: ~0.262
Target: ~0.31 (+19%)
Stop loss: Below breakout level to manage risk
As always, wait for confirmation and manage risk appropriately before entering a trade.
Omusdtlong

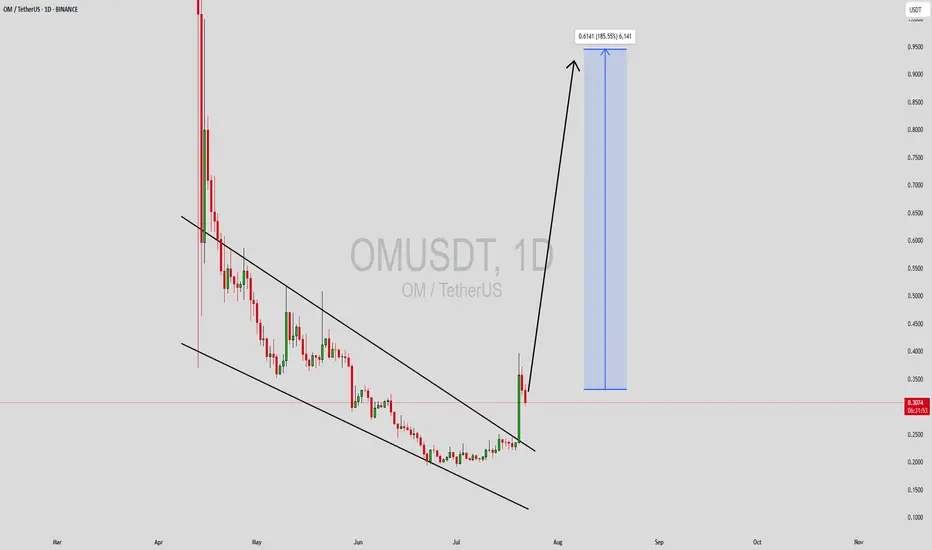
OMUSDT Forming Descending ChannelOMUSDT is exhibiting a classic descending channel pattern, often viewed as a bullish reversal signal when accompanied by strong support levels and rising interest. The asset has been consolidating within this downward-sloping channel, and the current price action shows signs of coiling for a potential breakout to the upside. The good trading volume further validates this setup, hinting that accumulation is likely taking place beneath the surface. If the breakout confirms, a powerful move of 140% to 150%+ could be on the horizon.
The OM token, which powers the MANTRA ecosystem, is gaining traction among long-term holders and traders alike. With increasing attention toward decentralized finance and staking infrastructure, OM is benefiting from renewed optimism in this sector. Technical indicators on multiple timeframes align with the bullish scenario, especially if price action continues to respect the support trendline while testing resistance zones.
Traders are eyeing key breakout levels near the upper boundary of the channel, and a close above it could trigger aggressive buying. As this happens, the potential for a parabolic rally becomes significantly more likely. Keep an eye on volume surges and momentum indicators like RSI or MACD to catch early signs of this move materializing.
✅ Show your support by hitting the like button and
✅ Leaving a comment below! (What is You opinion about this Coin)
Your feedback and engagement keep me inspired to share more insightful market analysis with you!
OM/USDT: what happened?Hello friends
Due to the heavy price drop, many holders of this currency fell into extreme fear, but according to the price chart, you can see that after this stunning growth, the price correction should finally happen.
Now, if you are risk-averse, you can buy in steps within the specified support areas and move with it to the specified targets, of course, with capital and risk management.
*Trade safely with us*

Breaking: MANTRA coin ($OM) Nosedived Nearly 100% Today MANTRA, a Security first RWA Layer 1 Blockchain, capable of adherence and enforcement of real world regulatory requirements that is Built for Institutions and Developers, offering a Permissionless Blockchain for Permissioned applications saw its native token Mantra Coin ( CRYPTOCAP:OM ) plummeted 94% today amidst falling out of a bearish symmetrical triangle.
The bloodbath came as a shock as days ago it was sitting on a market cap of $6 Billion and major deals were iterated, including a $1 Billion tokenization pact with DAMAC.
However, the main trigger was an allegedly suspicious 3.9M CRYPTOCAP:OM deposited (linked to team wallets) to OKX, fueling sell-off fears.
Key Allegations
Team controls ~90% supply – raising manipulation concerns.
Undisclosed OTC deals – tokens reportedly sold at 50% discounts.
Exchange liquidations – forced closures worsened the crash.
However, Binance CEO Said:
"OM CRYPTOCAP:OM 90% price crash was due to massive cross-exchange liquidations, tokenomics changes, and large token dumps".
In response to an X post, the Mantra team said:
"we want to assure you that MANTRA is fundamentally strong. Today’s activity was triggered by reckless liquidations, not anything to do with the project. One thing we want to be clear on: this was not our team. We are looking into it and will share more details about what happened as soon as we can."
Technical Outlook
As of the time of writing, CRYPTOCAP:OM is down 28.6% according to the 4 hour price chart. the asset is showing signs of a reversal but the diamond hands are weak prior the extreme token sell-off as hinted by the RSI at 11.51, this is extremely oversold with a possible reversal lurking around the corner, should the team figure out the cause of the bloodbath, CRYPTOCAP:OM might reclaim $1 zone and then possibly the $5 price point.
With the market cap presently $697 million, CRYPTOCAP:OM has enough strength for a bounce back after the mainstream crypto market might have digest the news.
MANTRA Price Live Data
The live MANTRA price today is $0.719974 USD with a 24-hour trading volume of $2,499,155,492 USD. MANTRA is down 88.55% in the last 24 hours. The current CoinMarketCap ranking is #81, with a live market cap of $697,898,136 USD. It has a circulating supply of 969,337,399 OM coins and the max. supply is not available.

OMUSDT – Strength Amid Market WeaknessWhile the broader market sentiment remains weak, OMUSDT stands out with its relatively positive data and resilience. This kind of divergence often signals underlying strength—and in such cases, hedging with a long position can be a wise move when conditions align.
📌 Key Observations:
Positive Relative Strength: Despite the general downturn in the market, OMUSDT shows signs of stability and strength, which can often precede an isolated bullish move.
Blue Box Importance: The marked blue box represents a strong area of interest. If price consolidates here and gives valid lower time frame confirmations, it could serve as a launchpad for a long position.
Hedging Perspective: In uncertain market conditions, strategic long setups like this can act as a hedge against broader downside risk, especially if risk is defined and entry is confirmation-based.
🧠 Smart Execution Plan:
Wait for LTF Confirmation: Do not rush. Let the price show strength inside the blue box, such as reclaiming key micro-levels with supportive volume.
Monitor Market Conditions: If the broader market turns, OMUSDT could outperform. Inversely, if the whole market sinks harder, a tight stop protects your downside.
Adjust Quickly if Conditions Flip: If price breaks down the blue box with high momentum and fails to reclaim, the idea is invalid. We don't hold hope—we trade facts.
I don't trade based on guesses. Every level you see is placed with professional precision based on carefully tested metrics. That’s exactly why my profile reflects one of the highest success rates around. I only trade setups that make statistical sense—and I always teach my followers to trade like professionals, not gamblers.
Stick with the data. Stick with confirmation. Stick with me if you want to trade like a pro.
📌I keep my charts clean and simple because I believe clarity leads to better decisions.
📌My approach is built on years of experience and a solid track record. I don’t claim to know it all but I’m confident in my ability to spot high-probability setups.
📌If you would like to learn how to use the heatmap, cumulative volume delta and volume footprint techniques that I use below to determine very accurate demand regions, you can send me a private message. I help anyone who wants it completely free of charge.
🔑I have a long list of my proven technique below:
🎯 ZENUSDT.P: Patience & Profitability | %230 Reaction from the Sniper Entry
🐶 DOGEUSDT.P: Next Move
🎨 RENDERUSDT.P: Opportunity of the Month
💎 ETHUSDT.P: Where to Retrace
🟢 BNBUSDT.P: Potential Surge
📊 BTC Dominance: Reaction Zone
🌊 WAVESUSDT.P: Demand Zone Potential
🟣 UNIUSDT.P: Long-Term Trade
🔵 XRPUSDT.P: Entry Zones
🔗 LINKUSDT.P: Follow The River
📈 BTCUSDT.P: Two Key Demand Zones
🟩 POLUSDT: Bullish Momentum
🌟 PENDLEUSDT.P: Where Opportunity Meets Precision
🔥 BTCUSDT.P: Liquidation of Highly Leveraged Longs
🌊 SOLUSDT.P: SOL's Dip - Your Opportunity
🐸 1000PEPEUSDT.P: Prime Bounce Zone Unlocked
🚀 ETHUSDT.P: Set to Explode - Don't Miss This Game Changer
🤖 IQUSDT: Smart Plan
⚡️ PONDUSDT: A Trade Not Taken Is Better Than a Losing One
💼 STMXUSDT: 2 Buying Areas
🐢 TURBOUSDT: Buy Zones and Buyer Presence
🌍 ICPUSDT.P: Massive Upside Potential | Check the Trade Update For Seeing Results
🟠 IDEXUSDT: Spot Buy Area | %26 Profit if You Trade with MSB
📌 USUALUSDT: Buyers Are Active + %70 Profit in Total
🌟 FORTHUSDT: Sniper Entry +%26 Reaction
🐳 QKCUSDT: Sniper Entry +%57 Reaction
📊 BTC.D: Retest of Key Area Highly Likely
📊 XNOUSDT %80 Reaction with a Simple Blue Box!
📊 BELUSDT Amazing %120 Reaction!
I stopped adding to the list because it's kinda tiring to add 5-10 charts in every move but you can check my profile and see that it goes on..


#OM/USDT#OM
The price is moving in a descending channel on the 1-hour frame and is adhering to it well and is heading to break it strongly upwards and retest it
We have a bounce from the lower limit of the descending channel, this support is at a price of 5.92
We have a downtrend on the RSI indicator that is about to break and retest, which supports the rise
We have a trend to stabilize above the Moving Average 100
Entry price 6.27
First target 6.66
Second target 6.97
Third target 7.41

OM/USDT : Do you know what is going to happen?hello guys
As you can see, this currency has strong spikes...
Now, according to the latest spike, we have identified good support ranges for you to buy step by step and move with it until the specified goals, of course, with capital management...
*Trade safely with us*

#OMUSDT – Critical Breakout Zone📊 BYBIT:OMUSDT.P is consolidating after a strong impulse move, trading near POC ($7.5915), indicating liquidity accumulation. The price is currently trapped in a tight range, suggesting an imminent breakout in either direction.
Recent high volumes indicate strong participation from major players. The question remains—will buyers push the price higher, or will sellers take control and drive it down?
⏱ 1H Timeframe
✅ Overview:
➡️ BYBIT:OMUSDT.P remains in a tight consolidation zone between resistance $7.8215 and support $7.3820.
➡️ POC ($7.5915) marks the high-volume area, making this range critical for the next move.
➡️ Price action within this zone may continue until a confirmed breakout occurs.
━━━━━━━━━━━━━━━━━━
⚡ Long Plan:
➡️ Enter long above $7.8215 after a strong breakout and confirmation.
➡️ Stop-Loss at $7.7480—below the consolidation range.
🎯 TP Target:
💎 TP1: $7.9435
━━━━━━━━━━━━━━━━━━
📉 Short Plan:
➡️ Enter short below $7.3820 after confirming weakness.
➡️ Stop-Loss at $7.4740—above the nearest resistance.
🎯 TP Targets:
💎 TP1: $7.2595
💎 TP2: $7.1592
📢 If the price confirms a breakout above $7.8215, an upside move to $7.9435 is likely.
📢 Conversely, a breakdown below $7.3820 could lead to $7.1592.
🚀 BYBIT:OMUSDT.P is poised for a breakout—watch volume and direction closely!

OM/USDT Surges After Breakout: Next Stop $5?OM/USDT is showing strong bullish momentum after breaking out from the descending trendline, indicated by the red line. The price has recently made a sharp upward move and is currently trading above the support trendline, which suggests that the uptrend could continue.
The price consolidated within the grey zone for a while, and after breaking above this, it surged higher, pointing to strong buying interest. The recent breakout indicates that we could see further upward movement toward the next resistance levels.
The next potential target for OM/USDT is around the $5.00 level, with support from the trendline and previous breakout zones providing a solid base for the rally.

#OMUSDT Expecting further upside momentum📈 LONG BYBIT:OMUSDT.P from $6.2310
🛡 Stop Loss: $6.1400
⏱ 1H Timeframe
✅ Overview:
➡️ BYBIT:OMUSDT.P is showing strong bullish momentum after breaking above $6.1965, confirming buyer strength.
➡️ The price is now above a key level, which could act as a support for further movement upward.
➡️ The main target for this move is $6.4600, a significant resistance level.
➡️ POC at $5.8242 suggests that major liquidity was accumulated below, reinforcing the bullish outlook.
➡️ Increasing volume indicates strong buying pressure, which supports further upward continuation.
⚡ Plan:
➡️ Enter LONG from $6.2310 if the price holds above this level.
➡️ Risk management with Stop-Loss at $6.1400, to protect against false breakouts.
➡️ Main upside target:
🎯 TP Target:
💎 TP1: $6.4600 — key resistance zone for potential profit-taking.
🚀 BYBIT:OMUSDT.P Expecting further upside momentum!
📢 BYBIT:OMUSDT.P If the price stays above $6.2310, further upside towards $6.4600 is expected.
📢 However, if the price drops below $6.1400, a pullback or range-bound movement could occur.

OMUSDT 1DOM ~ 1D
#OM If you pay attention to this chart, this chart is synonymous with accumulation by big players. If you have Conviction on this coin. Buy from here with a target of 20%++


Buyer Zone Anticipation OM is the strongest altcoin during the decline. A good buying area.
Good luck.

OM to uptrend and squeeze leveraged shorts? See the liquidation levels for the leveraged shorts within this coinglass chart. (Coinglass , Liquidation heatmap OMUSDT). You'll be pleasantly suprsed for what's in store 😏
We have a bullish divergence forming on the 15min and as long as BTC mellows or uptrends we will see this play out. :)
Exited my S
SUN, TNSR, & BTC to enter this trade full in! 🚀

Cage Cycle Values for OmusdtCage Cycle Values: If the price is above 0.67647 (Buy Point), the price target is 1.13913, and if it is below 0.66245 (Sell Point), the price target is 0.19979. You can find the details of the Cage Cycle strategy attached. (MAKE SURE TO FOLLOW THE NEW TAKE PROFIT POINTS PUBLISHED AS TAKE PROFIT POINTS ARE INCREASED ACCORDING TO THE TRADING CYCLE)
Long Position:
Entry: 0.67647
Profit: 1.13913 (Will be updated if necessary in the positive direction)
Stop: 0.66245
Short Position:
Entry: 0.66245
Profit: 0.19979 (Will be updated if necessary in the positive direction)
Stop: 0.67647
The Cage Cycle Strategy is a model that emerges from analyzing approximately 2 over 20 data points (1,000,000 and above tick data). The price definitely reaches one of the specified Take Profit Points as a price target. It is not possible to determine the direction with a hundred percent certainty in financial markets. Therefore, success rates are attempted to be increased by using certain models. The Cage Cycles end when the price reaches the price target in any direction in the Cage Cycle Strategy. Although it is not an investment advice, an example of use is as follows: A Long position is opened at the price level of 0.67647, the Stop Loss is 0.66245, and the Take Profit is 1.13913. When the price reaches 0.66245, instead of the Long position that was stopped, a Short Position is opened, with the Stop Loss of the Short Position being 0.67647 and the Take Profit being 0.19979. Transactions are monitored by stopping until the market direction is determined. Considering the number of stopped transactions and the expected time, Take Profit points are updated to increase profits (Updated Take Profit Points will never be lower than the initially specified Take Profit points). By recalculating the Take Profit points to increase profits, the aim is to compensate for the losses of the stopped transactions when the Cage Cycle ends. In the data analysis of the last 10 years, the average number of stops is 12, and the highest number of stops is calculated as 83 (These figures may vary in the future). Although it is not an investment advice, in the Cage Cycle, if the amount to be stopped is set at $1, by increasing the position by half of the initial lot amount for every 10 stops (0.5 $ for every 10 stops), a higher profit can be targeted along with the increased Take Profit point. Using the Cage Cycle data provided above as an example for Peopleusdt, after 15 stops, when the cycle ends, the profit-loss calculation (Initial Stop Amount to be stopped is $1): For the first 10 stops, the loss will be 10$*1=10$, and between 10 and 15 stops, the loss will be 5*1.5$= 7.5$, resulting in a total loss of 17.5$. The profit to be obtained with the updated Take Profit points will be 1.5*27= 40.5$. The net profit, excluding commission, will be 40.5-17.5= 23$. The Cage Cycle helps you determine the Take Profit point in your own trades as well, as it is known that the price will definitely reach one of the Take Profit points. Enjoy and Good luck with your trades.
THIS IS NOT AN INVESTMENT ADVICE. Made by Yourcages

OMUSDT 1WOM ~ 1W
#OM A very promising token from Chart's view. New TSX:ATH will continue to form from here.

OM/USDT - MANTRA DAO: BBand Breakout◳◱ On the $OM/ CRYPTOCAP:USDT chart, the Bband Breakout pattern suggests an upcoming trend shift. Traders might observe resistance around 0.78787 | 0.84973 | 1.01416 and support near 0.62344 | 0.52087 | 0.35644. Entering trades at 0.82171 could be strategic, aiming for the next resistance level.
◰◲ General info :
▣ Name: MANTRA DAO
▣ Rank: 152
▣ Exchanges: Binance, Kucoin, Bybit, Gateio, Hitbtc
▣ Category/Sector: Financial - Lending
▣ Overview: None
◰◲ Technical Metrics :
▣ Mrkt Price: 0.82171 ₮
▣ 24HVol: 47,110,666.812 ₮
▣ 24H Chng: 19.884%
▣ 7-Days Chng: 22.15%
▣ 1-Month Chng: 167.86%
▣ 3-Months Chng: 1087.69%
◲◰ Pivot Points - Levels :
◥ Resistance: 0.78787 | 0.84973 | 1.01416
◢ Support: 0.62344 | 0.52087 | 0.35644
◱◳ Indicators recommendation :
▣ Oscillators: NEUTRAL
▣ Moving Averages: STRONG_BUY
◰◲ Technical Indicators Summary : STRONG_BUY
◲◰ Sharpe Ratios :
▣ Last 30D: 5.50
▣ Last 90D: 5.55
▣ Last 1-Y: 2.76
▣ Last 3-Y: 0.81
◲◰ Volatility :
▣ Last 30D: 2.21
▣ Last 90D: 2.18
▣ Last 1-Y: 1.37
▣ Last 3-Y: 1.44
◳◰ Market Sentiment Index :
▣ News sentiment score is N/A
▣ Twitter sentiment score is 0.65 - Bullish
▣ Reddit sentiment score is N/A
▣ In-depth OMUSDT technical analysis on Tradingview TA page
▣ What do you think of this analysis? Share your insights and let's discuss in the comments below. Your like, follow and support would be greatly appreciated!
◲ Disclaimer
Please note that the information and publications provided are for informational purposes only and should not be construed as financial, investment, trading, or any other type of advice or recommendation. We encourage you to conduct your own research and consult with a qualified professional before making any financial decisions. The use of the information provided is solely at your own risk.
▣ Welcome to the home of charting big: TradingView
Benefit from a ton of financial analysis features, instruments and data. Have a look around, and if you do choose to go with an upgraded plan, you'll get up to $30.
Discover it here - affiliate link -

Om/Usdt Plan Based on the 4-hour timeframe chart, the Om/Usdt price appears to be breaking out of a triangle pattern with a notable increase in trading volume. If this breakout is confirmed and sustained, it could potentially signal the beginning of a strong bullish rally in the near future. However, it is important to note that this information is for educational purposes only and should not be considered financial advice. It is always recommended to conduct your own research (DYOR) before making any investment decisions.


