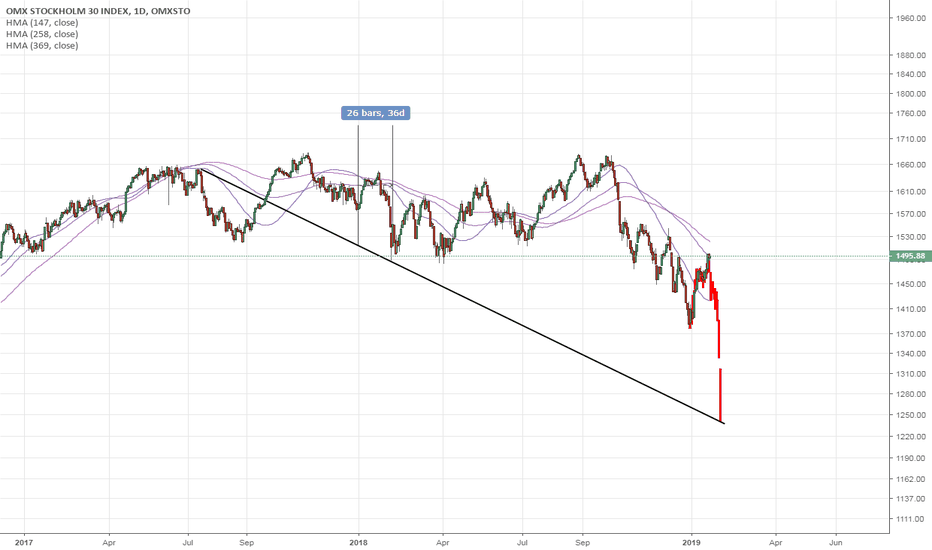
Omxs30
Updated "OMXS30 the coming days"This is the updated idea regarding OMXS30 the coming days. I moved the waves one step forward (incorrect wave-counting) and increased the area where the reversal could happen(the new area takes into account a couple of swing-highs). This is because other indices have already reached fib 0.618.
OMXS30 - Building up Bull divNot advice. Just an observation. MACD keeps making higher lows, price making lower lows. I would say longing OMXS30 soon for easy 50-60 pips would be a safe bet. Take partial profit and wait for either rejection or confirmation before further sales. Keep in mind a similar fake-out could happen as dec 3rd.
Not advice. Just an idea based on patterns and divergences.
SP500, Similar fractals, Is this the comming financial crisis?
Hi folks, this is my first time posting an idea/"short" analysis publicly, hope you'll enjoy it
This is the chart from SP500, I mirrored 2007 financial crisis structure, unedited, raw and pure, pasted it below our chart, checked the fractals/similarity, and it's deadly alike.
With the somewhat positive sentiment from OPEC and 90 Days truce between president Xi Jinping and Donald Trump we have something that might bring the SP500 back to "normal" comming weeks, months.
Once the truce resolves, I bet we'll get into a "fear" phase... Nothing is new in the stock market... said J Livermore... and I concur.
Not sure of how it was back in 2007, but perhaps some of you older folks remember what caused the "back to normal" phase... and we can compare...
Stay safe or play it safely folks.
cdn-images-1.medium.com
OMX30 Strong Bullish Divergence on D/H4 Nov 28 2018Clear, strong bullish divergence is visible on the daily and H4 timeframe, seen in two waves.
Price is in extended bearish territory with expanded bearish Kumo Clouds. Trend
followers will have to wait for entry until a buy signal appears by the Ichomku, while
traders using divergence has a golden opportunity to enter long, scale in or increase
periodical purchases right now.
Ideally, one would wait for a slight pull back from here, but for medium and longer term
holders, this wouldn't be needed.
OMXS30 Monthly - Yet another scary looking chartBottoms show a resistance (blue, striped line).
Red shows a bearish triangle forming. If coming true, target would be around 840-850 around the year 2020/21.
Pink show's bearish target.
Current uptrend (monthly) shown with Inside Pitchfork (started in beginning of 2009). There is also a chance we continue going up, but remember: What goes up also comes down.
Orange striped line from peaks of both past financial crisis' show another resistance.
Stay safe, comments welcome :)
OMXS30, 4H - Potential Shark patternOMXS30 continues to be bullish and are looking to face two resistance levels ahead.
First one is at the level of "X" in the pattern, wich is strong nut we Do see some tests just above lining up with the top of the Sharks PRZ.
Expected reaction from the Shark is a 38.2% Fib, but often we can see a pullback down to 50% where w, in that case, have a 5-0 pattern comming up.
Interesting time ahead for the Swedish OMXS30.
$LUPES (Large Cap OMX Stockholm) trend continuationLundin Petroleum spiked up today with a nice bullish runway gap, proving there is more to expect.
The stock is trading well over both MA50 and MA200.
Close to oversold but a first target would be gap close from february 2013 @ 164.


