#ONDO/USDT#ONDO
The price is moving in a descending channel on the 1-hour frame and is adhering to it well and is heading to break it strongly upwards and retest it
We have a rebound from the lower limit of the descending channel, this support is at a price of 0.7550
We have a downtrend on the RSI indicator that is about to be broken and retested, which supports the rise
We have a trend to stabilize above the moving average 100
Entry price 0.8180
First target 0.8890
Second target 0.9588
Third target 1.034
ONDOUSD

#ONDO/USDT #ONDO
The price is moving in a descending channel on the 1-hour frame and sticking to it well
We have a bounce from the lower limit of the descending channel, this support is at a price of 1.25
We have a downtrend on the RSI indicator that is about to be broken, which supports the rise
We have a trend to stabilize above the moving average 100
Entry price 1.42
First target 1.51
Second target 1.64
Third target 1.76

ONDOUSDT 1DONDO ~ 1D Analysis
#ONDO Buy gradually in this support block. with a short -term target of at least 15%+.

BlackRock and ONDO Pioneer Real World AssetsBlackRock has initiated strategic expansion into the Real World Assets (RWA) sector, with preliminary allocations to its BUIDL fund signaling active preparation for tokenization initiatives. Supporting evidence includes documented transactions, which underscore early-stage operational readiness for asset digitization. A detailed analysis of these deals can be found below.
Concurrently, the upcoming crypto summit, featuring participation from a White House representative of ONDO, highlights growing institutional and governmental engagement with digital asset frameworks. This development suggests alignment between public-sector policy and private-sector innovation, reinforcing the potential for regulatory advancements in tokenization.
Such coordinated activity underscores a broader trend toward integrating blockchain-enabled solutions into traditional financial infrastructure, with industry leaders and policymakers collaboratively exploring scalable applications of decentralized technologies.
Alex Kostenich,
Horban Brothers.

ONDOUSDT 1DONDO ~ 1D Analysis
#ONDON Buy after successfully penetrating this resistant line with a short -term target of at least 15%+.
ONDO FINANCE (EXPERIMENTAL)Institutional-Grade Finance, Now Onchain.
LSE:ONDO is building the next generation of financial infrastructure to improve market efficiency, transparency, and accessibility.

ONDO appears to have a bright future ahead!ONDO is a favorite cryptocurrency of many investors and traders alike. The entire crypto market has been dragged down since December after the massive gains from the "Trump election pump" caused many cryptos to go ballistic. However, the future looks bright for ONDO, as the current weekly chart suggests it's setting up for another leg up.
Good luck, and always use a stop-loss!

$ONDO Back In Buying Territory - NEW ATHs on Q2ONDO is back in this buying zone.
I’ve been waiting to fill the wick, and it’s in the process—at least for 50%.
Stronger bids are sitting around 95 all the way down to 92, where I expect the price to trade above.
Should have plenty of time, as I see this consolidating until the end of April, so no rush.
LSE:ONDO BYBIT:ONDOUSDT

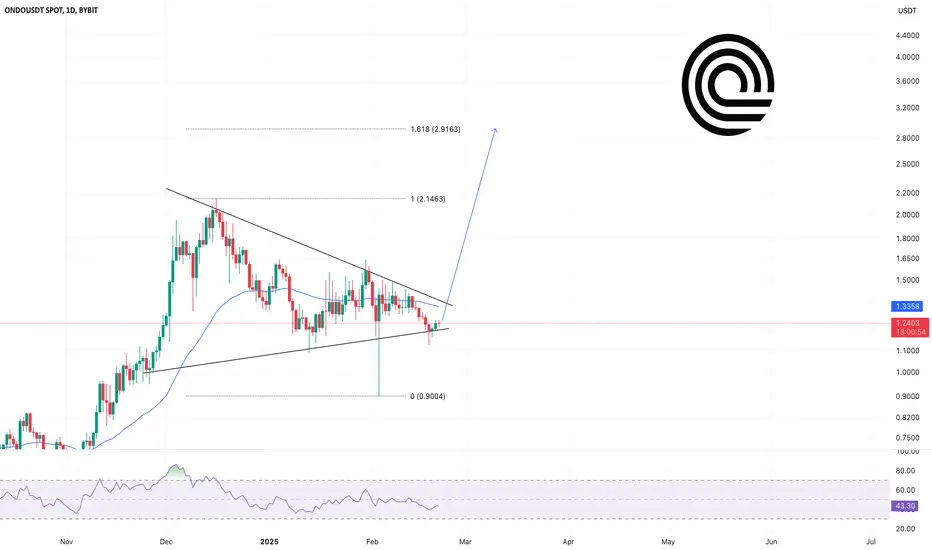
ONDO is the brainchild of BlackRockONDO is the top-1 tokenization platform for Real World Assets. I have already spoken at May 2024 where I talked about the relevance of the RWA sector and its aspirations for widespread adoption in blockchain. Specifically ONDO is a very progressive project that is launching its ONDO Chain! I think we will see strong upside in the asset over the near term and approach the 1.618 Fibonacci level. More globally, I would expect much higher values.
Horban Brothers.
ONDO target $2.654h time frame
-
Entry: $1.1
TP: $2.65
SL: $0.897
RR: 7.64
-
(1) ONDO is building a continuation structure with a triangle pattern.
(2) Triangle bottom is around $1.1, which is our entry opportunity.
(3) Fibonacci provides first target at $2.65 and final target at $3.7
(4) Stop loss once going below $0.897

HBAR & ONDO Give Us A Buy SignalTrading Fam,
My portfolio is all in rn. But that’s not going to stop me from helping you if you still have some cash on the sideline to throw at a trade or two. Here are two trades you may be interested in. I received a buy signal from my indicator at candle close last night on both.
The first is HBAR.
Hedera Hashgraph ( CRYPTOCAP:HBAR ) is one of the top alts currently being considered for a future ETF. I’ve received not one but two green dot signals within that large liquidity block. This tells me that institutional money and whales are accumulating this gem here. And it is on good support which I don’t see us breaking. If you entered at the time of this post (not fin advice), I could see holding to at least that recent high for a potential profit of 84% plus. If it were me, I’d set my stop out just below that recent pivot low.
The second trade opportunity I have spotted here is ONDO.
The chart here looks similar and once again I’d be targeting that last pivot high for around 75% profit potential. I’d also set my stop limit below our most recent pivot low.
These are both great coins with great opportunities for entry here! Let me know if you enter.
Best!✌️ Stew

$ONDO mechanism for BlackRock tokenizationYou know how optimistic we are about tokenizing real world assets and ONDO is one of the projects for tokenization. The most influential investment fund BlackRock is an investor in ONDO and is ready to tokenize its assets. My minimum forecast for the foreseeable future is $3.45. Buckle up!
Horban Brothers.

ONDO looks bullish (8H)ONDO seems to be in a complex correction.
As long as the green zone holds, it can move upward. The target could be the red box or even the hunt-in box.
A daily candle closing below the invalidation level will invalidate this analysis
invalidation level: 1.19$
For risk management, please don't forget stop loss and capital management
Comment if you have any questions
Thank You

ONDOUSDT 1DONDO ~ 1D Analysis
#ONDO Bullish Pennant is formed on Time Frame 1D. The best way to wait until this pattern is successful broken and buy.

ONDO Ready to Explode? Bulls Pushing for a Major Breakout!Yello, Paradisers! While most altcoins are struggling, #ONDOUSDT is showing incredible strength despite the ongoing market correction. But the big question is—can it break through resistance and rally higher? Let’s break it down!
💎#ONDO is currently forming what looks like an ascending triangle, a bullish pattern that signals a potential breakout. The price has been steadily climbing, but bulls now face a decisive resistance at $1.55–$1.60. This level is the neckline of the pattern, meaning a strong breakout here could send prices flying toward higher targets.
💎If ONDO manages to break out with strong volume, the next strong resistance lies at $1.84–$1.90—right around the recent 52-week high. Some short-term profit-taking could happen at this level, but if bulls push through, $2.10–$2.20 becomes the next major target, which aligns with the full pattern breakout projection.
💎On the downside, ONDO has strong support levels to hold the trend. The first support sits at $1.33–$1.295, reinforced by an ascending trendline. Just below, the EMA-250 adds another layer of protection against deeper corrections. Even if sellers gain momentum, ONDO enjoys a solid strong support at $1.18–$1.12, a key demand zone capable of absorbing heavy selling pressure.
Stay sharp, Paradisers! The market doesn’t forgive emotional decisions stick to the plan and execute like a pro!
MyCryptoParadise
iFeel the success🌴

$ONDO - Main Takeaways from the ONDO SummitMain Takeaways from the ONDO Summit
The Ondo Summit 2025, held on February 6, 2025, marked a significant event for the integration of traditional finance (TradFi) with decentralized finance (DeFi) sectors. Here are the main takeaways:
Institutional Onboarding into DeFi: The summit was crucial for introducing institutional investors to DeFi, with a focus on Real World Assets (RWA) tokenization. This was highlighted by the participation of high-profile figures from traditional finance, including BlackRock's CEO Larry Fink, indicating serious institutional interest in DeFi.
Ondo Chain: Ondo Finance announced the launch of its own blockchain, Ondo Chain, aimed at scaling assetization and merging TradFi with DeFi. This signifies a big step towards bringing traditional financial assets onto blockchain platforms.
Ondo Global Markets: The introduction of Ondo Global Markets was to facilitate tokenization of stocks, bonds, ETFs, and mutual funds, offering 24/7 access to these assets on-chain. This move is intended to make financial markets more accessible, transparent, and efficient.
Ondo Finance's ambition to bridge the gap between traditional and decentralized finance, potentially setting new standards for how financial assets are managed and traded in the future.
TECHNICAL OUTLOOK
ONDO is one of the most promising RWA tokens, with great potential.
With incredible strength, it's currently consolidating while the entire altcoin market is being shredded.
It's holding the $1.30 support well; however, we need to see Bitcoin holding the $96k level. Bitcoin was rejected at $100k, and there's evident buyer weakness at the current level, with a poor reaction likely due to low volume over the weekend.
Let's see if there will be a reaction at 92k; it has proven to be a strong support, though we could also deviate below it and test the lows around $89k.
If Bitcoin drops to 92k, we could see ONDO revisiting $1.20-$1.18, or it could go lower, filing its wick at $1.12-$1.08.
The worst scenario would be taking out the imbalance/excess at $1.

Support around 1.3814 is the key
Hello, traders.
If you "Follow", you can always get new information quickly.
Please click "Boost" as well.
Have a nice day today.
-------------------------------------
(ONDOUSDT.P 1D chart)
This volatility period is expected to continue from February 7th to 9th.
It has touched the Fibonacci ratio range of 0.236 (0.8416) ~ 0.382 (1.0298) and is rising.
Currently, the key is whether it can be supported near the MS-Signal (M-Signal on the 1D chart) indicator, near 1.3814.
If it is supported, it is expected to rise above the BW (100) indicator point of 1.4869.
-
If it is supported near 1.1255-1.2715, it is a time to buy.
If it falls below this range, you should check for support near 0.9274.
-
(1M chart)
The chart has not been created for long, so the indicator has not been formed yet.
However, if it is supported and rises around 0.5(1.1818) ~ 0.618(1.339) in terms of Fibonacci ratio,
1st: 1(1.8263)
2nd: 1.618(2.6228)
3rd: 1.902(2.9889) ~ 2(3.1152)
You should respond depending on whether there is support around the 1st-3rd above.
-
Thank you for reading to the end.
I hope you have a successful trade.
--------------------------------------------------
- Big picture
I used TradingView's INDEX chart to check the entire range of BTC.
(BTCUSD 12M chart)
Looking at the big picture, it seems to have been maintaining an upward trend following a pattern since 2015.
That is, it is a pattern that maintains a 3-year uptrend and faces a 1-year downtrend.
Accordingly, the uptrend is expected to continue until 2025.
-
(LOG chart)
As you can see from the LOG chart, the uptrend is decreasing.
Accordingly, the 46K-48K range is expected to be a very important support and resistance range from a long-term perspective.
Therefore, we expect that we will not see prices below 44K-48K in the future.
-
The Fibonacci ratio on the left is the Fibonacci ratio of the uptrend that started in 2015.
In other words, it is the Fibonacci ratio of the first wave of the uptrend.
The Fibonacci ratio on the right is the Fibonacci ratio of the uptrend that started in 2019.
Therefore, this Fibonacci ratio is expected to be used until 2026.
-
No matter what anyone says, the chart has already been created and is already moving.
How to view and respond to this is up to you.
When the ATH is updated, there are no support and resistance points, so the Fibonacci ratio can be used appropriately.
However, although the Fibonacci ratio is useful for chart analysis, it is ambiguous when used as support and resistance.
This is because the user must directly select the important selection points required to create Fibonacci.
Therefore, since it is expressed differently depending on how the user specifies the selection points, it can be useful for chart analysis, but it can be seen as ambiguous when used for trading strategies.
1st : 44234.54
2nd : 61383.23
3rd : 89126.41
101875.70-106275.10 (Overshooting)
4th : 134018.28
151166.97-157451.83 (Overshooting)
5th : 178910.15
-----------------

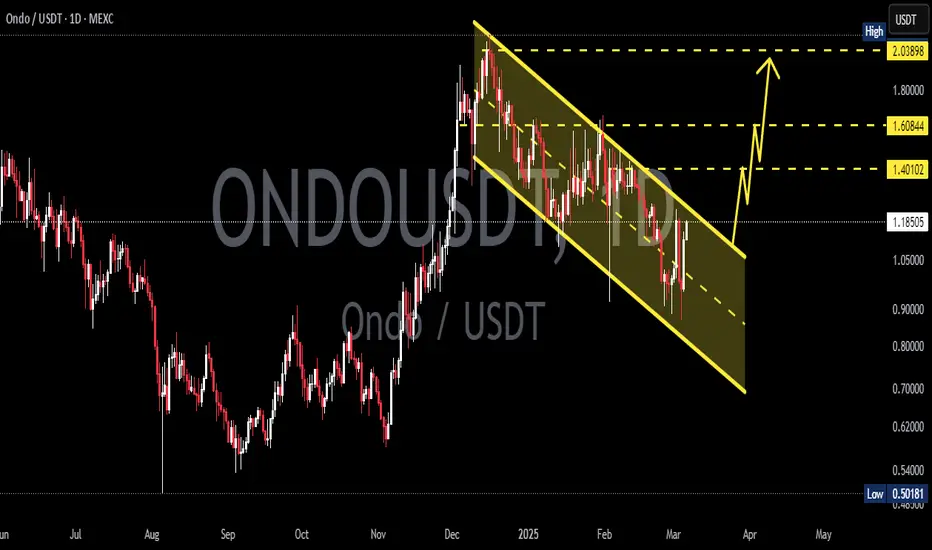
ONDO - Retest of $2.13 for a 50% gainONDO macro setting up for a bullish swing retest of the $2.135 level.
Currently in a curved ascending parallel price channel setting higher highs snd higher lows.
RSI and MACD looking prime for a wave up.
Trumps World Liberty Financial bought $470,000 worth of ONDO, last month bought over $200,000.
When you think of ONDO you should think RWA.

ONDO ANALYSIS (4H)From the point marked as "start" on the chart, it seems the ONDO correction has begun.
This correction appears to be a diametric pattern.
If it reaches our entries, we will open positions.
The targets are specified on the chart.
Closing a daily candle below the invalidation level could invalidate this analysis.
For risk management, please don't forget stop loss and capital management
Comment if you have any questions
Thank You

ONDO has nice potential if it pulls back to the proper buy zone.ONDO has been on a tear lately with the rest of the crypto market, and some really good opportunities could present themselves 'if' it pulls back into the proper discount buy zone. The fair value gap, or just above it, could present the perfect opportunity for a lower risk entry. Higher risk entries could present themselves within the corresponding fib zones. But I wouldn't chase price. Instead, have patience and let the price come to you.
Good luck, and always use a stop-loss!

Public trade #13 - #ONDO price analysis😕 Rumor has it that #Trump “inner circle” is favorable to #ONDO
📊 If this is true, then the OKX:ONDOUSDT price should not fall below $1.15-1.19.
🚩 Critical buy zone for #OndoFinance is $0.91-0.96
Below that, we will no longer be interested, as the price movement structure will be broken.
💰 Medium-term target for #ONDO price growth, under a positive scenario, is $2.50
_____________________
Did you like our analysis? Leave a comment, like, and follow to get more

Is ONDO Gearing Up for a Massive Breakout or Breakdown?Yello, Paradisers! Are you prepared for what’s about to unfold? #ONDOUSDT is at a critical juncture, and the price action is signaling that a major move could be imminent. Will it skyrocket higher or collapse below support? Let’s dive into the analysis.
💎#ONDOUSDT is currently trading within a falling wedge pattern a classic bullish indicator that often hints at a potential trend reversal. The price has been squeezed between a descending resistance line and a strong support level, creating a buildup of tension. At the moment, #ONDO is sitting near the $1.25665 demand zone, a critical level that buyers have historically defended with vigor. If this zone holds, a significant bullish breakout may be on the horizon.
💎Adding weight to the bullish case is the RSI divergence, which indicates that selling pressure is weakening.If #ONDO can break above the wedge’s resistance line, the stage could be set for a rally toward the $1.75–$2.30 range, with the potential to reach $2.50 or higher if bullish momentum continues.
💎However, we must stay vigilant and prepared for the alternative. If the $1.25665 demand zone fails, #ONDO could drop toward an untested historical support level at $1.0995. A break below this level might trigger a liquidation event, as weak hands are flushed out of the market. A deeper correction could then push prices toward $0.90 or even $0.70, invalidating the bullish wedge and likely increasing selling pressure.
Paradisers, this is a prime example of why patience and preparation are the most important tools in a trader’s arsenal. While most traders act on emotions, always focus on planning, waiting for confirmation, and executing smartly.
MyCryptoParadise
iFeel the success🌴

ONDOUSDT 1DONDO ~ 1D
#ONDO If you still have Conviction on this coin,. Maybe you can consider this support block to start buying gradually. Minimum target 15%+
