Harmony, ONE, going for.. almost 1.. (0.5 USD)Harmony is making for a long time momentum, walking in the footsteps of Matic, as always...
Very underrated, making a very large IHS, hovering above the 21 EMA, having 50 getting in line as well..
Target is 0.5 usd or about a 300% increase potential.
ONE

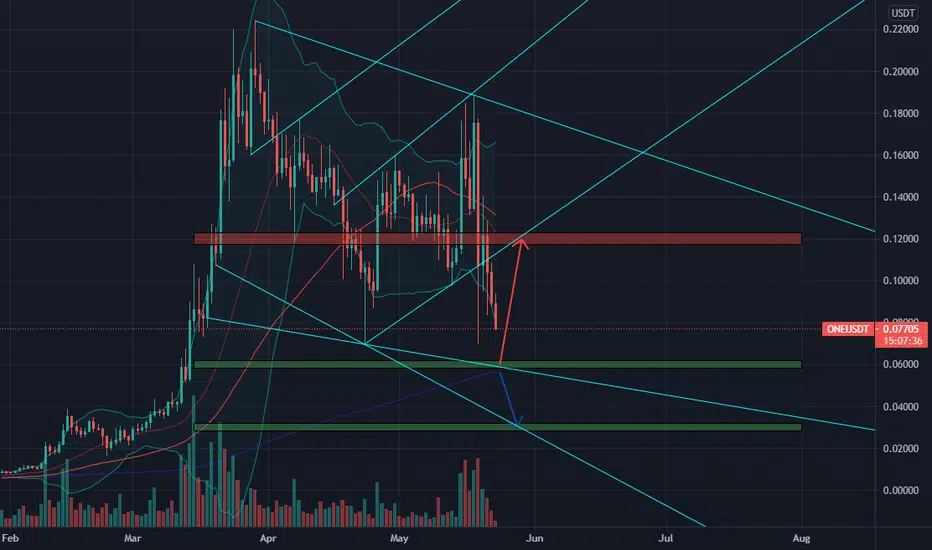
🆓Harmony (ONE) May-23 #ONE $ONEONE is dumping and its target may be 0.06$ zone, actually it can dump to 0.03$ zone but we must pay attention to 0.06$ zone because it is very strong and a quick recovery of up to 0.12$ can occur from that zone
📈BUY
-Buy: 0.058-0.062$ if A. SL if B
📉SELL
-Sell: 0.117-0.123$. SL if A
♻️BACK-UP
-Sell: 0.058-0.062$ if B. SL if A
-Buy: 0.028-0.032$. SL if B
❓Details
🕯Timeframe : 1 Day
📈Red Arrow : Main Direction as BUY and SELL section
📉Blue Arrow : Back-Up Direction as BACK-UP section
🟩Green zone : Support zone as BUY section
🟥Red zone : Resistance zone as SELL section
🅰️A : The Close price of candlestick is Above the zone
🅱️B : The Close price of candlestick is Below the zone
Harmony - ONE - Is ONE ready to RUN!Harmony - ONE - Is ONE ready to RUN towards 30 cents? HODL is the Motto!


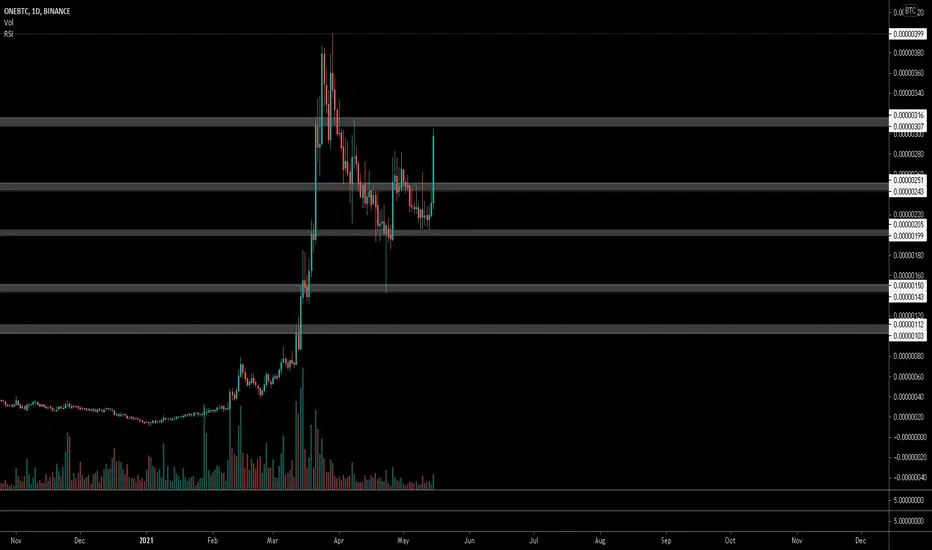
$ONE, W bottom structure (similar to COTI) $ONE
Looks interesting if its able to cross above ~315sats level..
W bottom structure (similar to COTI)
From here ~400 sats ATH level..
Wait for it but may work out
#ONE
oneCurrency can reach high targets due to its ceiling ... Of course, we have to wait for this growth after bit correction :)

ONE Ready To Move UpOne held quite strong on the BTC crash. Ready to make its move after consolidation.

BTC daily, for me it´s a big opportunity Fear is on the streets today, but on my view we just finally touched the 21 weekly MA, we always did in the past halvings, why not again now?
Oh, and every time that average becomes support we don´t see it again for aa long time, so, on my side we are just dropping some weak hands, and smart people are buying and will buy the dip.

BTC is kissing the 21 weekly finallyI know most are bearish right now but I am waiting for that touch on the 21 weekly for a long time now.
That touch always happened before and It only indicated a new bottom for a continuation to the upside in halving periods.
I am bullish as hell from now on. The time for it to test the 30`k have passed since when the 21 weekly average moved to the 47k region. Now that is the bottom, at least for me.
Have a good one.

Harmony ONE formed a bull flag.Title basically. If ONE manages to break on the upper side, we shall see a parabolic move to at least 0.20 (textbook say that the height should be equal to the flag pole, but you never know with crypto).
Moves:
Buy 0.12/0.13 -> sell something at 0.16 just in case we don’t break the flag, let the rest ride if we break.
Buy when 4h candle closes above the upper side of the flag -> sell at 0.20. You can even sell something at 0.20 and let the rest ride if you feel comfortable.
Good luck, and stay safe!
Not financial advice.

Harmony one weekly pivot setupStop loss L4. Target H3 to H5. Camarilla pivots weekly levels. stop loss could be at daily l4 at 9 cents if you wanted a wider stop

Oneusdt Bullish breakoutThe Bullish Flag breakout is done now we can see it's movement upwards till next resistances now
Thanks

ONEUSDT (ONE) - BULLISH SETUP ANALYSIS 🔎
- ONEUSDT hit an ATH and retraced for a retest of the key fibonacci retracement zone (0.5 - 0.618 - 0.786).
- There's a relatively high concentration of buyers at this zone.
- The retracement was resisted by the descending trendline resistance (DTR-1).
- Price brokeout above the descending trendline resistance (DTR-1), this is a bullish signal.
- There's a potential formation of the bullish inverse head and shoulders (IH&S) pattern.
- Price hit a swing high and retraced (right shoulder formation).
- Price is retesting the descending trendline resistance (DTR-1), horizontal support level (S1) and the key fibonacci retracement zone (0.5 - 0.618 - 0.786).
- The minor retracement at the right shoulder is resisted by the descending trendline resistance (DTR-2).
- Breakout above the descending trendline resistance (DTR-2) could lead to the test of inverse head and shoulders neckline resistance (complete formation of the inverse head and shoulders pattern).
- Further breakout above the inverse head and shoulders neckline resistance could be a bullish confirmation.
BUY ENTRY ⬆️
- Breakout above the descending trendline resistance (DTR-2).
- Breakout above the inverse head and shoulders neckline resistance (NR).
TARGETS 🎯
- All Time High (ATH) resistance.
- Fibonacci extension levels.
SETUP INVALIDATION ❌
- Initial invalidation : breakdown below 0.786 fibonacci retracement level.
- Final invalidation : breakdown below previous swing low horizontal support level (S2).

$ONE. Reversal Structure. My favorite chart pattern.It's an absolute joy when I see this chart pattern. I don't know why. I can't explain it. It just is such an awesome pattern.
The analytical portion of me would say it's because this pattern requires the fitting together of multiple pieces, and there is a little bit of delayed gratification in coming to this eventual conclusion.... but let's just say I enjoy seeing this pattern.
I could call it the palm tree pattern! These are the trades that make me see beaches and sunlight.

ONE: 330 sts - 500 stsNext high levels for ONE: 330 sts & 500 sts.
Then ONE will leave this bullrun ^^


SUSHI in a great trend momentSUSHI recovering the trend, could be a great long buy in the next weeks.

BTC about to goInverse H&S in the 15min, with bullish cross. keep in mind that it is a short term indication.

Oneusdt making bullish flag After breaking descending channel one is making a Bullish Flag after breakout we can see nice upward movements
Thanks

Now is the moment to be aware of every BTC move, alts still haveNow is the moment to be aware of every BTC move, alts still have space to grow if BTC keeps losing dominance.

Golden Cross! Just saying, time for BTC now, and afterwards AltsBTC just made a golden cross while ETH needs to correct a but for further pumps. I am sealing my BTC when I see a good moment to swap to ETH.

Filling the GAP is inevitable, but are we continuing to go up?Well well, BTC is coming back strong to test that old support as a resistance now, Since we are over the 8 weekly MA we could continue to go up,
or that resistance could send us back down again to touch the 21 Weekly MA before going up again, or maybe even lower if things go bad.
But with all that institutional money coming in we have to stay strong and wait for another break on the 8 Weekly MA,
if that happens it will be the time to close positions.
Also, it Alts time right now, so stay alert for eventual pull backs, but for now Alts are in the bullish direction, don´t loose that opportunity.
