Harmony [#ONE] : Upto 80% Profits Opportunity In The Mid Term.#Accumulation_Recommendation
Pair : #ONE / #BTC
Accumulation Area : 60 sats - 68 sats
Distribution Targets :
Short Term :
🎯 Target 1 : 75 sats
🎯 Target 2 : 82 sats
🎯 Target 3 : 90 sats
🎯 Target 4 : 100 sats
🎯 Target 5 : 113 sats
🎯 Target 6 : 140 sats+
Stop Loss : 49 sats
Invest: 3%
Risk/Reward: 4.81
ONEBTC

ONEBTC ( Harmony )Bullish Breakout and Target 100 Satoshi#ONEBTC Chart Overview:
#ONE now trying to breakout upward if daily candle close above 69 Sat then we can expect upward move.
if close above trend line then we can targets our Resistance Level.
Support: 64/60 Sat
Resistance : 72/84/107 Sat
Resistance = Targets
Please like and follow me for latest crypto updates.
Thank you


Opportunity if you heardHello everyone, this is our view on onebtc, enjoy!
Analysis:
Good phase of accumulation, just brokeout of a falling wedge, waiting to form W gartley, last time completed with 5 impulse waves. Also recently followed trendy coins like matic and lend. We found out very good news for harmony, our suggestion is you should buy and hodl. Pump is coming when ma9 and ma25 are forming golden cross on daily (very soon). Very important support to retest (in order to fill sell opp on renko) is wma50, first target on ema200. Bollinger accumulated, now ready to bounce from upper band. Bullish ichimoku, will act as a minor support from now. Smaller bull divergence on laggings (chaikin, moneyflow, rsi, stoch) which is turning in a bigger bear divergence. Uo instead made a bear divergence which already played out. Stoch trendy on smooth 50. Super bullish momentum on macd and ao. Small greed accumulation, but we're far below our average so it's not pure data.
Strategy:
Entry: 59 (actual price)-57-53
Target: 66-70
Sell (HODL): 80-96-120-MOON
Stoploss: below 52
Moderate risk for good gains!
Tip: we found out very good news for harmony, our suggestion is you should buy and hodl.
Trade safe. Anlvis.

ONE/BTC forming bullish sharkI plan to buy ladder my entries between 49-45 sats and a candle close below 44 or so will be my SL.
These are just my trade setups based on my views and opinions, I am not a financial advisor, DO YOUR OWN RESEARCH!


ONEBTC, Looking Entering Buy ZoneBullish Butterfly spotted via XABCD Scanner
Confluence with Phantom Script
Indicators used by @coinobsalgos
Epic trading suite, been using it for some time now.
Bid Zone, 59 sats - 66 sats
That's where I'm expecting the reversal :)
Targets on Chart.

ONE/BTC TA Update (Bearish RSI?)ONE/BTC
ONE may have a hit temporary top, a bearish divergence with the RSI adds a factor to this. If the top is set,
I expect the price to a pullback in the 95-85 regions to get buyers to enter the market again and invalidate the bearish RSI divergence.

ONE LONG$ONE
I anticipate this will keep moving up from here in tandem with the other IEO's. Could see a pullback into 86 first, targeting 104 sats.

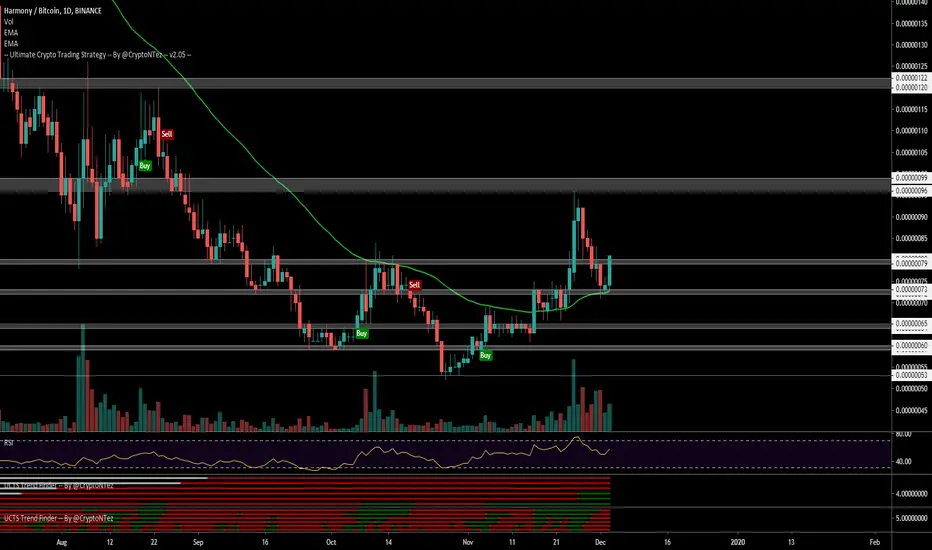
$ONE, Retested & flipped successfully ~72 sats level $ONE
Retested & flipped successfully ~72 sats level (matching EMA50) & now bounced back up with increasing volume
UCTS active buy signals on the 1/2/3 D charts
I would like to see a flip of ~79sats level as potential entry for a run up with 1st target at ~90s sats (20%+)
#ONE
ONE/BTC LONG - 110 satsDon't want to comment much on this one.
Just click the play button to see how did this work out :)
Take care
Vlad The Crypto Trader

ONEBTC Long updateLooking good right now for 100+ sats, daily forming some nice bullish market structure. Let's see how far this one can go


ONEBTC Long Plan still remains the same for Harmony. As long as this important level around 80 sats holds as support I still like this long.


$ONE - The New $MATIC ?$ONE is on the way after breaking the range.
R/S Flip with new bounce ... and boucing on 1Day MA 100
Hope it's just the beginning
NOT FINANCIAL ADVICE


$ONE R/S flip on 4H; MACD bull crossLooks like $fet before pump. Trending upward; Entry 78-79. $ONE R/S flip on 4H; MACD bull cross.
