EURUSD - Bullish fair value gap and fibonacci support!At the end of July, EUR/USD experienced a sharp and decisive move to the downside, signaling a strong bearish momentum in the market. Following this decline, the pair began to recover, steadily climbing and partially filling the 4-hour Fair Value Gap (FVG). After tapping into the 4-hour FVG, price action has entered a corrective phase, moving lower towards a confluence of bullish levels. This area is defined by both the 1-hour and 4-hour FVGs, which align perfectly with the golden pocket of the Fibonacci retracement tool, a high-probability zone often watched by traders for potential reversals.
Bullish Support
The key bullish support zone sits around the 1.158 to 1.160 range. This area holds significant importance because it combines two strong technical factors: the 1-hour and 4-hour FVGs, as well as the golden pocket Fibonacci retracement. The overlap of these technical elements often acts as a magnet for price and can create a strong foundation for a bullish reaction. If the market respects this zone, we could see EUR/USD push higher in the short term, as traders capitalize on the support to drive price towards higher resistance areas.
Bearish Resistance
On the upside, the main bearish resistance zone lies between 1.170 and 1.174. This area represents the final portion of the unfilled bearish 4-hour FVG and could act as a significant barrier for further bullish progress. If price returns to this level, the strong supply pressure could result in a sweep of recent highs, fully filling the 4-hour FVG before potentially resuming the downward trend. This scenario aligns with the idea that sellers may re-enter the market aggressively once this resistance zone is tested.
Final Thoughts
Given the current market structure, my expectation is that the bullish support zone around 1.158 to 1.160 will hold, providing a potential launchpad for price to revisit and possibly complete the filling of the bearish 4-hour FVG near 1.174. However, if the market breaks decisively below the 1-hour FVG, it could indicate a shift in sentiment, opening the door for a bearish continuation and deeper downside targets. The coming sessions will be critical in determining whether EUR/USD can maintain bullish momentum or if sellers will regain control.
-------------------------
Disclosure: I am part of Trade Nation's Influencer program and receive a monthly fee for using their TradingView charts in my analysis.
Thanks for your support. If you enjoyed this analysis, make sure to follow me so you don't miss the next one. And if you found it helpful, feel free to drop a like 👍 and leave a comment 💬, I’d love to hear your thoughts!
Community ideas

Bitcoin – The Last Stop Before the DropMarket Overview
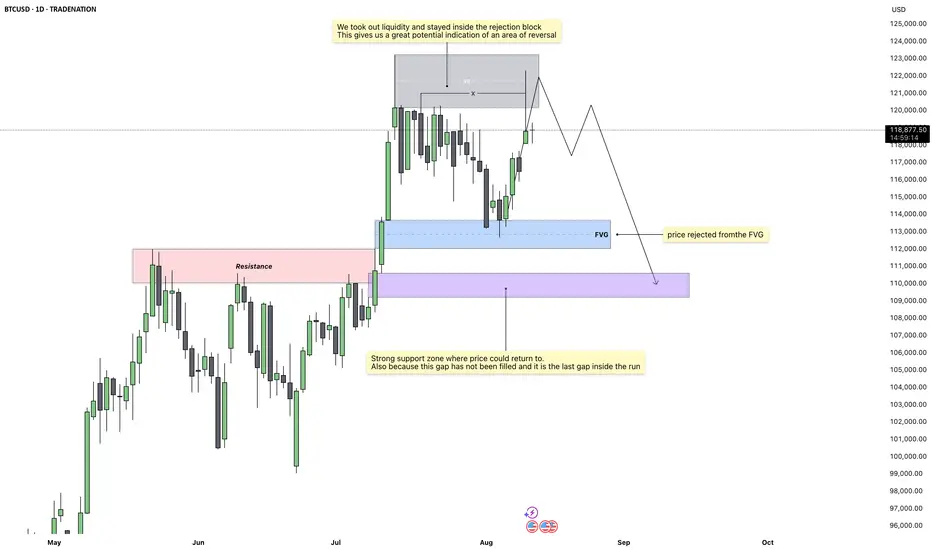
Price action on the daily chart has shown a decisive move into a key rejection block after taking out recent liquidity. This is a classic sign of exhaustion in the current move, suggesting that momentum may now begin to shift in the opposite direction. The daily close reinforced this idea, showing a clear respect for higher-timeframe resistance levels.
Rejection Block Context
The 4H and daily rejection blocks have aligned, creating a strong confluence zone where sellers have stepped in before. Price did not just test this area, it closed within it, which often indicates a high probability of reversal. This setup builds confidence that the market could be preparing for a retracement.
Liquidity Sweep Confirmation
Before the rejection occurred, price ran through a cluster of resting liquidity above recent highs. This liquidity grab often acts as the fuel for a reversal, as it traps late buyers and allows larger players to shift price in the opposite direction.
Fair Value Gap Target
Below current price, there remains an unfilled gap which is the final gap inside the current run. Historical price behavior shows that such gaps tend to get filled before a fresh move can develop. This unfilled zone provides a clear downside target.
Bearish Scenario
If the rejection holds, I expect price to work its way lower toward the 110k range, filling that remaining gap before any sustained bullish move can resume.
Conclusion
With liquidity taken, a clean rejection from higher-timeframe resistance, and an untouched gap below, the chart is aligning for a potential retracement. I am watching for continued weakness to confirm the move toward the 110k region.
Disclosure: I am part of Trade Nation's Influencer program and receive a monthly fee for using their TradingView charts in my analysis.
___________________________________
Thanks for your support!
If you found this idea helpful or learned something new, drop a like 👍 and leave a comment, I’d love to hear your thoughts! 🚀
A-Book vs B-Book: What Every Retail Trader Needs to Know█ A-Book vs B-Book: What Every Retail Trader Needs to Know
Most retail CFD traders have never even heard the terms “A-Book” and “B-Book,” yet almost all of them are directly affected by how these models work. Your broker’s choice between the two can change the prices you see, how your orders are filled, and even whether your stop loss gets hit. Let’s break it down so you know exactly what’s going on behind the scenes.
█ What is A-Book?
An A-Book broker routes your orders straight to external liquidity providers, such as banks, market makers, or directly to an exchange in the case of futures or spot markets. Your broker is essentially the middleman, passing your trade along and matching it with a real counterparty.
⚪ How they make money:
Spreads (the difference between the bid and ask prices).
Commissions on each trade.
Occasionally a small markup on the feed.
Because they don’t profit when you lose, an A-Book broker’s ideal client is a trader who trades frequently and consistently, your activity is their revenue stream.
█ What is B-Book?
A B-Book broker keeps your trades “in-house,” meaning they take the other side of your position. If you buy, they sell; if you sell, they buy, but all within their own system. Your trades don’t reach the real market at all.
⚪ How they make money:
Your losses are their profits.
They may still earn on spreads and commissions, but the main income is the net loss of their client base.
Because the broker profits from losing clients, there’s an inherent conflict of interest. It’s not that every B-Book broker is out to get you, but the incentive structure is very different from A-Book.
█ Hybrid Models – The Modern Reality
Today, many CFD brokers use a hybrid model. This means small accounts or “unprofitable” clients might be B-Booked, while larger or riskier trades are hedged via A-Book routing. This approach balances their risk and maximizes profits.
█ The Stop Loss Mystery – Why It Sometimes Gets Hit When It “Shouldn’t”
A common complaint among retail traders is this:
“My stop loss was triggered on my CFD broker’s chart, but the real market price never touched it.”
⚪ Here’s why this happens:
B-Book influence: If your trade is kept in-house, the price you see is the broker’s internal feed, not the pure exchange price. Minor spikes or wicks can appear that don’t exist on the actual CME or underlying market.
Different price feeds: Even A-Book brokers often aggregate liquidity from multiple sources, leading to small discrepancies from the official exchange price.
Overnight sessions: Many CFD brokers price products nearly 24 hours a day, even when the underlying market is closed. This “synthetic” pricing can produce moves that never happened in the actual market.
The result? You might see your stop hit during quiet, low-volume hours when the real market was nowhere near that level.
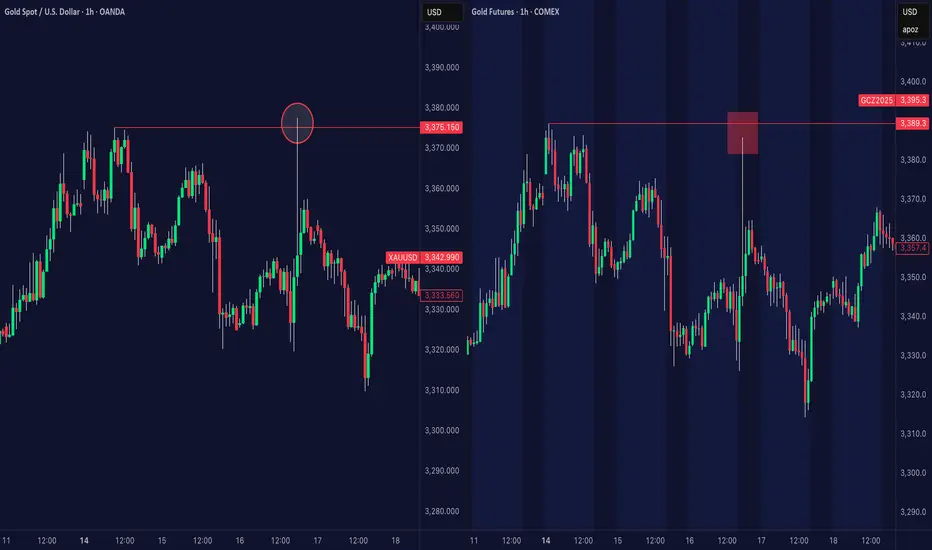
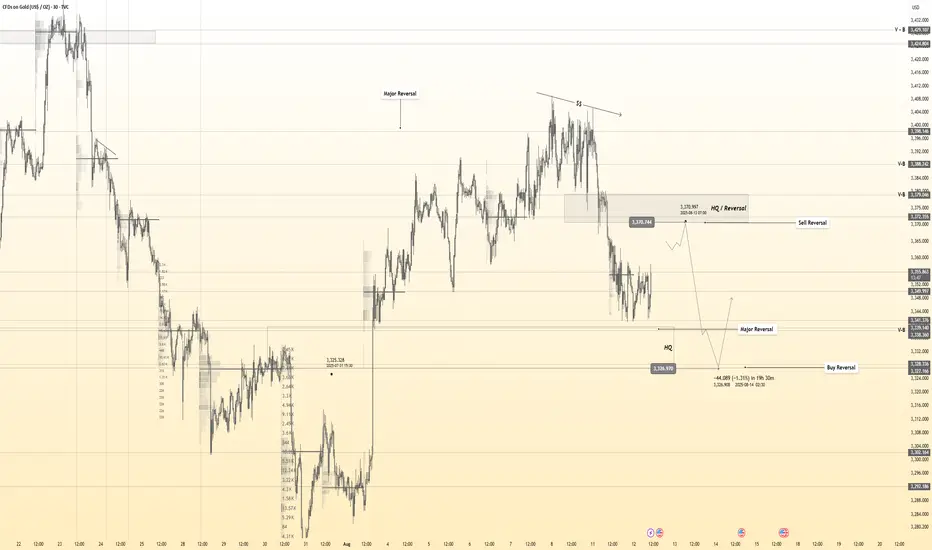
Side-by-side comparison showing a large wick on a CFD gold chart (left) that never occurred on the actual CME gold futures market (right). This kind of discrepancy can trigger stop losses on CFD platforms, even though the real market price never reached that level — a classic example of the Stop Loss Mystery.
█ Stop Hunting – When the Market Seems Out to Get You
Closely related to the stop-loss mystery is stop hunting, when price spikes just far enough to trigger a cluster of stops before reversing sharply.
In a pure B-Book setup, your broker isn’t just your counterparty, they can also see exactly where all their clients’ stops are placed. If they control the price feed, even the smallest manufactured move in their internal system can sweep through those levels. This can happen intentionally to lock in profits from client losses, or simply as a by-product of how their system reacts during thin liquidity.
From your perspective, it feels like the market was “out to get you,” touching your stop and then running in your direction. But often, that move never existed in the real underlying market at all, it was born inside the broker’s own pricing environment. And while low-volume hours are prime time for this, it can still happen in the middle of the busiest trading sessions.
Comparison of gold CFD pricing (left) and CME gold futures (right). The CFD chart shows a wick that sweeps above previous highs, potentially triggering stop losses, while the real futures market shows no such move, a classic example of suspected stop hunting on CFD feeds.
█ Why This Matters for Retail Traders
Understanding whether your broker uses A-Book, B-Book, or hybrid execution changes how you view price discrepancies, stop-loss triggers, and even your broker’s incentives.
A-Book: Broker earns from your trading volume, not your losses.
B-Book: Broker earns directly from your losses.
Hybrid: They can switch between models depending on the trade and client profile.
Knowing this doesn’t just help you choose a broker, it helps you understand the “market” you’re actually trading in.
-----------------
Disclaimer
The content provided in my scripts, indicators, ideas, algorithms, and systems is for educational and informational purposes only. It does not constitute financial advice, investment recommendations, or a solicitation to buy or sell any financial instruments. I will not accept liability for any loss or damage, including without limitation any loss of profit, which may arise directly or indirectly from the use of or reliance on such information.
All investments involve risk, and the past performance of a security, industry, sector, market, financial product, trading strategy, backtest, or individual's trading does not guarantee future results or returns. Investors are fully responsible for any investment decisions they make. Such decisions should be based solely on an evaluation of their financial circumstances, investment objectives, risk tolerance, and liquidity needs.
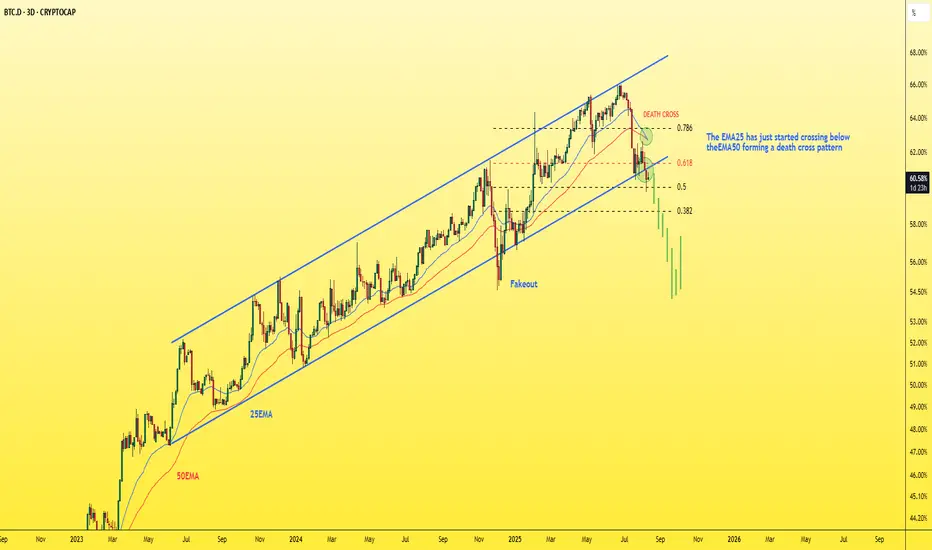
Dominance - Deep dive into Dominance chart!Did you know that dominance is on the verge of collapsing in the coming days? Let me tell you why.
🔸On the 3-day dominance chart:
- We have the beginning of a break of the ascending channel, a close below it, and a retest.
- There’s also a break of an important support level at 0.618 Fibonacci, followed by a retest, and it’s currently trading below it.
- Plus, we have a death cross where the EMA25 crossed below the EMA50.
That’s three confirmations on one chart — can you imagine?
The coming days will likely see a strong pump in altcoins. Remember my words.
Best Regards:
Ceciliones🎯
Lingrid | GOLD Anticipating a Trend Continuation Amid PullbackOANDA:XAUUSD is pulling back within the upward channel after topping near the 3,410 resistance zone. Price is currently holding above 3,330 support and aligning with the channel base, signaling potential for a bullish rebound. A push above 3,350 could open the way toward 3,385, while a drop under 3,315 risks deeper correction.
📉 Key Levels
Buy trigger: Break above 3,350
Buy zone: 3,328–3,350
Target: 3,385
Invalidation: Close below 3,320
💡 Risks
Failure to hold upward channel support
Strengthening USD pressuring gold
Sudden macroeconomic news impacting safe-haven demand
If this idea resonates with you or you have your own opinion, traders, hit the comments. I’m excited to read your thoughts!

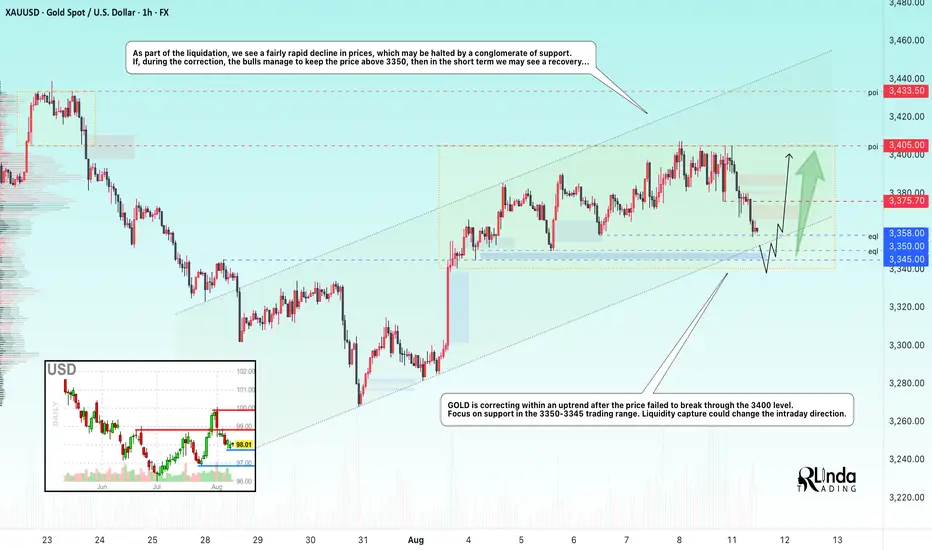
GOLD → Retest of support within an uptrendFX:XAUUSD is forming a liquidation phase as part of the previously mentioned bullish wedge pattern. Bulls were unable to break through the 3400 mark, and due to uncertainty, the price has entered a correction phase...
On Monday, gold fell to $3350, echoing the bearish sentiment in Asian trading, as $3400 remains an unattainable level. The pressure is intensified by weak data from China (PPI −3.6%), profit-taking and expectations for the US inflation report, as well as uncertainty in US-China trade negotiations and microchip policy. Optimism is being held back by expectations of Fed policy easing after negative statistics and forecasts of rate cuts, as well as possible meetings between US and Russian leaders. All this reduces demand for gold as a safe haven asset.
The focus is on the local trading range of 3400-3350. Before a possible rise, the market may test a strong support zone...
Resistance levels: 3376, 3405
Support levels: 3358, 3350, 3345
At the moment, we are seeing a retest of 3358 and a false breakdown, with a fairly weak reaction to the zone. In the short term, gold may test 3350-3345. A false breakdown and the bulls holding the price above this zone could bring the price back up...
Best regards, R. Linda!
EURUSDHello Traders! 👋
What are your thoughts on EURUSD?
Price broke its ascending trendline and entered a corrective phase, retracing to the 50% and 61.8% Fibonacci levels .
Currently, the market is trading near a major resistance zone, which aligns with the 76.8% Fibonacci retracement, a supply area, the broken trendline, and a horizontal resistance — adding to the confluence and strength of this level.
As long as price remains below this resistance zone, the bias stays bearish, and we expect a move down toward the specified lower targets after some consolidation in this area.
Don’t forget to like and share your thoughts in the comments! ❤️

xauusd (GOLD): a signal Hi guys!
Key Technical Points:
Ascending Channel:
Price action has been moving within a well-defined ascending channel.
Currently, the price has pulled back and is approaching the lower boundary of this channel.
This lower boundary often acts as a support area where buyers might step in.
Support Zone (Red Box):
The red highlighted area, around $ 3,340-$ 3,350 USD, is a key support zone.
This zone aligns w ith the lower boundary of the channel , adding more weight to the support.
Price is currently testing this area, which could act as a springboard for the next upward move.
Resistance Zone (Blue Box):
The upper resistance zone between roughly 3,425 and 3,440 USD is a major target for bulls.
This is a previous high area where sellers might re-enter the market.
-------------------------------------------------------
Trade Idea:
Long Position:
Entry could be considered near the lower boundary of the channel and the red support zone (around 3,340-3,350 USD).
Stop loss placement: Just below the red support zone to limit downside risk.
Target: The upper resistance zone at around 3,425-3,440 USD.

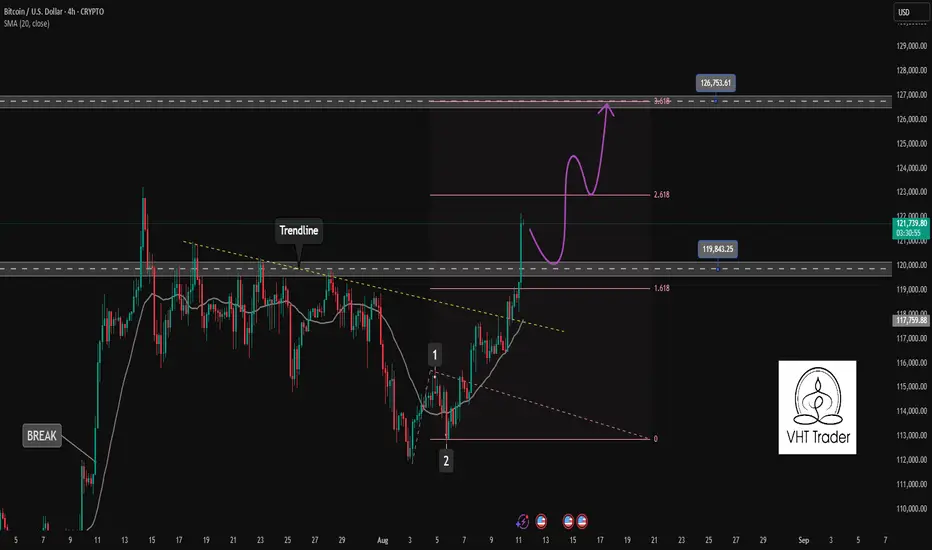
Bitcoin Near $125K Resistance — Is the Rally Over?Bitcoin ( BINANCE:BTCUSDT ) increased to $120,000 after breaking resistances , as I expected in my previous idea .
Bitcoin has already managed to break the Resistance zone($121,000-$119,000) and is moving near the Potential Reversal Zone(PRZ) .
According to Elliott Wave theory , Bitcoin is completing the 5th major impulse wave . In my opinion, this is the last bullish wave of Bitcoin, and after that we should wait for the main correction of Bitcoin . Do you agree with me that it is time to run and take profit!?
To get a better view of the main waves , I suggest you look at the idea below .
Also, since Bitcoin is correlated with the S&P500 Index ( SP:SPX ) and since I also foresee the possibility of a correction in the S&P500 Index, it is also possible to expect a decrease in the price of Bitcoin based on the S&P500 Index analysis .
I expect Bitcoin to start declining after entering the Cumulative Short Liquidation Leverage($125,000-$122,580) and Potential Reversal Zone(PRZ) and at least fill the CME Gap($119,100-$117,425) .
Note: There are heavy sell orders around $125,000.
Cumulative Long Liquidation Leverage: $120,866-$119,442
Cumulative Long Liquidation Leverage: $117,743-$115,452
What is your opinion on Bitcoin and its trend? Can it see $130,000, or will a main correction begin?
Please respect each other's ideas and express them politely if you agree or disagree.
Bitcoin Analyze (BTCUSDT), 2-hour time frame.
Be sure to follow the updated ideas.
Do not forget to put a Stop loss for your positions (For every position you want to open).
Please follow your strategy and updates; this is just my Idea, and I will gladly see your ideas in this post.
Please do not forget the ✅' like '✅ button 🙏😊 & Share it with your friends; thanks, and Trade safe.

GOLD ROUTE MAP UPDATEHey everyone,
Following up on yesterday’s update for our 1H chart route map:
The key retracement range continued to provide support, and we saw the reactionary bounce we expected.
Right now, we’re range-bound between 3329 and 3354.
As long as 3329 holds, we can expect continued bounces, tracking the movement upward.
We will keep the above in mind when taking buys from dips. Our updated levels and weighted levels will allow us to track the movement down and then catch bounces up.
We will continue to buy dips using our support levels taking 20 to 40 pips. As stated before each of our level structures give 20 to 40 pip bounces, which is enough for a nice entry and exit. If you back test the levels we shared every week for the past 24 months, you can see how effectively they were used to trade with or against short/mid term swings and trends.
The swing range give bigger bounces then our weighted levels that's the difference between weighted levels and swing ranges.
BULLISH TARGET
3403
EMA5 CROSS AND LOCK ABOVE 3403 WILL OPEN THE FOLLOWING BULLISH TARGETS
3422
EMA5 CROSS AND LOCK ABOVE 3422 WILL OPEN THE FOLLOWING BULLISH TARGET
3439
BEARISH TARGETS
3377 - DONE
EMA5 CROSS AND LOCK BELOW 3377 WILL OPEN THE FOLLOWING BEARISH TARGET
3354 - DONE
EMA5 CROSS AND LOCK BELOW 3354 WILL OPEN THE FOLLOWING BEARISH TARGET
3329
EMA5 CROSS AND LOCK BELOW 3329 WILL OPEN THE SWING RANGE
3304
3281
As always, we will keep you all updated with regular updates throughout the week and how we manage the active ideas and setups. Thank you all for your likes, comments and follows, we really appreciate it!
Mr Gold
GoldViewFX

GBPNZD: We could see a rejection at resistance once moreGBPNZD is range bound currently, and this latest moves continues the narrative of it. Right now, it's approaching a major resistance, where each touch here has showed good rejection.
My target would be toward 2.25230, an achievable target.
Though a scenario for more upside is possible and can happen just as much. But, I would take the side for more downside in this particular case.
Let me know in the comments what you think:
Disclosure: I am part of Trade Nation's Influencer program and receive a monthly fee for using their TradingView charts in my analysis.

#BTC #BTCUSD #BTCUSDT #BITCOIN #Analysis #Eddy#BTC #BTCUSD #BTCUSDT #BITCOIN #Analysis #Eddy
I have identified the important supply and demand zones of the higher timeframe for you.
This analysis is based on a combination of different styles, including the volume style with the ict style.
Based on your strategy and style, get the necessary confirmations for this analysis to enter the trade.
Don't forget about risk and capital management.
The responsibility for the transaction is yours and I have no responsibility for your failure to comply with your risk and capital management.
💬 Note: This is just a possibility And this analysis, like many other analyses, may be violated. Given the specific circumstances of Bitcoin, it is not possible to say with certainty that this will happen, and this is just a view based on the ICT style and strategy with other analytical styles, including the liquidity style. (( The fall of Bitcoin may not change the trend of altcoins and money will move out of Bitcoin and into altcoins, and we will see altcoins grow. ))
Be successful and profitable.

Gold 30Min Engaged ( Buy and sell Reversal Entry Detected )Time Frame: 30-Minute Warfare
Entry Protocol: Only after volume-verified breakout
🩸Bullish Reversal - 3329
🩸Bearish Reversal - 3370
➗ Hanzo Protocol: Volume-Tiered Entry Authority
➕ Zone Activated: Dynamic market pressure detected.
The level isn’t just price — it’s a memory of where they moved size.
Volume is rising beneath the surface — not noise, but preparation.
🔥 Tactical Note:
We wait for the energy signature — when volume betrays intention.
The trap gets set. The weak follow. We execute.
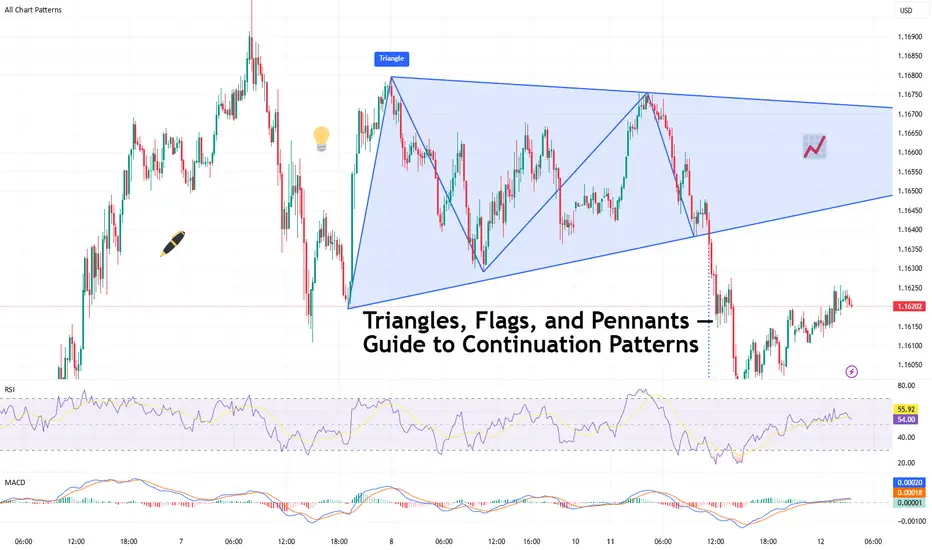
Triangles, Flags, and Pennants — Guide to Continuation PatternsChart patterns can be mysterious — until they’re not. Let’s break down the technical trio that tells you when a trend’s just taking a breather before it flexes again.
So your chart’s been pumping higher for weeks, and then… nothing. Price starts scribbling sideways. Cue panic? Maybe. But more likely, you’re staring at a continuation pattern.
Triangles, flags, and pennants are the subtle “hold my beer before I try to pull a move” signals of technical analysis. They show up when markets pause — not reverse. That pause could mean your trend is catching its breath, not dying in a ditch.
In other words: don’t close your longs just because things go quiet. Sometimes the market is just stretching before it sprints again.
⚠️ Symmetrical, Ascending, Descending
Let’s talk triangles, the Swiss Army knife of consolidation. These shapes come in three stylish varieties:
● Symmetrical triangle: Higher lows, lower highs. Traders call this the indecision pattern, but don’t get it twisted — it may just be winding up for a breakout. Wanna see how these look in practice? Dive into our community’s symmetrical triangle ideas .
● Ascending triangle: Flat top, rising bottom. Buyers are aggressive, their patience is running out. Resistance looks like it’s begging to be broken. Check the ascending triangle ideas for your viewing consideration.
● Descending triangle: Flat bottom, falling top. This one’s more bearish than your boomer uncle who knows zero about Bitcoin BITSTAMP:BTCUSD , and yes — it’s often a precursor to a breakdown. Follow the descending triangle ideas and make sure you DYOR.
Key tip : Wait for the breakout. Don’t front-run triangles unless you like volatility surprises and emotional damage.
🚩 Flags: Fast Moves, Tight Consolidations
Flags form after a sharp price move — the “flagpole” — followed by a tight, slightly sloping channel that moves against the prevailing trend. They’re short-term patterns that act like pit stops during a race.
● In a bull flag, price rallies sharply, then consolidates lower in a downward-sloping rectangle. If price breaks above the upper boundary, the uptrend is likely to resume. Jump straight into the bullish flag ideas .
● In a bear flag, price crashes, then drifts higher or sideways, forming an upward-sloping consolidation. A breakdown below the lower support hints at a continuation lower. What goes up must go down — bearish flag ideas for thought.
Flags are prized for their reliability and tight risk-to-reward setups. The breakout is typically swift, and traders often use the length of the flagpole as a projected target.
🎏 Meet the Pennant: The Flag’s Cousin
Pennants are like mini-triangles that form after a strong price move, usually in high-volume conditions. Unlike regular triangles, they’re smaller and more compressed — a tight consolidation in the shape of a tiny symmetrical triangle.
What makes a pennant different from a flag? The structure. While flags are rectangular, pennants are more pointed — a converging pattern rather than parallel lines.
Pennants are often seen in high-momentum environments, and when price breaks out of the consolidation zone, it often does so with force. Get some pennant ideas straight from our community.
🧐 How to Actually Trade These Patterns
Spotting a continuation pattern is one thing. Trading it with discipline is another.
Here’s a basic checklist:
● Identify the trend. Continuation patterns only work when there’s a clear preceding move. If the chart is a sideways mess, maybe skip it.
● Draw your levels. Use trendlines or horizontal support/resistance to outline the pattern. Keep it clean — if you’re forcing a pattern, it probably isn’t there.
● Wait for the breakout. Don’t jump in too early. Let the price confirm your bias. Breakouts are more credible with a volume spike.
● Set your stop wisely. Most traders place stops just outside the opposite side of the pattern — below the lower trendline in an uptrend, or above the upper trendline in a downtrend.
● Target projection. Many use the height of the pattern or the flagpole to estimate a target price, though market conditions should influence your approach.
🤔 So, What Could Go Wrong?
Glad you asked. Plenty.
● Fakeouts: Just because it looks like a breakout doesn’t mean it’s real. Wait for confirmation — volume, a close outside the pattern, or your favorite indicator giving the green light.
● Shaky patterns: Not every triangle-looking pattern is a triangle. Sometimes it’s just noise. Don’t make up patterns. The market doesn’t care about your geometry.
● Overleveraging: Continuation patterns look reliable, but no pattern is bulletproof. Position sizing still matters. Don’t bet the farm because a pennant gave you butterflies.
💡 Pro Tips from the Chart Trenches
● Set alerts on trendline breaks so you’re not glued to the screen like a caffeinated hawk.
● Use pattern recognition tools if you’re a newer trader — but verify manually. No software is a crystal ball.
● Trade continuation patterns in the direction of the trend. Countertrend flags are usually bear traps in disguise.
📌 One Last Thing: Pattern ≠ Prediction
Chart patterns don’t tell the future. They tell a story about buyer and seller behavior. Continuation patterns? They’re just the market saying, “Yeah, we’re still into this trend. Just grabbing some break first.”
Use them as one part of a system. Combine them with momentum indicators, volume, or good ol’ fashioned risk management.
Because in the end, it’s not about how many triangles you find — it’s about how many fakeouts you avoid.
Off to you : Spotted any textbook triangles or sneaky flags this week? Or caught a pennant fakeout that wrecked your stop loss?
Drop your best (or worst) continuation pattern story below. You never know who might learn something from your chart scars.
Gold 30Min Engaged ( Bullish Entry Detected )Time Frame: 30-Minute Warfare
Entry Protocol: Only after volume-verified breakout
🩸Bullish Reversal - 3340
➗ Hanzo Protocol: Volume-Tiered Entry Authority
➕ Zone Activated: Dynamic market pressure detected.
The level isn’t just price — it’s a memory of where they moved size.
Volume is rising beneath the surface — not noise, but preparation.
🔥 Tactical Note:
We wait for the energy signature — when volume betrays intention.
The trap gets set. The weak follow. We execute.

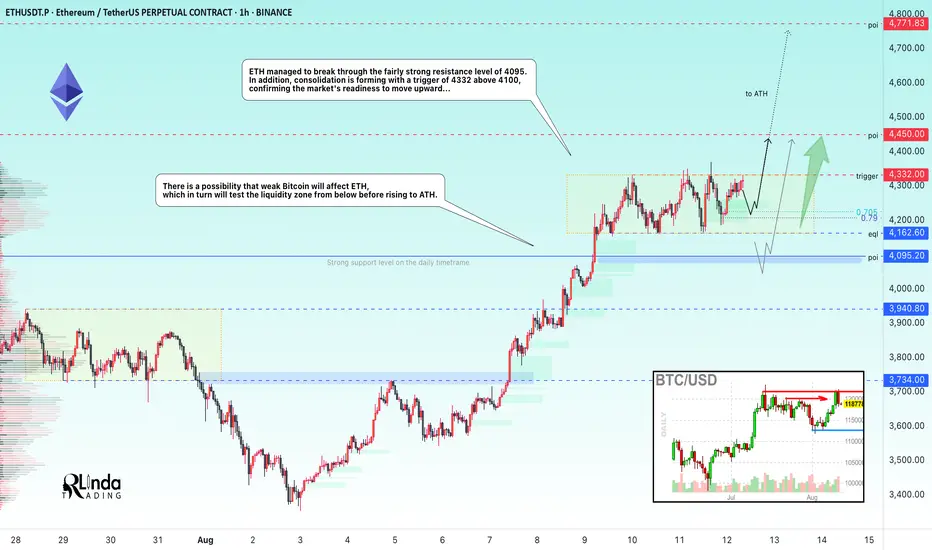
ETHUSDT → A new range has been opened. Onward to ATH!BINANCE:ETHUSDT is breaking through strong resistance formed in the 4090-4100 area on D1-W1. Consolidation is forming after strong growth, which can be seen as a positive sign.
Bitcoin has been looking quite weak recently against ETH, which continues to rally despite Monday's red market. ETH managed to break through the fairly strong resistance level of 4095, and after a strong 25% rally, the price moved into consolidation (trading range 4325-4160, with resistance at 4325 as the trigger). Technically, we see that the market has stopped updating local lows, and a fourth retest of resistance is forming with reduced volatility, which in general could lead to a breakout attempt. Consolidation of the price above the consolidation resistance could trigger further growth. A channel to the ATH is open...
Resistance levels: 4325, 4450, 4800
Support levels: 4220, 4162, 4095
ETH is quite strong and the market may not allow the price to fall too low, as there is a lot of excitement. However, I do not rule out the possibility that weak Bitcoin will affect ETH, which in turn will test the liquidity zone (4162 - 4095) from below before rising to ATH.
Best regards, R. Linda!
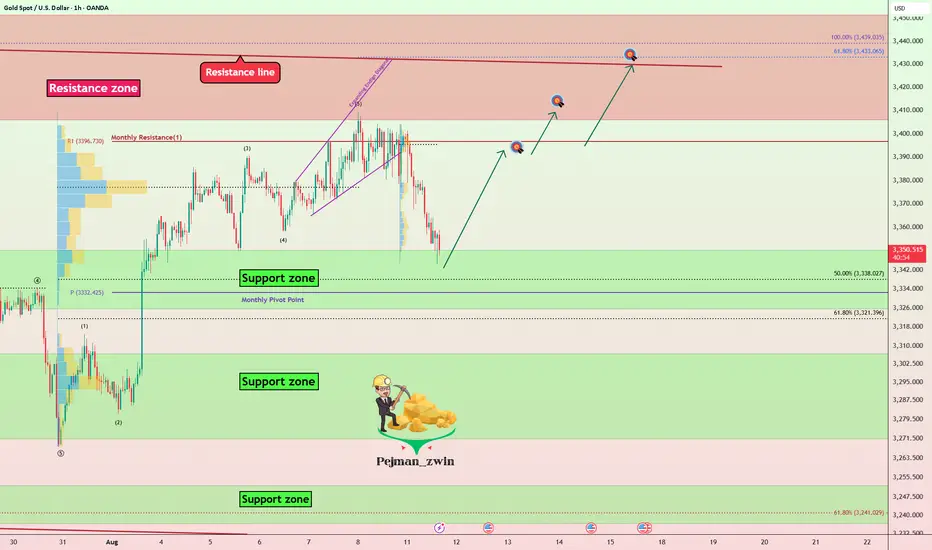
Gold Correction Ending — Time for the Next Rally?Gold ( OANDA:XAUUSD ) is currently moving near the Support zone($3,350-$3,326) and the Monthly Pivot Point .
In terms of Elliott Wave theory , it seems that Gold is completing a corrective wave, and we should wait for the next impulse wave .
I expect Gold to start rising from the Support zone($3,350-$3,326) and rise to at least $3,393 .
Second Target: $3,407
Third Target: $3,427
Note: Stop Loss (SL) = $3,317
Gold Analyze (XAUUSD), 1-hour time frame.
Be sure to follow the updated ideas.
Do not forget to put a Stop loss for your positions (For every position you want to open).
Please follow your strategy; this is just my idea, and I will gladly see your ideas in this post.
Please do not forget the ✅ ' like ' ✅ button 🙏😊 & Share it with your friends; thanks, and Trade safe.
BTCUSD is running wave 3 of the Elliott wave pattern✏️BTCUSD forms a bullish wave after the end of the correction wave at the support zone around 112000. The bullish Dow 2 pattern is formed when there is confirmation of a candle above 115500. Currently, BTCUSD is running wave 3 of the Elliot wave theory and the absolute principle is not to trade against the trend of the main wave. Wait for the profit-taking wave of investors so that the BTC price can adjust to buy towards the Fibonacci zone 3.618.
📉 Key Levels
Buy Trigger: Retest and rejection at the support zone 120,000
Target 127000
Leave your comments on the idea. I am happy to read your views.
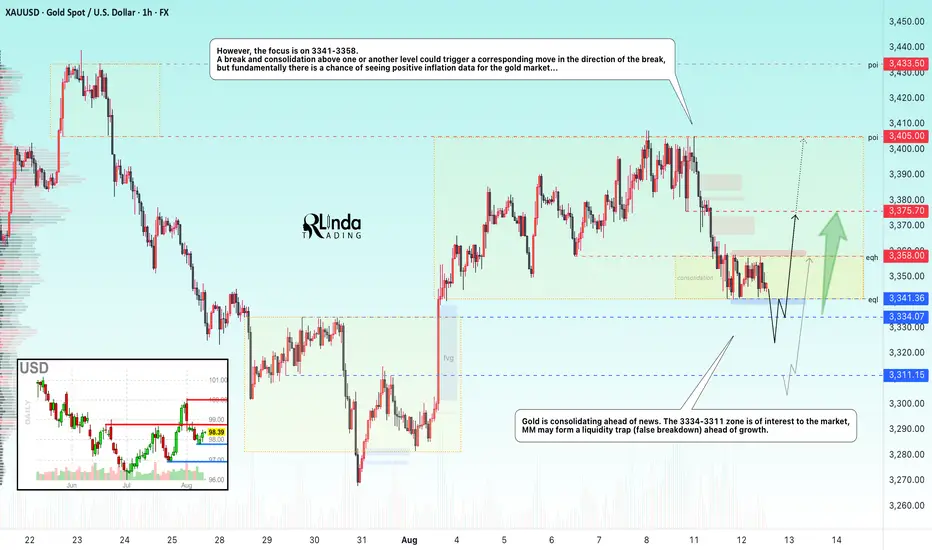
GOLD → Consolidation ahead of CPI data...FX:XAUUSD is consolidating ahead of news. Inflation is on the horizon, and further developments for the dollar and gold will depend on the data. Globally, gold is in a bullish trend, but locally we are seeing a correction...
Gold is rebounding slightly from $3,341 ahead of US CPI data for July and against the backdrop of the extension of the US-China trade truce until November. Investors are assessing the prospects for a Fed rate cut, expecting inflation to remain within 2.8% (core inflation is 3%). Weaker-than-expected data could cause the dollar to fall and support gold, while stronger data could resume the downward trend.
Technically, on D1-H4, gold is consolidating in a symmetrical triangle pattern and the price is in the support zone. There is a possibility that Trump may not make a mistake with inflation data, as he did with employment data...
Support levels: 3341, 3334, 3311
Resistance levels: 3358, 3375, 3405
The 3335-3310 zone attracts MM with an open FVG, which the market may partially close, forming a liquidity trap before continuing growth. However, it is also worth watching the boundaries of the current local consolidation, as a breakout of one or the other boundary could trigger a strong impulse.
Best regards, R. Linda!
XAUUSD - Drowning in RedHello everyone, what do you think about OANDA:XAUUSD ?
The other day, we discussed the movement of gold within the wedge pattern and the potential for it to test the 3350 USD support before bouncing back. That target was met, however, the sharp and sudden decline caused gold to lose its momentum momentarily.
Yesterday, gold dropped straight from 3398 USD to 3342 USD, a loss of more than 55 USD in less than a single session. The drop on Monday pushed the price of gold below a critical level. Moreover, the oscillators on the chart above are showing a bearish trend, supporting the scenario of further price decline.
The current support level is at 3350 USD, and price movement is following the Dow Theory. However, a convincing break below this level would act as a new trigger for bearish traders, potentially accelerating the decline towards the intermediate support at 3,315 USD, and then heading towards the round figure of 3,300 USD.
Do you think XAUUSD can bounce back from the 3350 USD support level? Feel free to share your thoughts!

ETH Remains Bullish – No Reversal Signals YetETH Remains Bullish – No Reversal Signals Yet
Following our earlier analysis, ETH has surged from the $2,500 zone to $4,300, showing a strong and sustained bullish trend.
Currently, there are no signs of a reversal, and momentum remains intact across multiple time frames.
I've prepared a multi-timeframe analysis indicating that ETH has the potential to reach $4,800 as a minimum target, with room for further upside if bullish conditions persist.
You may watch the analysis for further details!
Thank you!

British Pound can little grow and then drop to buyer zoneHello traders, I want share with you my opinion about British Pound. If we look at the chart, we can see how the price started to grow inside an upward channel, where it at once broke the 1.3280 level. In the channel, it rose to the resistance level, which coincided with the seller zone, after which it rebounded and fell to the support line of the channel. Later, GBP rose to the seller zone and dropped, breaking the resistance level and exiting from the upward channel. Then the price entered to wedge and then made an impulse up, breaking the resistance level, and rose to the resistance line of the wedge. After this movement, it turned around and started to decline. Soon, it broke the 1.3580 level one more time and fell more. But later it turned around and rose to the 1.3580 resistance level, which coincided with the resistance line of the wedge. Then it dropped to the support line of the wedge, breaking the support level, but soon it backed up and rose back to the resistance line of the wedge pattern. Now I expect that the British Pound can continue to decline inside the wedge, and reach the buyer zone, breaking the support level. For this case, I set my TP at 1.3245 points, which coincided with the buyer zone. Please share this idea with your friends and click Boost 🚀
Disclaimer: As part of ThinkMarkets’ Influencer Program, I am sponsored to share and publish their charts in my analysis.

USDJPY 30Min Engaged ( Bullish Reversal Entry Detected )Time Frame: 30-Minute Warfare
Entry Protocol: Only after volume-verified breakout
🩸Bullish Reversal : 148.100
➗ Hanzo Protocol: Volume-Tiered Entry Authority
➕ Zone Activated: Dynamic market pressure detected.
The level isn’t just price — it’s a memory of where they moved size.
Volume is rising beneath the surface — not noise, but preparation.
🔥 Tactical Note:
We wait for the energy signature — when volume betrays intention.
The trap gets set. The weak follow. We execute.
