NEO casually not giving a fk about this dipI bought NEO a few weeks ago in anticipation of this event. A few targets drawn up here, and this is only the USD pair.
When we look at the BTC pair, there could well be much further to go once we break out from this structure and surpass the ATH.
There is a recurring pattern of U shaped reversals that follow what ETH has done. Volume is a good indicator to check out the level of accumulation happening, and of course S/R levels.
Some other ones that share this characteristic are:
QKC
ONT
NULS
NANO
DASH
LTC
Notice that aside from the last two, almost nobody is shilling these on CT
Now that funding has been reset, let the run continue. I believe we have a ways to go
ONT

ONTUSDTHello to you all. Mars Signals team wishes you high profits at all times.
The price has a lot of correction and has hit a good support point, the possibility of a price return is high.
Warning: This is just a suggestion to you and we do not guarantee profits.
Wish you luck!

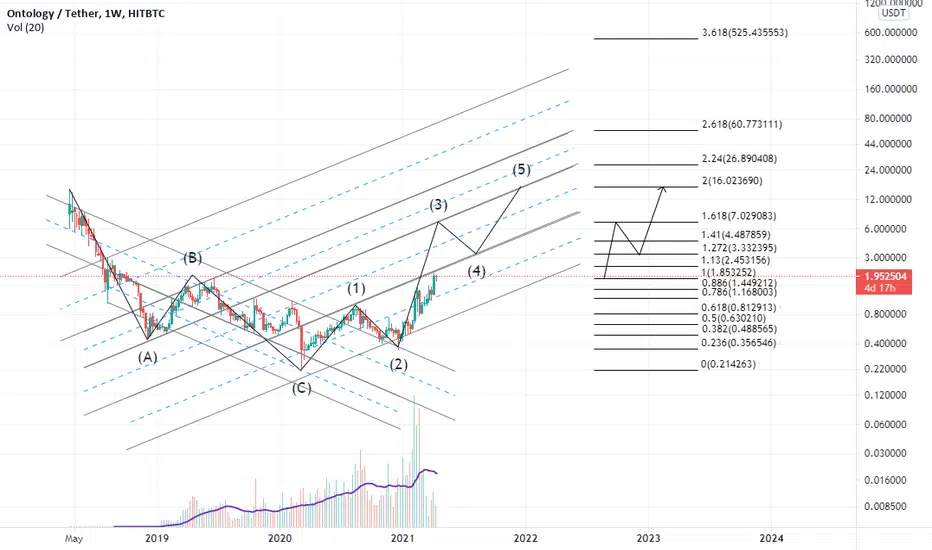
Weekly ONT on a logarithmic scale, with a lot of potentialTechnical analysis regarding the price of ONTOLOGY in relation of dollar Tether for the next scenarios, based on weekly movement.
On a logarithmic scale, the asset reduces the representation to a scale that is easier to view and analyze. The distance between one point and another is% of the total. That is, the distance between 1 and 2 is 100%, which will be the same distance between 10 and 20, between 100 and 200 and so on.
disclaimer
*** In accordance with CVM Instruction No. 598, of May 3, 2018, Art. 21, I declare that the recommendations of this analysis reflect solely and exclusively my personal opinions and perceptions and that they were prepared independently and autonomously. Not being considered a purchase and/or sale recommendation. ***
Any questions do not hesitate to contact me. I'm happy to be able to help you in the best way I can. 🙏

ont in april 2021hi there everyone, amount by now is 2.33 and because of the great fundamental news of ONT in 'Month' time frame can achieves 3$
what do u think.
I bought it in 2.32$

ONT looks good in day graph as other long term charts.If you look to the chart of 1W and 1M you will see a massive desirous CUP.
I've been waiting for long times to see ONT's breakout.
It seems like it has broke the resistance level and keep moving on the upside of bollinger bands.
If market keeps going like that, ONT may go higher and higher. It may finish the CUP formation before we wait.
But as I said you should know how risky market is. If dominance and total2 charts does not move as we want, then we have to stay away.
This is not a financial advice and please DYOR carefully.
I will be very appreciated if you leave a comment.

ONT try to flip strong resistance ONT / USDT
on high time frames we can see its just starting to flip strong resistance since 2018 into support also volume is strong and possible gaint C&H pattern
If the bulls successed in flipping this strong resistance into support we will see more nice upward movements for ONT
Keep your eyes on it


$ONT - The awakening?Key points:
Volume is increasing.
Important resistance - high chances of flipping it.
TP1 short-term - 50% run.
TP2 juicier, mid-term - 300%.
Project still delivering.


Go ahead🔥Hey, folks🔥
There is one more consolidation zone for today.
There is Symmetrical Triangle formation on ONT/USDT crypto pair.
The price had bullish sentiment before consolidation.
According to Elliott Waves theory all the waves are done and now price is heading to the breakout.
Follow the chart and look for the breakout carefully.
_____________________________________________________
If you enjoy my FREE Technical Analysis , support the idea with a big LIKE👍 and don't forget to SUBSCRIBE my channel, you won't miss anything!
Feel free to leave comments✉️
And always remember: "we don't predict, we react".


Ontology is a $16 cyphercypher harmonic pattern:
B=0.38 A
C=1.41 B
tp1=1.27 C=$3.33
tp2=0.78 A=$7
tp3=2 C=$16


BULLISH IDEA FOR ONTNot an investment advice but I am bullish on ONT. Did only 3x so far while others 10x plus.. I think ONT has more potential to have another rally than many others.

ONT will be $8 + at the end of 2021Keep this on your wall. Some of you remember me from 16 August 2020, Ltc .I sold all mt ltc and bought ONT with the average fee 1,87. Good luck see you at the end of 2021


Spot - Future /Long - ONT\USDT ONT-USDT
Future LONG or spot
X20-X25
Target 1 : $2.5
Target 2 : $4.4
Target 3 : Will update soon
Target 4 : Will update soon
Chart : Ascending Chanel.
SL - no SL

ONT/USDNot a huge fan of the bearish divergence here, but this is a bull market! Time to start running soon!
I wouldn’t be surprised to see a break - retest - and run to T1...
Do your own research and the isn’t FA :)
GOOOD LUCK!

10$ ONT is coming This giant cup will break and will directly go to $10 as there is no resistance after this.
Make sure to keep the stop loss intact if btc breaks down all these alts patterns will be invalidated

