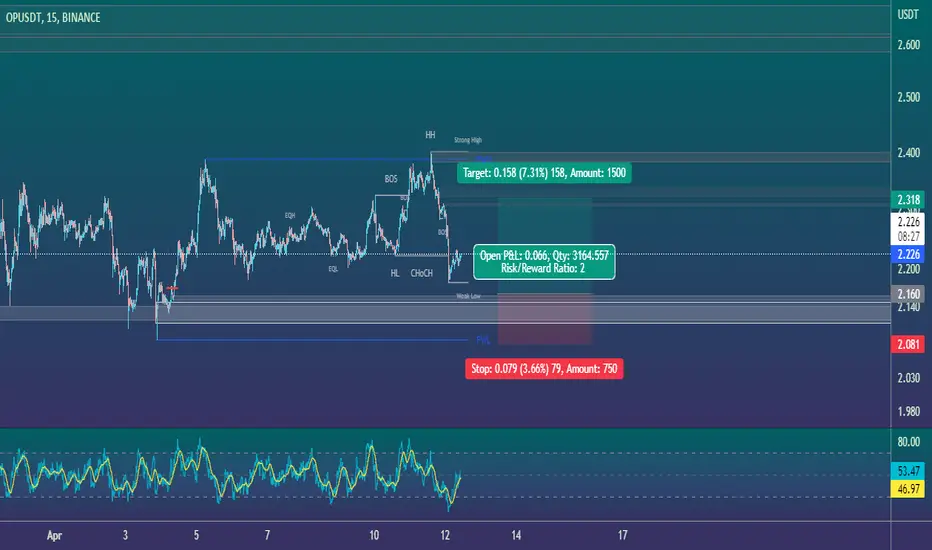
Op Looks ready For Another 45 to 50% Bullish Wave Seems Like Getting Ready for Another Bullish Impulse Formed Falling Wedge In h4 tf incase Of breakout expecting 45 to 50% bullish Wave
OP

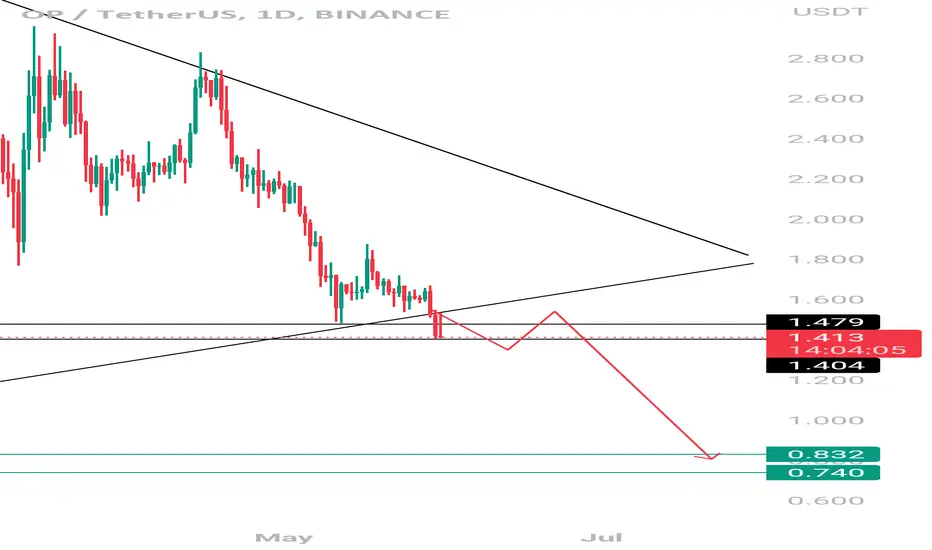
OPTIMISM OPUSDT Price analysis (Daily)Greetings, esteemed traders of the TradingView community!
Today, we bring to your attention the price of OPUSDT. Since reaching its all-time high (ATH) back in February 2023, the price has experienced a significant decline of approximately 50%.
However, recent price action has caught my attention as OPUSDT has started to break out from a red trendline, which has been forming since the bottoms observed in 2022. This breakout holds potential for a continuation in the price's downward trajectory.
Furthermore, a triangle formation that developed between February and April of 2023. The triangle pattern was broken to the downside, and the target of this pattern aligns closely with a previous resistance zone around the range of 1.3-1.4 USD.
Considering the oversold conditions indicated by both the MACD and RSI indicators, it becomes quite likely that we may witness a rebound in this aforementioned price zone. This presents an intriguing opportunity for traders to explore.
Thank you for your attention and support. Feel free to explore our other articles, follow our page for more updates, and kindly share your valuable feedback on this idea. Happy trading!

OP/USD - Long Scalp OpportunityOP/USD - Bullish Harmonic
Long scalp - Targets shown on Chart.
Good luck!

OPUSDT.1DHello dear friends,
*Mars Signals Team wishes you high profits*
This is a daily time frame analysis for OPUSDT.1D
We are in the daily time frame. As you can see, the price is moving towards our support line and we expect it to support the price and move towards our first resistance line. But if it cannot stabilize above the line and penetrates below the support line, we expect a fall to the second support line.
Warning: This is just a suggestion and we do not guarantee profits. We advise you to analyze the chart before opening any positions.
Take care

Op another breakdown Opusdt
As we predicted in previous analysis op rekt
This time I am expecting another leg down
Op needs to bounce back from this zone otherwise another 20-30% drop expected
Dyor
OP ANALYSIS (12H)Hi, dear traders. how are you ? Today we have a viewpoint to BUY/LONG the OP symbol.
For risk management, please don't forget stop loss and capital management
When we reach the first target, save some profit and then change the stop to entry
Comment if you have any questions
Thank You

OP (Y23.P2.Video1) The story continues. The next entryHi traders,
This chart is not the most bullish structure of recent as we approach the most critical level for OP to be macro bullish. As long as BTC doesn't drop hard and with a slight possibility to continue up from where we started 2 days ago, then OP has a chance as well.
We look at the key levels and why they are important.
Please give me a like and share,
Regards,
S.SAri

analysis OPUSDT tokenThis token is currently in a downward trend
Step entry points are marked
Don't forget capital management

OPUSDTOP Falling Wedged waiting for breaking out, Stop Lost -12% (SPOT), Possible 60% profit on Spot or 120% profit with 2x Leverage.

OP / OPTIMISM . 5$ soon or higher ? Let's checkParallel bullish channel + symmetric triangle which was broken for retail trader , for me it was liquidity , we catches their's SLs and stopped on the order block. OB is located on 0.5 FIB of the last wave . Waiting for bullish movement in near future

5 Altcoins Analysis in 1 Video 📹 OKXIDEASDear TradingView community and fellow traders,
I am Richard, also known as theSignalyst and here is my fourth OKX contest submission => OKXIDEAS
Today I will be going over 5 Altcoins Analysis => OKB, ARB, OP, APT, and NEAR.
Let me know which altcoins would you like me to cover next.
Hope you find this video useful. It's important to always adhere to your trading plan, including entry points, risk management strategies, and trade management techniques.
All Strategies Are Good; If Managed Properly!
~Richard
Disclaimer: The information provided is for educational and informational purposes only and should not be considered as financial advice. It is important to do your own research and make informed decisions before entering any trades. Past performance is not indicative of future results. Always be aware of the potential for losses, and never risk more than you can afford to lose.

long OPNASDAQ:OP bounced off the support level. Bullish movement to resistance level at 2.77$ is likely to happen.


OP NEW UPDATE Hi, dear traders. how are you ? Today we have a viewpoint to BUY/LONG the OP symbol.
For risk management, please don't forget stop loss and capital management
When we reach the first target, save some profit and then change the stop to entry
Comment if you have any questions
Thank You

OP/USDT🔵🐇 #OP/USDT
🪄OP Position Based On Fresh Liquidity and Order Blocks and Structures
#Trade #eth #btc #bitcoin #ethereum #cryptocurrency #crypto #Trade #trading #Trader #Signal #forex #Scalp #altcoins #chart #RTM #ICT
@aliceinmoneyland

OP/USDT🔵🐇 #OP/USDT
🪄 OP Scalp Position Based On Fresh Liquidity and Order Blocks and Structures
#op #Optimism #eth #btc #bitcoin #ethereum #cryptocurrency #crypto #Trade #trading #Trader #Signal #forex #Scalp #altcoins #chart #RTM #ICT
@aliceinmoneyland
OP trading inside an ascending channelOP trading inside an ascending channel
Keep eyes on it, along with BTC movement!

OP LongOP Long on low time frame of 5 min and it is showing trend continuation with hidden bullish divergence on 3 mins

Optimism technical analysis, I think it's excellent Optimism After technical analysis, I think it's excellent for the near future long, not for the recommendation of course.
BINANCE:OPUSDT.P

Optimism for me .BINANCE:OPUSDT.P
Optimism After technical analysis, I think it's excellent for the near future long, not for the recommendation of course.

Op Getting Ready For Another Bullish Move Seems Like getting ready for Another Bullish impulse
formed Bullish Pennant In daily timeframe Incase Of Breakout expecting Another 70 to 80% bullish move

short OP$OP bounced off the resistance level. Decline to support level at 1.79$ is likely to happen.

Whether it can rise along the rising channel is the keyHello?
Traders, welcome.
If you "Follow", you can always get new information quickly.
Please also click "Boost".
Have a good day.
-------------------------------------
(OPUSDT chart)
The HA-High indicator on the 1W chart formed at the 2.498 point.
Therefore, if it fails to rise above 2.498, it may lead to further declines, so we need to think about countermeasures.
However, since the MS-Signal indicator of the 1W chart is passing around 2.045, you need to check whether it is supported around the 2nd section of 1.828-2.045.
The tertiary range, 0.919-1.129, is a strong support and resistance range.
It is currently in a downtrend from the uptrend channel shown on the 1D chart.
Therefore, I think it is becoming important whether it can rise above 2.498.
-------------------------------------------------- -------------------------------------------
** All descriptions are for reference only and do not guarantee profit or loss in investment.
** Even if you know other people's know-how, it takes a considerable period of time to make it your own.
** This is a chart created with my know-how.
---------------------------------
