Oil Short term correction?....we shall seeLooking at it from a technical analysis, if the price of Oil makes that "double dip" (W) with the RSI or MACD having a higher low on the second dip, we may be looking at the price of oil potentially breaking out of this uptrend channel and creating higher highs. Ofcourse, the fundementals of an increase in US production and from OPEC may drive prices below the uptrend channel for lower lows.
Opec

USOIL Bulls Eyeing For Next Resistance?Good day Traders. As of today, USOil rallied after reports citing that Saudi Arabia, Other OPEC and non-OPEC allies would extend on cutting oil supplies until the end of 2018 however were ready to make gradual adjustments in the event of any supply shortage. From my recent post, USOil is still in a clear uptrend and price was sitting off to key support with yesterday's Doji Indecision candle still waiting for long confirmation entry. Now, Bull's are eyeing next psychological price resistance $72.84 if today's EIA Crude Oil Stockpile report declines than expected.
for more update, kindly visit my blog:
livetotradefx.blogspot.com

US Oil Did Slide Towards Near SupportIn relation to my previous post, the market did correct and slide towards near term support $69.55 following OPEC and Russia's statement to meet shortfall in Supply from Venezuela and Iran.

Chart pattern signal shows price of Crude Oil to go higher.Long term view. The chart patterns in the ellipses are occurring twice in the last 9 years, first in 2009, and now again from end of December 2017 to present day, and as we see that cycles repeat, expectations are the price of Crude Oil to go even higher against $80 - $100 per bbl. And it is not the technical analysis that appoints to this scenario happening, but also yesterday we got very clear vision for the future price directly from Saudi Arabia, officials stated Saudi Arabia needs price of oil to get to $100, and considering they have the power to adjust the production output in partnership with OPEC members and also non OPEC members in accordance with the demand and risks occurring around the oil markets, we can expect positive months for the oil markets to come. As the price makes correction to the downside buyers are emerging on levels below $65 and $63. As we expect that the price will rise, it has probability of going up gradually with resistances occurring close to these levels: $70, $72, $75, $80, $92, $96.
Link for a video analysis for the Oil.
www.youtube.com
Link for the OPEC's price hawk vision.
www.reuters.com
Risk warning!
---------------------------------------------------
Trading carries a high level of risk to your capital and may result in losses that exceed your initial deposit. You should first be aware of the risk and know what you do before you proceed with trading. Supplied information is not advice.

USOIL/NATURAL GASEveryone is very bearish on natural gas because of the rising production coming out of Canada, and the United States. Although natural gas is bearish to moderate in price action, I believe that over time it will play a more pivotal role in the energy system than crude will. Natural Gas is holding up fine, and the price action in 2012 may prove to have been a pivotal time in the future.

Crude Oil at resistance. Crude Oil at resistance level, going above 61.535 opens the upside to 63.60/64. Buy on daily close above 61.535. Attention to fundamentals, inventories, and OPEC before decision is made.

WTI- The Breakdown of USOILFOREXCOM:WTIUSD COT Reports Show Bearish Price Forcasting in the Near Future. Will Crude Break Below the $60 handle shortly? Techincals Suggest yes as well


Woodside Petroleum shareprice surge?With OPEC looking likely to raise the official oil price as oil fracking in the U.S starts to slow & the Saudis cutting oil prices, a surge in the price of most oil & petroleum companies is almost guaranteed. But the question is "how soon?". Looking at the current price of WPL and past chart patterns show that the price surge could be very, very soon.


Hedge funds don't buy into OPEC cutsUS Dollar
Greenback gradually turns into an offensive although a buildup of longs on US currency looks quite cautious showed a pullback during the Asian session. Futures for the dollar index are planning a march to the level of 93.50 thanks to the efforts of Republicans to pass the fiscal bill and slightly biased in the positive side US data. Macro figures shows steady pickup in US manufacturing sector and some subsidence of the consumer sector, but the first is more legible in tracking economic effects, demonstrating the sustainability of the country's economic growth.
Republicans of the Senate and the House of Representatives have to reconcile their versions of the tax reform and the market believes that it won’t be a problem. A large part of tax cuts intended for corporations is postponed until 2019, so investors are increasingly skeptical about stimulating effect of the reform. For example, Goldman Sachs considered that the continuation of global recovery next year will lead to capital flows into emerging markets with higher yields that will become a hard test for the dollar. To offset an appeal of foreign markets, the Fed will have to accelerate the rate of increase in borrowing costs, but inflation below the target level of two percent ties hands to the regulator. According to Trump's plan, the dollar should be cheaper to stimulate exports, making US products abroad cheaper. Therefore, in long-term rally of the dollar there is more and more doubt and investors are in no hurry to price into the dollar a more aggressive Fed next year.
US trade deficit in October was the highest in last nine months due to rising oil prices, as well as a failure in competitiveness with major trading partners - China and Mexico. And this is despite the fact that US exports to these two countries have reached a peak of three years. Donald Trump has more and more arguments to enforce his protectionist initiatives, which is a time bomb in US political relations with trading partners.
According to the report of US government, foreign trade accounted for 0.43 percentage points from the growth of 3.3 percent of GDP in the third quarter. According to the Trump administration, eliminating the skew in trade together with tax breaks can bring the rate of GDP growth to a stable trajectory of 3%.
British pound
The British currency has sharply lost a bullish aim, as news on progress of talks on the EU deal last week was again replaced by reports of sticky dissent. Moreover, on Wednesday the British TV channel reported that the police could prevent an attempt on Prime Minister Teresa May, which indicates that the course taken by the conservatives to find trade-off with the European Union can have a strong opposition. Bearish pressure led the GBPUSD pair to the level of 1.3370, and a breakdown at 1.3350 would likely signal a signal for further decline.
The oil market
Optimism after OPEC has come to naught and now investors are shifting focus to the dynamics of American production, which has already reached parity with Saudi Arabia and Russia. The emergence of a third major player in the market that does not contact OPEC creates depressing prospects for a global supply, so investors are trying to analyze the demand side for positioning. Brent and WTI lost more than half a percent on Wednesday and are likely to find support somewhat lower before investors consider long positions. The API report released on Tuesday showed mixed dynamics - crude oil stocks fell sharply, while reserves of gasoline and distillate rose, which indirectly speaks of saturation of the domestic market after a shortage due to natural disasters.
Arthur Idiatulin


Brent OIL - The fundamentals..With the fundamentals looking bullish, I am looking at a price rally reaching $70.00 by the end of Q1 2018 or mid Q1 2018

#Crudeoil Could End Lower Near-TermCrude Oil Brief
Crude oil has been strong of late and has gained nearly 30 percent over the last four months. Much of this has to due with the exporting of crude and products which has dramatically lowered inventory stocks - overall stocks the lowest since March 2015.
However, we are heading into a seasonally weak period for energy products, and inventories could begin to build. Moreover, US production has recovered from both hurricanes with producers producing over 9 m/bbl per day.
Market sentiment on inflation has also aiding in bidding prices up, but we think there will be an inflection in 5- and 10-year breakevens. This could put pressure on crude as higher inflation hopes begin to wane.
Technically, price is beginning to reject a key technical supply zone between $55.33 and $54.09. This has been a point has been contested three prior times going back to 2015, and each failure to break through has caused hefty pullbacks.
TrendFlex Active score is moderately bullish in regards to trend, but price momentum and volatility range is contracting.
Potential downside targets for crude are $51.94 and $49.01.
For more free commentary and analysis, or questions on our up coming products for retail traders, follow @macro_view on twitter or message us on Trading View.

Crude Oil Brent: UKOIL Looking to close out on test of 63.80UKOIL: Crude Oil Brent Update
In the last comment stops were raised to just under 60 as we continue to run this long-pull swing trade to its conclusion,
which may happen on Tuesday coming. The low yesterday was 60.01, so it came within 6 pips of stopping out before rallying once
more. A damn close run thing, as Wellington said of the battle of Waterloo.
Still looking to close out on the fourth strike of the upper parallel that's controlling this entire up-wave, around 63-80 to
64.20 range, if struck. If not will probably close out just before the Opec meeting on Tuesday coming.
Long-time readers may remember we ran with the last Spring rally earlier this year right up to the morning of the Opec
meeting on 24th May, selling right off the highs at 54 and then buying back at 44 and then again at 46 for the current rally.
Selling on the news, well just before it, may well prove to be right thing to do again. Ideally, Brent will hit the upper
parallel around 64 and that will be time to exit with 1800 pips of profit (with 30 pips of original risk) on a 4 month trade.
(Try making those profits on Nasdaq, cowboy) Otherwise will likely sell before Opec (on Monday night).
Of all the 100,000's of financial instruments out there from Bitcoin and other less reliable fiat currencies through to bonds
and stocks no instrument trends like Big Oil. Nothing is so wave-like, trend-like, or, usually, so helpful to traders.
If anyone knows a better complex to trade than Big Oil, from a technical perspective, please message.
The stop has to stay under 60 for now.


Fading chances of Yellen to retain the postOil market
WTI declined on Wednesday but Brent continues to grow, fluctuating about a month's high, as Saudi Arabia said it is determined to end the supply surplus that has been holding prices for the third consecutive year. Energy Minister al-Falih said that the kingdom will do everything necessary to reduce oil reserves in industrial countries to an average of 5 years, letting investors know that the oil pact may have to be prolonged in order to achieve equilibrium in the market.
The data of OPEC and the International Energy Agency convince in reducing excess reserves and the positive dynamics of demand next year, but prices still can not overcome the $60 mark for the barrel, mostly due to the fact that even prolongation of the pact will not be able to offset for the production of American shale companies. Since early January, OPEC, Russia and other major oil producers have agreed to cut production by 1.8M bpd. The agreement expires in March, but officials are intensively resorting to encouraging rhetoric to keep the market's hopes for an extension of the pact.
The API data released on Tuesday showed that the US storage reserves gained 519K barrels, while the consensus assumed a decrease of 2.6M barrels. The reserves of gasoline decreased by 5.8M barrels, with a forecast of 17.000, which indicates a pickup in the pace of refining in the US.
Dollar
The dollar remains stable around a three-week high, looks particularly confident against the Japanese yen, fueled by rumors about the appointment of economist John Taylor as head of the Fed. It is worth noting that Janet Yellen adheres to all the most dovish policy views, so news about any other favorite will be a bullish signal for the dollar. The term of Yellen expires in February 2018.
Euro
Volatility in the European currency is growing before the ECB meeting in which Mario Draghi should accept a reduction in the volume of bond purchases, as well as determine the duration of the changed program. The volume of purchases can be reduced to 20 billion euros per month (hawk scenario), 30 billion euros a month (moderate) and 40 billion euros (dovish scenario). However, the main issue that investors will be concerned with is the timing of the extension of the program, which will determine the future of euro. It is worth noting that the medium-term correction for the European currency is becoming an increasingly relevant scenario.
The pair EURUSD continues to struggle for the level of 1.18 on the eve of the most important meeting of the central bank for this year.
Australian Dollar
The Australian dollar sank 0.8% against the dollar after the release of lackluster data on consumer price growth. The Central Bank of Australia has two options - to hope for tightening of the Fed's policy as a factor in further weakening of Australian dollar, or start lowering rates independently, moving in the opposite direction compared to other global counterparts.
Pound
The sudden increase in economic growth in the UK outlines the way for the Bank of England to raise rates for the first time in a decade.
The pound rose on Wednesday, thanks to GDP data, which showed stronger growth than forecasted. The dynamics of the output turned out to be the best in a year, which surprised economists and gives hope that the regulator will be less hesitant about tightening monetary policy to protect the purchasing power of the nation. Earlier, the head of the Bank of England, Mark Carney reported that the acceleration of inflation may force to raise rates, which sent the pound to 1.36 against the dollar. Then the British currency pulled back but before the meeting in the next week again gains popularity. The GBPUSD pair strengthened to 1.33. The decision to raise the rate probably still has the bit of surprise but further growth of the pound can be expected only with aggressive regulator rhetoric, which is unlikely.
Arthur Idiatulin

From Bitcoin to Crude Oil. Plan for this week.Hello everybody!
The last week was difficult and everything was fine at the same time, bot not about the bitcoin. Public Joint Stock Company "MegaFon" issued 500 millioin rubble bonds last week and the entire issue was purchased by Raiffeisenbank. This was another very important reason for a huge jump-up of the price of bitcoin. For this week, I will make an analysis of the cryptocurrency, because you definitely need to make reasonable forecasts and analysis.
Tomorrow will be published U.S. crude oil Inventories report and this is one of my favorite trading days. Coz’ we always earn) just look at how the forecasts worked from last week. Tomorrow, I invite everyone to my live trading session webinar about crude oil reserves. Links for registration can be found on all my pages in social networks and on my main profile page
Sincerely, Kate Wess

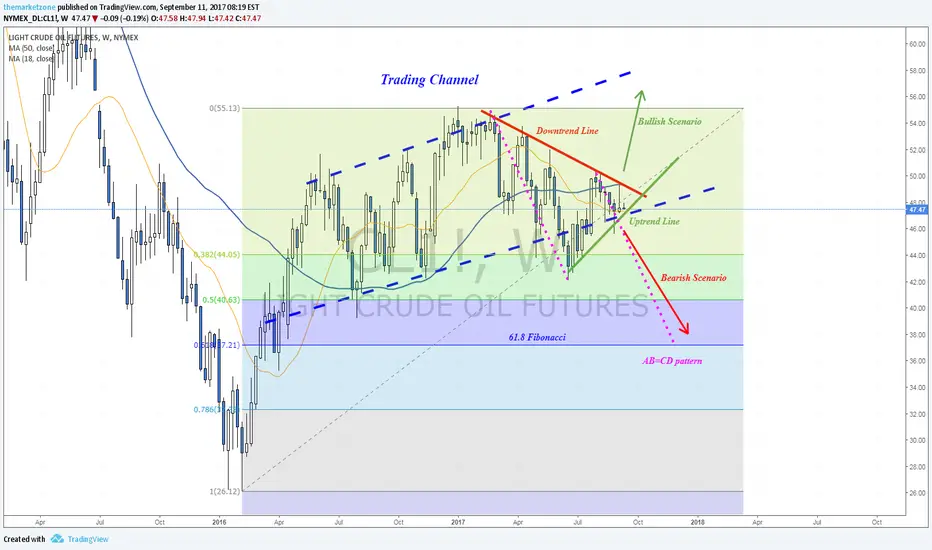
Oil's analysis towards OPEC meeting (September 22nd)Oil is trading inside a weekly trading channel.
The price is testing the bottom of the channel and a weekly uptrend line.
The price was rejected by a weekly downtrend line
Bearish Scenario - In case of a bearish breakdown, Oil can reach to the 61.8 Fib level to complete a bullish AB=CD pattern
Bullish Scenario - In case of a bullish breakout, Oil will probably climb towards the top of the channel.
More analysis? More Trading Scenarios?
@themarketzone on Twitter/Facebook/Instagram
TODAY. MY "CRUDE OIL" TRADING SHOW.Just have a look at this! It happens very rarely and I have to tell you about it. There are 3 reasons why the price should fall:
1. Technical analysis, trend line occures as the resistance level on the daily chart.
2. Today news reports about US crude oil reserves will be published and there are negative forecasts.
3. If the price grows, it is not known how long will the growth continue, if down, then we have an extra 400 PIPS till the next level.
PS: let's look at it today on a live session, have a discussion, plug in microphones and come to my online trading webinar! Waiting for you there

it's already begun!My dear friends who follows my recommendation please take it into account!
And have a good week!

New vision of the U.S. Crude OilI was wrong last week and my mistakes costs money. Now I believe in my forecast and all the movements will happen next week.
Sell : From Monday till the end of the week.
