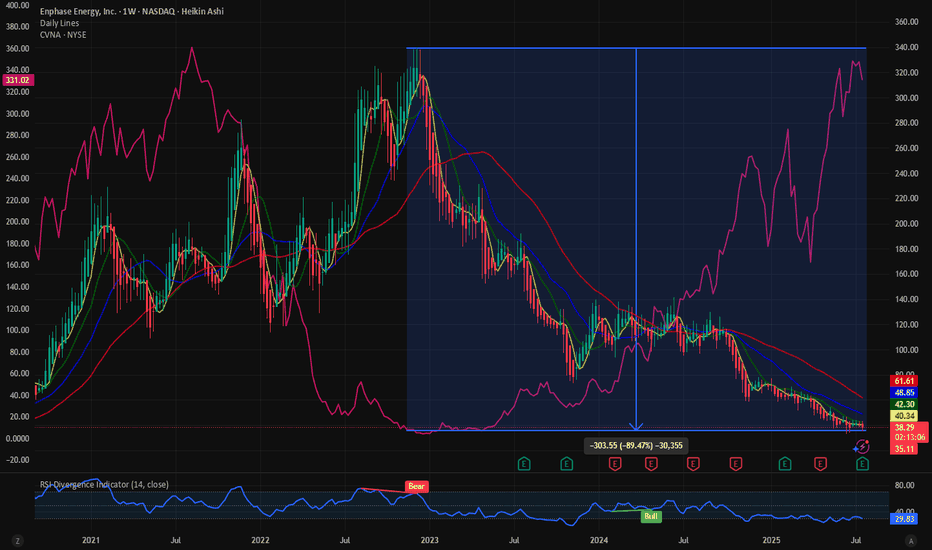
$ENPH:Clean energy stock and messy chart. Short squeeze incomingThe clean energy stocks are in a serious drawdown. NASDAQ:ENPH has a very messy stock. The stock has seen almost 88% of its value wiped out over the last 2 years. But is it the end of clean energy and stocks? With the new administration in place the clean energy stock has been in a bearish pattern.
In terms of the drawdown the stock looks the same as $CVNA. At its lowest NYSE:CVNA had 98% drawdown. NASDAQ:ENPH is down 90% and maybe it must go through a similar drawdown then the price must drop down to 10$.
Currently 21% of the NASDAQ:ENPH shares are sold short, and the short interest ratio is 3.77. These numbers indicate that there might be a danger of short squeeze with 21% of the shares sold short and it might take 4 days for the shorts to cover the positions. This is more than the current short squeeze candidate $OPEN. But is this a good time to buy?
In my opinion the price of NASDAQ:ENPH has some more room to downside. Out target is with price between 20$ - 10$ we can go long NASDAQ:ENPH
Verdict: More downside possible in $ENPH. Go long between 20$ -10 $. 21% Short interest.
Open
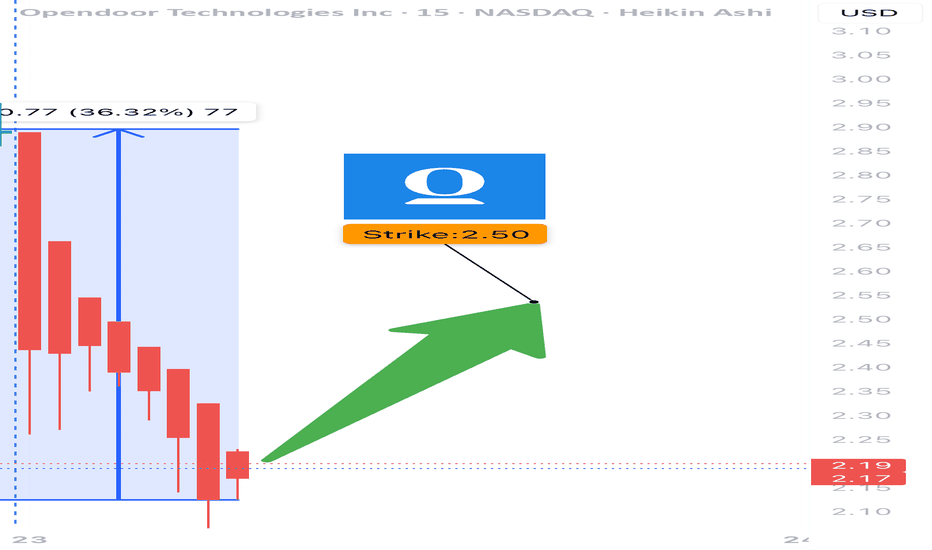
OPEN WEEKLY TRADE SETUP — 07/23/2025
🏠 OPEN WEEKLY TRADE SETUP — 07/23/2025
📈 Volume Surge + Call Flow = Bullish Bias Confirmed
⸻
🔍 MARKET SNAPSHOT
All major models signal STRONG WEEKLY BULLISH bias, supported by:
• 📊 Weekly RSI = 85.9 (RISING) → 🚀 Momentum confirmed
• 📉 Daily RSI = 83.3 (FALLING) → ⚠️ Overbought zone, short-term pullback possible
• 📈 Volume Ratio = 6.7× Last Week → Big accumulation
• 🔁 Call/Put Ratio = 1.35 → Flow favors upside
• 🌪️ VIX = 16.1 → Normal regime = Clean premium action
⸻
🎯 TRADE IDEA — CALL OPTION PLAY
{
"instrument": "OPEN",
"direction": "CALL",
"strike": 2.50,
"entry_price": 0.26,
"profit_target": 0.39,
"stop_loss": 0.13,
"expiry": "2025-07-25",
"confidence": 80%,
"entry_timing": "Open",
"size": 1 contract
}
⸻
📊 TRADE PLAN
🔹 🔸
🎯 Strike 2.50 CALL
💵 Entry Price 0.26
🎯 Target 0.39 (+50%)
🛑 Stop Loss 0.13 (risk control)
📅 Expiry July 25 (2DTE)
📈 Confidence 80%
⚠️ Risk High gamma + overbought daily RSI
💡 Size Tip Keep risk to 2–4% of account capital
⸻
🧠 MODEL CONSENSUS
• ✅ All models agree: Weekly trend = UP
• ✅ Heavy call flow centered around $2.50
• ⚠️ Caution on timing: falling daily RSI = maybe wait for early dip?
⸻
💬 Drop a 🟩 if you’re riding OPEN
📈 Drop a 🕒 if you’re waiting for the dip
🚀 Looks like momentum wants to go higher — but gamma’s real, manage tight!
#OPEN #Opendoor #OptionsTrading #CallOptions #WeeklySetup #BullishTrade #GammaRisk #VolumePlay #TradingIdeas #AIPoweredAnalysis
Trump firing Jerome is bullish for $OPEN - Trump firing Jerome is bullish for physical assets like real estate, gold, materials.
- Trump would most likely appoint a FED chair which will lead to lower interest rates.
- Lower Interest rates (Macro tailwinds) + Improving business model (fundamentals) + technical breakout = 🚀
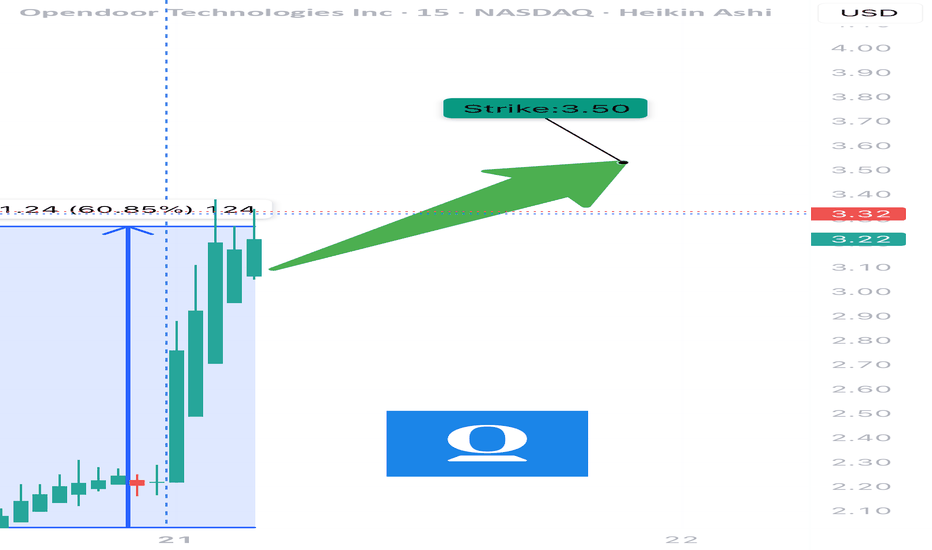
$OPEN WEEKLY TRADE IDEA – JULY 21, 2025
🚨 NASDAQ:OPEN WEEKLY TRADE IDEA – JULY 21, 2025 🚨
🔥 Massive Bullish Flow + RSI Explosion = Momentum Play of the Week!
⸻
📊 Trade Details
🔹 Type: Long Call Option
🎯 Strike: $3.50
📆 Expiry: July 25, 2025 (4DTE)
💰 Entry: $0.81
🎯 Profit Target: $1.62 (💯%)
🛑 Stop: $0.49 (🚨40% risk cap)
⚖️ Confidence: 80%
📈 Size: 1 Contract (2–3% account allocation)
🕰️ Timing: Enter Monday Open
⸻
📈 Why This Trade?
✅ Call/Put Ratio = 2.26 (🚀 Bullish bias)
✅ RSI (Daily: 93.6 / Weekly: 81.4) = 💥
📊 Weekly Volume = 2.8x average (🔥 Institutional interest confirmed)
🧨 Call Flow Dominance: $3.50 strike leading in premium activity
⚠️ Gamma Risk: Moderate – Expect possible spike
⏳ Theta Decay: Manage exposure! Only 4 DTE.
⸻
🧠 Model Consensus:
🟢 STRONG BULLISH SIGNAL
⚠️ RSI EXTREME – quick profit taking or tightening stops may be necessary
📌 Most models = 85–90% confidence, a few warn of overbought signals
⸻
💡 Strategy Tips
🔸 Use tight trailing stop if spike occurs early
🔸 Lock profits >30–50% if reversal candles print
🔸 Avoid spreads – naked calls favored for gamma exposure
⸻
🏁 Verdict:
This is a momentum-fueled gamma squeeze setup.
NASDAQ:OPEN 3.5C – Risk $0.49 to make $0.81+
Fast move expected. Don’t blink ⚡
⸻
#OPEN #OptionsTrading #CallOption #WeeklyPlay #TradingSetup #GammaSqueeze #FlowBasedTrade #UnusualOptionsActivity #modntumstocks
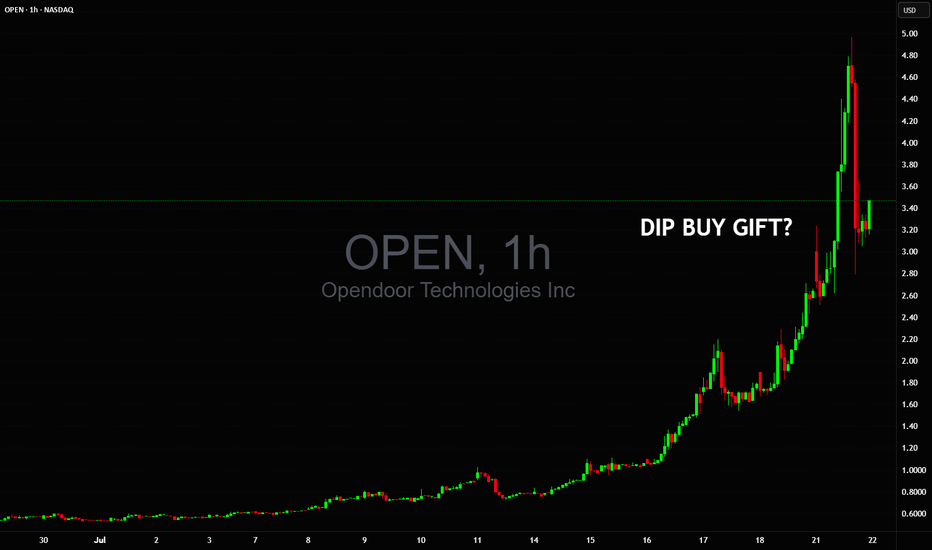
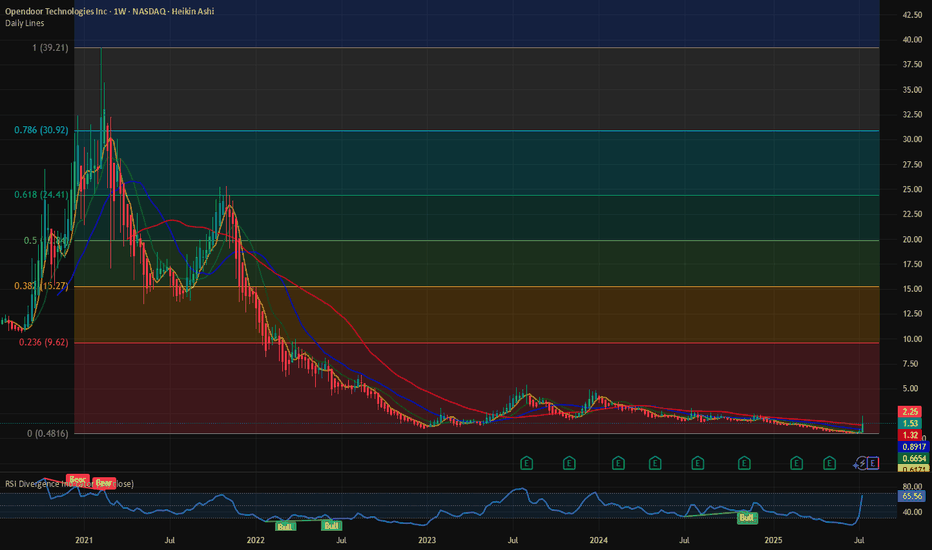
$OPEN: Ongoing short squeeze. What are the Fib levels telling? Are these the sign of a mature bull market? Drone cos, Space cos, SPACs, Biotech and Penny stocks are rallying. NASDAQ:OPEN is one such stock which hit the lowest of 0.5 $ last week before rallying more than 200% until July 18, 2025. NASDAQ:OPEN has a high short interest of almost 20% and short interest ratio is only 1.8 days to cover. Which means with 20% of the float short and the shorts needing 1.8 days to cover it might be ripe for a short squeeze if there is coordinated action by the bulls and a lot of call buying.
This might be a repeat of the meme stock rally scenario which we saw in 2021. But irrespective of the short situation from a technical standpoint what are the charts telling us. We go back to the tried and tested Fib Retracement levels to check the next price levels to watch for.
In my opinion the next price level to watch will be 9$ which might be a psychological level too. Many fund managers can only buy stocks if they are only above 10$. So, at that price we might see sellers offloading their gains. With next earnings call on Aug 5th and the Wallstreet bet crowd having a firm hold on the stock, we might see some explosive price action in the days and weeks to come before this settles The RSI is @ 60 which is not overbought, we can easily see 9 $ by end of summer if the social buzz continues.
Verdict: Buy NASDAQ:OPEN or Hold on to it if you have it. Offload some @ 9$.
LONG ES after London Open*I like the long better for london open.
From 6000, weak liquidity built up above, Finished business below, macro SMAs buy bias...
HOWEVER there is also a good case for shorts as we are heading up into futures open, SMAs and there is LVN space below to squeeze into. So... I will be looking for finished business RISK and test/acc ENTRY as outlined there and targeting the weak liquidity above. Given the SMAs above etc, i doubt price will rush up, so take your time and get that test to confirm.
And as always if its not there DONT chase. Patience.
Opendoor Technologies | OPEN | Long at $0.60Opendoor Technologies $NASDAQ:OPEN. This is purely a swing trade for a company that has been posting declining earnings and revenue since 2022 and does not anticipate becoming profitable in the next 3 years. Since the stock is now under $1, it's at-risk of being delisted from the Nasdaq. I am entering this play because there is a chance the recent price hit near $0.50 may be a temporary bottom and there is enough short interest (near 18%) for a spike near its book value of $1.00. Quick ratio is 0.75 (i.e. company may have difficulty meeting its short-term obligations without selling inventory or acquiring additional financing). While the company may be forced to do a split (a major risk for this purchase), I can see other eyes viewing this as a potential "quick play" for a reversal near its book value.
At $0.60, NASDAQ:OPEN is in a personal buy zone for a swing trade.
Targets:
$0.87 (+45%)
$1.00 (+66.7%)
OPEN TARGETS!COINEX:OPENUSDT Suggested Signal . . .
You can buy some on the red supports for a profit of 40,000%.
Dont Forget To Follow And Boost!
OPEN - Falling Wedge on the Daily ChartThe price has been fluctuating within a broad range but shows a general downward trajectory as indicated by FALLING WEDGE. There's a noticeable struggle to break above the supply zone, suggesting that any rally towards this zone might be met with selling pressure.
Market$ CorrelationsICEUS:KC1! Coffee Harvest in Colombia starts in October: Colombia is reported to produce 10-15% of the worlds entire coffee supply, the third largest coffee producer in the world! Speculating ICEUS:KC1! will be +MOVING ABOVE $260. I also speculate ICEUS:KC1! will support the Colombian index NASDAQ:NQCOMC to continue above its $726 highs. Lastly I don't see the present correlation between the NASDAQ:NQCOMC and the AMEX:SPY having a negative effect on the US economy; as it pertains to the fears of a USA recession popping up in recent headlines while approaching the Federal Interest rate decision in the days ahead.
GUMy Zones for GU this week is just some simple supply and demand zones and some liquidity zones. I will be watching orderflow closely when i enter trades since we begin to slow down a bit in price action and are in a range. I will be using the daily and weekly open as extra confluence as usual for my day-to-day setups and the zones for a Wyckoff schematic setup.
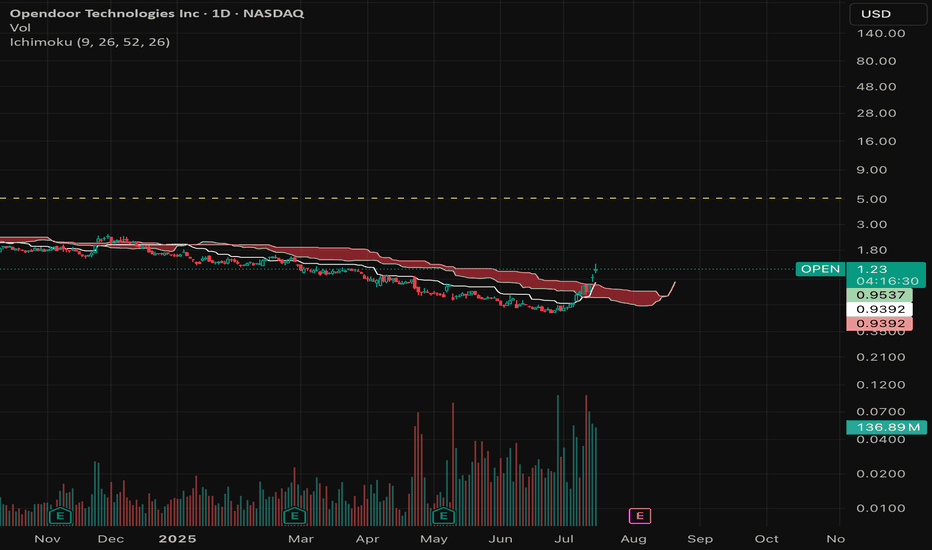
$OPEN Approaching Resistance at $5.30Opendoor Technologies has broken the falling trend channel in the medium long term and reacted strongly up. NASDAQ:OPEN is approaching resistance at 5.30 dollar, which may give a negative reaction. However, a break upwards through 5.30 dollar will be a positive signal.
The short term momentum of the stock is strongly positive, This indicates increasing optimism among investors and further price increase for Opendoor Technologies.
OPEN Opendoor Technologies Options Ahead of EarningsAnalyzing the options chain and the chart patterns of OPEN Opendoor Technologies prior to the earnings report this week,
I would consider purchasing the 2usd strike price Calls with
an expiration date of 2023-11-10,
for a premium of approximately $0.20.
If these options prove to be profitable prior to the earnings release, I would sell at least half of them.
Looking forward to read your opinion about it.
Opendoor Technologies entry pursuit As requested by a follower:
Opendoor Technlogies NASDAQ:OPEN
- Currently this is a high risk trade as we are reaching
oversold on the weekly and price is close to
overhead resistance
Positives and entry levels:
- Above 200 day moving average & sloping upwards
- A pull back to 200 day would be an ideal entry
- Break above the OBV resistance line could indicate
further push through
I would not be entering this trade unless we revisited the 200 day or broke through the OBV resistance.
Opendoor is a small $2.68bln market cap company aiming to make selling your home as easy as clicking a few buttons. There are a lot of unknowns in the housing sector however a new CFO was appointed in Dec 2022 and she seems to have the company back on the front foot which is positive. #opendoor
Opendoors mission statement:
Opendoor is an e-commerce platform for residential real estate that allows people to buy, sell and move online. Our vision is to build a one-stop shop that allows people to move with the tap of a button.
OPEN OpenDoor a Penny Real Estate LONGOPEN has earnings upcoming on 8/3. An analysis of the 4H chart with overlays shows
bullish momentum in the set of zero lag EMA lines as well as upgoing anchored VWAP
landlines. Price crossed over the mean VWAP ( thin black) and the POC line of the
volume profile one month ago. The MACD shows bullish momentum since July 24th.
The dual RSI indicator shows the low time frame green line rising and then crossing the
steady higher black time frame line the past trading day and both being at the 60
level.
OPEN is a long trade setup with earnings around the corner. I will take it.
