$ETH - Top DownBYBIT:ETHUSDT.P Top Down (10/06/25)
V-Levels Bias
Weekly = Bullish
Daily - Bullish
10-Hour = Bullish
1-Hour = Bullish
V-Levels Momentum
Weekly = Bearish FA
Daily = Neutral
10-Hour = Neutral
1-Hour = IB Range (Neutral)
DeCode Market Breakdown
Macro Context
Weekly Chart
Strong bullish MS, printing clean HHs and HLs.
Price has rejected from the same V-Level multiple times.
Rejections are paired with high relative volume and aggressive selling footprints → indicates strong passive interest above.
This area is not ideal for aggressive long entries.
Daily Chart
Still in bullish structure, holding above key POCs and range lows.
The Failed Auction at IB lows has added fuel for upside momentum.
However, we’re trading right into a potential liquidity pocket just below resistance.
Context calls for a wait-and-see approach: either clear breakout or rejection confirmation.
Intraday Picture (10H & 1H)
10H Chart
Still within an Inside Bar (IB) range.
FA at range lows suggests momentum continues upward — but we are at the top of the range.
Key risk: trap above range highs → ideal area for shorts if we get absorption and selling imbalance.
1H Chart
Market is rotating inside the current IB range.
No breakout confirmed yet.
Best short setup: Rejection from IB Highs + Absorption on CVD / Footprint charts.
Breakdown scenario: Short on range low breakdown with volume confirmation.
Longs: Only valid if HTFs confirm breakout → then look for bullish retest or mid-retest entries.
⸻
Summary & Trade Plan
Big Picture: Still bullish, but this isn’t the area to long blindly.
Short Setup 1: Rejection from IB Highs with clear absorption + imbalance.
Short Setup 2: Breakdown below IB Range Lows with volume follow-through.
Long Setup: Wait for HTF confirmation of breakout. If confirmed → retest of prior resistance as support.
Final Notes
This is where traders get chopped. HTF resistance meets LTF momentum.
Let price prove itself. Let volume confirm the move.
No breakout = no long. No trap = no short.
Open Interest

Market Overview (May 7, 2025)📊 Key Metrics
1. Funding Rate: ~0.018% (on Binance)
— positive rate indicates long position dominance and bullish sentiment
2. Open Interest (OI): GETTEX:29B , up ~ SEED_TVCODER77_ETHBTCDATA:7B in recent days
— rising OI suggests new positions are opening, increasing volatility risk
3. ETF Inflows: +$420.9M (May 6)
— strong institutional demand, especially into BlackRock’s IBIT
4. Fear & Greed Index: 67 (Greed)
— rising greed may signal potential for a short-term correction
⸻
📈 Market Movement Probability
• Upward: 60%
(supported by ETF inflows and positive funding)
• Downward: 40%
(high greed and rising OI could trigger a correction)
⸻
Disclaimer: This is not financial advice. Always do your own research.
Market Overview (May 5, 2025)
📊 Key Metrics
1. Funding Rate: -0.0024% (on Binance)
— traders are paying to hold short positions, signaling bearish pressure
2. Open Interest (OI): $27.5B, down –3.13% in 24h
— positions are closing, possibly due to liquidations or profit-taking
3. ETF Inflows: +$674.9M (on May 2)
— strong institutional demand, especially into BlackRock’s IBIT
4. Fear & Greed Index: 52 (Neutral)
— sentiment has stabilized after a period of greed
⸻
📈 Market Movement Probability
• Upward: 55%
(potential short squeeze fueled by ETF inflows)
• Downward: 45%
(OI is dropping, market losing momentum)
⸻
Disclaimer: This information is not financial advice and should not be used as the sole basis for investment decisions.

ME Likely to Revisit 1.415 ZoneBased on the MissedPrice concept, rapid price moves often skip levels that price later revisits. The 1.415 level shows an Open Interest leap, suggesting missed positions.

Nifty Data and Trading Strategy for 17 March 2018 NSE:NIFTY Analysis and Trading Strategy
Key Observations:
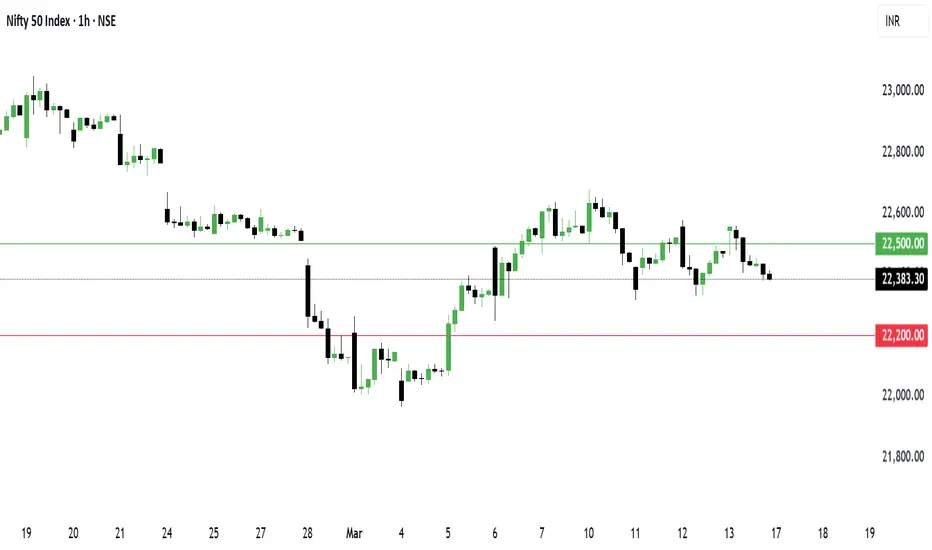
Nifty Spot Price: 22,397.20
Max Pain: 22,450This suggests that option writers will try to move the market towards this level by expiry.
PCR (Put-Call Ratio): 0.99PCR near 1.0 indicates a balanced market, with no extreme bullish or bearish bias.
A rise above 1.2 suggests bullishness, while a drop below 0.8 suggests bearishness.
OI (Open Interest) Data:Call OI Change: 430.58L (High call writing at resistance levels)
Put OI Change: 369.91L (Put writing suggests strong support)
Total Calls OI: 752.31L vs. Total Puts OI: 745.22L (Almost equal, indicating a neutral stance)
Support and Resistance Levels:
Immediate Resistance: 22,500 (Strong Call Writing)
Immediate Support: 22,300 (Strong Put Writing)
Next Resistance: 22,600
Next Support: 22,200
Trading Plan (March 17, 2025)
Scenario 1: Bullish Setup (Breakout Above 22,450)
Entry: Above 22,450 (Confirm breakout with volume)
Target 1: 22,500
Target 2: 22,600
Stop Loss: 22,350
Reason:If Nifty moves above max pain (22,450), bulls will gain momentum.
PCR indicates a balanced market, but a breakout with volume can trigger further upside.
Scenario 2: Bearish Setup (Breakdown Below 22,350)
Entry: Below 22,350 (Confirm breakdown with volume)
Target 1: 22,300
Target 2: 22,200
Stop Loss: 22,450
Reason:Call writing at 22,500 suggests strong resistance.
Breakdown below 22,350 may lead to further downside towards 22,300 and 22,200.
Final Strategy:
Bias: Neutral to Bullish (Watch for breakout above 22,450)
Intraday Plan:If Nifty opens flat → Wait for breakout/breakdown confirmation
If Nifty opens above 22,450 → Buy on dips
If Nifty opens below 22,350 → Sell on rise
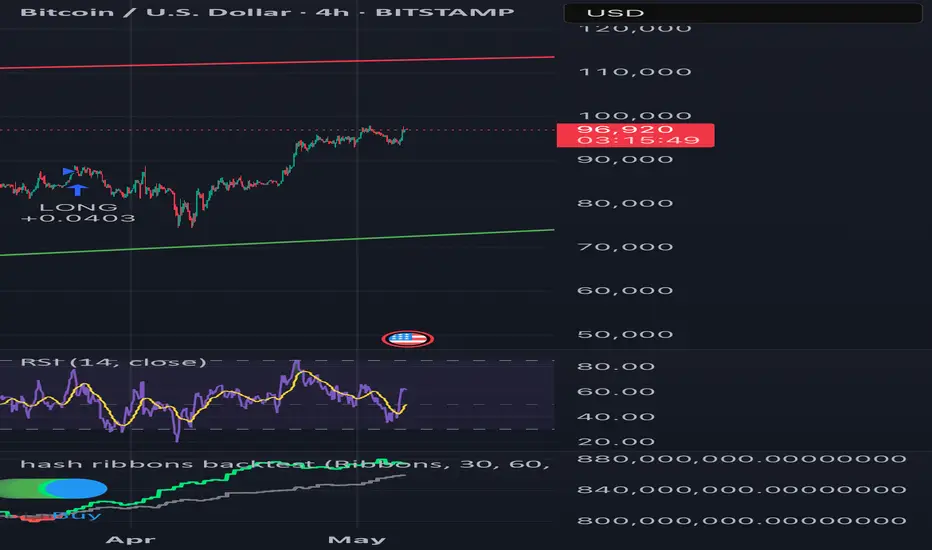
HolderStat | BTC is rising. Will it break through $100K?📈 Bitcoin price jumped to $98,120 (+5% overnight), but trading volumes are down 10%. Meanwhile, funding rates remain low and total open interest in futures is up 1.3% - the market is preparing to move, but where to?
💸 Outflows from BTC ETFs have slowed but are still significant, and strong resistance at $100K remains unbroken. The nearest support is far away - at $93K. Interestingly, top wallets are refraining from activity on this correction so far.
_____________________
📊 Want more useful analytics? Like and subscribe to stay up to date with the most relevant trading ideas!
Always DYOR! 🔬

Nifty bank levels and targets for tomorrow 29/Nov/2024Nifty Bank Prediction for 29th November 2024
Nifty bank levels and targets for tomorrow.
follow for more update and information
The Bank Nifty experienced a pullback, relinquishing early gains and failing to sustain its upward trajectory, closing at 51,906.85 with a 0.76% decline.
On the daily chart, the index struggled after breaching the 52,600 level, reversing gains and engulfing the momentum of the last two sessions. This weakness was largely driven by private banking stocks, as the Nifty Private Bank Index fell by 1.11% for the day. Despite forming a bearish reversal pattern, the Bank Nifty remains above its 50- and 100-day exponential moving averages (DEMA), indicating strong support around the 51,500 level. A breach below this could extend the correction to 51,000 & 50700 levels.
Traders are advised to adopt a stock-specific strategy within the banking sector and consider a "buy-on-dips" approach for the near term.

Interpreting Long/Short Ratios in Futures Trading█ Interpreting Long/Short Ratios in Futures Trading: Beyond Bullish and Bearish
For beginner traders, the long/short ratio in futures markets can seem like a clear-cut indicator of market sentiment. Many assume that a high ratio of longs to shorts means the market is bullish, while more shorts than longs signals a bearish outlook. But in reality, this interpretation is oversimplified and can lead to misguided trading decisions.
In this article, we'll break down the nuances of the long/short ratio in futures trading, explaining why positions on the “short side” don’t always indicate a bearish stance and how traders can better interpret these ratios for a well-rounded perspective.
█ Understanding the Basics: Futures Trading Is Not Spot Trading
In the futures market, every trade requires a buyer (long position) and a seller (short position). For each person going long, there’s a counterpart going short. This zero-sum structure means that, by definition, there’s always a balance between longs and shorts. However, the reasons why traders take long or short positions vary widely—and not all of them are directional bets on price movement.
█ Why Not All Shorts Are Bearish (And Not All Longs Are Bullish)
Let’s dig into why a trader might take the short side without actually betting on a price drop:
⚪ Hedging: Some traders go short to hedge an existing position. For instance, if they already hold a large amount of Bitcoin in the spot market, they might take a short position in Bitcoin futures to protect against potential downside risk. This doesn’t mean they’re bearish on Bitcoin; they’re just managing risk.
⚪ Arbitrage: Some traders take short positions for arbitrage purposes. For example, they might go long in one market and short in another to profit from small price differences without having any directional view on Bitcoin’s future price. Their short position is purely for balancing and not a bet on falling prices.
⚪ Market Making: Market makers provide liquidity to the market by taking both long and short positions. Their goal isn’t to profit from price movements but to capture the spread between the bid and ask prices. They don’t have a directional view—they’re simply facilitating trades.
⚪ Closing Long Positions: When traders close long positions, they effectively create a new short transaction. For instance, if a trader decides to exit a long position by selling, they’re adding to the short side of the market. But this action doesn’t necessarily mean they expect prices to drop—it could just mean they’re taking profits or reallocating their portfolio.
█ Interpreting CoinGlass Long/Short Ratio Charts: Volume vs. Accounts
Let’s look at the long/short ratio charts on CoinGlass as an example. CoinGlass provides two main types of ratios:
⚪ Volume-Based Ratio: This chart shows the volume of capital in long vs. short positions. For example, a high volume in longs might suggest that large players are buying into Bitcoin. However, it’s important to remember that some of these long positions could be from market makers, hedgers, or arbitrageurs, who may not expect Bitcoin to rise. The volume itself doesn’t tell us why they’re in these positions.
⚪ Account-Based Ratio: This chart tracks the number of accounts on each side (long vs. short) on exchanges like Binance. A higher number of accounts on the short side doesn’t mean all those traders are bearish. Many could be taking short positions to balance other trades or hedge risks. They’re not necessarily expecting Bitcoin to decline; they’re just managing their positions.
█ Example Analysis: Misinterpreting Long/Short Ratios
Imagine you’re looking at a CoinGlass chart that shows an increase in long volume around November 5th. A beginner might see this and think, “Everyone’s bullish on Bitcoin!” But as we discussed, some of this long volume could be non-directional. It could include positions taken by market makers providing liquidity or hedgers who are long on Bitcoin futures but have a corresponding short in another market.
Similarly, if you see a spike in the number of short accounts, don’t automatically assume that everyone expects Bitcoin to fall. Some of those accounts might just be managing risk or taking advantage of arbitrage opportunities.
█ Avoiding the Pitfall of Overinterpreting the Long/Short Ratio
The biggest mistake traders make is interpreting the long/short ratio as a direct indicator of market sentiment. Remember, every trade has a counterparty. If there’s a high volume of longs, it simply means there’s an equal volume of shorts on the other side. The market’s overall sentiment isn’t always reflected in this ratio.
Instead of relying solely on the long/short ratio, consider these other factors to form a clearer market view:
Market Sentiment Indicators: Use sentiment tools, news, and social media sentiment to understand how traders are feeling beyond just positions.
Volume Trends: Look at overall market volume to see if there’s conviction behind the moves.
Context and Price Action: Interpret the ratio in the context of price action and recent events. If there’s a strong bullish trend, a higher long ratio might reflect confidence in the trend rather than simply volume.
█ Conclusion: A Balanced Perspective for Smarter Trading
Understanding the long/short ratio requires a more nuanced perspective. Just because the “longs” are up doesn’t mean everyone’s bullish—and just because the “shorts” are up doesn’t mean everyone’s bearish. The futures market is filled with diverse participants, each with unique motives, from hedging and arbitrage to liquidity provision.
By looking at these ratios with a balanced view, traders can avoid common pitfalls and interpret the data more accurately. Trading is about context and strategy, not just numbers on a chart. So, next time you’re checking the long/short ratio, remember: there’s more to it than meets the eye.
█ Final Takeaway: Focus on Context, Not Just Ratios
The long/short ratio can be a helpful tool, but it’s only one piece of the puzzle. Use it in combination with other market indicators, and always consider the motives behind trades. By doing so, you’ll make better-informed trading decisions and avoid falling into the trap of oversimplifying complex market data.
-----------------
Disclaimer
This is an educational study for entertainment purposes only.
The information in my Scripts/Indicators/Ideas/Algos/Systems does not constitute financial advice or a solicitation to buy or sell securities. I will not accept liability for any loss or damage, including without limitation any loss of profit, which may arise directly or indirectly from the use of or reliance on such information.
All investments involve risk, and the past performance of a security, industry, sector, market, financial product, trading strategy, backtest, or individual's trading does not guarantee future results or returns. Investors are fully responsible for any investment decisions they make. Such decisions should be based solely on evaluating their financial circumstances, investment objectives, risk tolerance, and liquidity needs.
My Scripts/Indicators/Ideas/Algos/Systems are only for educational purposes!

Open Interest ExplainedOpen interest (OI) is a critical concept in the world of trading, particularly in the futures and options markets. It represents the total number of outstanding contracts that have not been settled or closed. Understanding open interest can provide valuable insights into market sentiment, liquidity, and potential price movements. In this article, we will explore what open interest is, how it affects trading, and what traders should consider when analyzing it.
What is Open Interest?
Open interest is defined as the total number of outstanding derivative contracts—such as futures and options—that have not yet been settled. Each time a new contract is created (when a buyer and seller enter into a new agreement), the open interest increases. Conversely, when a contract is settled or closed, the open interest decreases.
For example, if a trader buys a futures contract, open interest increases by one. If another trader sells the same contract to close their position, open interest decreases by one.
Why is Open Interest Important?
Open interest provides insights into market activity and can indicate the strength of a price trend. Here are some key reasons why open interest is important for traders:
Market Sentiment:
Open interest can help traders gauge market sentiment. Rising open interest, especially alongside rising prices, suggests that new money is entering the market and that the bullish trend may continue. Conversely, increasing open interest with falling prices may indicate that bearish sentiment is growing.
Liquidity Indicator:
Higher open interest generally indicates greater market liquidity. This means that traders can enter and exit positions more easily, which is especially important for large institutional traders who need to manage large orders without significantly impacting the market price.
Potential Price Movements:
Analyzing open interest trends can help traders predict potential price movements. For instance:
- Increasing Open Interest + Rising Prices: This combination suggests that new bullish positions are being established, indicating a potential continuation of the uptrend.
-Increasing Open Interest + Falling Prices: This scenario may indicate that new bearish positions are being taken, suggesting a potential continuation of the downtrend.
-Decreasing Open Interest: A decline in open interest, particularly in conjunction with rising prices, may suggest that traders are closing their positions, which can signal a weakening trend.
How to Analyze Open Interest
When analyzing open interest, traders should consider several factors:
[ b]Contextual Analysis: Always consider open interest in conjunction with price movements. Relying solely on OI without considering price action can lead to misleading interpretations.
Volume Comparison: Compare open interest with trading volume. High volume alongside increasing open interest is generally a positive sign for a trend, while high volume with decreasing open interest may signal trend exhaustion.
Market Events: Be aware of upcoming economic reports, earnings announcements, or other events that may impact market sentiment and influence open interest.
Different Markets: Open interest can behave differently across various asset classes. For example, in commodity markets, high open interest might reflect hedging activity, while in equity options, it could indicate speculative interest.
Open interest is a valuable tool for traders to assess market sentiment, liquidity, and potential price movements. By analyzing it alongside price action and volume, traders can gain deeper insights into market trends and make more informed trading decisions. However, like any trading indicator, it works best when combined with other forms of analysis for a well-rounded strategy.

SOL and BTC Longs and Shorts Clear inverse relationship between the longs and shorts on SOL.
White (longs)
Orange (shorts)
Right now the longs have reached the same level as when SOL hit its high of 200 back in march this year. Longs got dumped on recently on this small sell off but interest remains at elevated levels.
Shorts coming off their lows and seem to bottom when SOL price peaks.
Longs build up pushing price to local highs then there leaves no one left to buy so price goes after the liquidity (shorts).
Opposite happens with shorts buildup. Price sells off some, shorts pile on pushing price lower until it reaches the local bottom then price reverses once all the longs get liquidated. Then price goes after shorts liquidity.
What then becomes the difference maker is how much spot volume comes in. At the bottom I have the aggregated volume of multiple exchanges showing the spot volume (light) compared to the perp volume (dark). Right now spot volume is pretty low; however, volume is low in general.
My takeaways:
SOL either needs to liquidate these longs while building up shorts. This would put shorts offside setting up for a nice reversal pump into the EOY taking out all the shorts creating a nice squeeze.
Or perhaps spot buying picks up eventually and the longs interest slowly rises surpassing prev long interest causing the breakout.
Similar analysis here on BTC but the short interest is pretty significant. Could be those who are arbitraging the perp funding rate by shorting instead of directional shorts but who knows exactly why.
If BTC begins to break out with strong spot buying soon after election uncertainty and EOY capital flows then all this short interest could get squeezed setting up for a perfect pump higher breaking out of this wretched range.
Time will tell. I think election uncertainty has market on edge as well as war/ recession fud.

Platinum: Little Consolidation (Wave 4); Golden RatioWe can see a very well defined cycle, and wave 1 to 3 already created.
This new cycle could be a consolidation, the price can drop to 14,6% or 23,6% level.
Or even in the middle between 38,2% and 23,6%, where other wicks has already touched, creating a support, where can also occur the last candle of Wave 4.
Open interest in NYMEX:PL1! is falling and the major trend rising, it can occur a reverse, and this reverse will be the Wave 4.
RSI left the Overbought level, followed by a failure swing, resulting in continued decline of the indicator.
After the peak $1,016.45, ADX is losing strength while DMI+ has a high probability of changing position with DMI-.

Bullish on Crude oilNYMEX:CL1!
TVC:DXY
Right now as the Crude Oil prices are at *premium and technically we are around a strong support area I think we would see a rally somewhere between 67.5 and 72.5. However, this week, we have PMI and NFP news ahead so if the reports come out to support DXY, Crude oil might stay around this area for a while (as it's seasonality suggests)
* look at the closing price of the futures contracts between July and December 2024.

The btcusd weekly on the CMEWeekly session just closed which erases the last four weeks of declines and uncertainties, the candle is larger and also seems to express decision. I think it is normal to see movements of this type after quite significant bearish pressure, it is not a clear signal that the correction is over, but we can see it as a beginning or at least an important rebound. The minimum at 56.5k USD therefore becomes the level where the margins of those who have gone long in recent weeks are placed. If I analyze the futures, it is necessary to think in these terms. On derivatives there is a technique of the large managers called "stop hunting loss or margin call", means that once the level in which the liquidations are concentrated has been identified, the price will go there and then resume the previous run or direction, after all, here we are dealing with brokers who trade against you , so for every user who gains, they lose. The CME is different but not so much, it is taking shares of open interest, as can be seen below, taking advantage of the moment in which others flee from the exchanges, maybe things are correlated or maybe not. It remains strange that once the institutions entered, the battles to regulate this and that began. Those who have known Bitcoin and cryptocurrencies for a while know well that they were created to improve old methods, but here we are witnessing a fusion between old and new, so the price movements we are seeing have become much more technical, yes says that the market has achieved more efficiency than in the past, perhaps, what has not changed and will never change is the method for taking money from all participants.

Open Interest - Deciphering Bitcoin's Market SentimentIn the ever-evolving landscape of cryptocurrency trading, Bitcoin often serves as a beacon, reflecting broader market sentiment through its dynamic price movements and trading metrics. Today, let's explore the intricacies of Bitcoin's market dynamics by dissecting Open Interest (OI), funding rates, liquidations, and long/short ratios—using current data as our live case study.
What do we see? (follow the steps)
1) Price action . Essential to understand it before the usage of any indicator.
2) Open Interest , the total number of outstanding derivative contracts like futures and options, provides a window into market activity. An increase in OI alongside a rising BTC price suggests new money might be entering, potentially signalling bullish sentiment. Conversely, decreasing OI during price drops might indicate a bearish outlook. Currently, we observe a slight uptick in OI as BTC recovers from a dip, hinting at growing confidence among traders.
3) The funding rate , specific to perpetual contracts, reflects periodic payments between longs and shorts. A positive rate, where longs pay shorts, suggests a bullish consensus, as it's costlier to maintain long positions. Presently, BTC's slightly positive funding rate aligns with its uptrend, indicating that traders might be anticipating further price increases.
4) Liquidations occur when a trader's position is closed by the exchange due to a margin call. A cluster of liquidations often follows a sharp price movement, as we've recently seen with BTC. These liquidation spikes could suggest that overleveraged positions have been flushed out, which can sometimes signal a local price bottom and a potential reversal point, paving the way for a more sustained upward trend.
5) The ratio of long to short positions tells us about the prevailing market bias. A ratio significantly above 50 indicates a bullish majority, which is currently the case with BTC. This higher long/short ratio could be interpreted as a market leaning towards optimism.
As always, I hope you found this insightful and have a lovely Sunday! ;)

NQ Power Range Report with FIB Ext - 9/7/2023 SessionCME_MINI:NQU2023
- PR High: 15392.00
- PR Low: 15379.00
- NZ Spread: 29.0
Economic Events:
08:30 – Initial Jobless Claims
11:00 – Crude Oil Inventories
Follow-through with daily rollover
- Inventory response at daily KA-20
- Retraced 1/3 of prev session range
Evening Stats (As of 12:05 AM)
- Weekend Gap: N/A
- Session Gap: -0.33% (open > 15807)
- Session Gap: -0.11% (open > 15939)
- Session Open ATR: 234.30
- Volume: 17K
- Open Int: 250K
- Trend Grade: Neutral
- From ATH: -8.3% (Rounded)
Key Levels (Rounded - Think of these as ranges)
- Long: 16105
- Mid: 15247
- Short: 14675
Keep in mind this is not speculation or a prediction. Only a report of the Power Range with Fib extensions for target hunting. Do your DD! You determine your risk tolerance. You are fully capable of making your own decisions.

#XAUUSD 🟢 M5. Long (Gold)
price under the first Buyer of open interest of exchange options (+)
the price is below the closing level of the volume bearish candle (+)
long asset according to CFTC reports (+)
M5 imbalance (+)
price above market open ⚠️
input: 1921.78 (after imbalance breakdown on retest)
stop: 1920
tp-1: 1923.53
tp-2: 1926.97

BTC - THE SETUPThis might be the perfect setup.
28850 is the Optimal entry for a LONG...
The condition ? back above 29.5 (at least)
Too greedy to "wick" it 500$ lower...
32k is a question of time....
with love from Medellin !
Don Pablo

Spinning Bottom Reversal - NiftyAs discussed in the previous blog, the sell-off was expected to 17000
1. Spinning Bottom Candle, which depicts the reversal and is also supported by open interest data, A lot of puts are being shorted
2. Regression channel, Since Dec 2022, Nifty has been moving in the regression channel, It is reversed from the bottom of the channel.
Assuming these structural formations, nifty will likely trade above the 16900 to 17000 range for the next 2 Weeks as long as support is intact.
This week's candle formation will derive the sentiment for April Month.

Nifty 50 - Option chain AnalysisTrading based on volume and open interest on option chain. S/R levels also calculated as per option and have tried to test with some random indicator from trading view. 30 min time frame for Target and stoploss. NSE:NIFTY

Crude OilFRED:DCOILBRENTEU
View from the Daily Timeframe. A bullish market structure forming.
If I bought. I would go to a price take profit price of 98.00.

NQ Power Range Report with FIB Ext - 11/18/2022 SessionCME_MINI:NQZ2022
- PR High: 11760.50
- PR Low: 11718.25
- NZ Spread: 94.25
Evening Stats (As of 1:25 AM)
- Weekend Gap: -0.39% (filled)
- 8/19 Session Gap: -0.04% (open > 13237)
- Session Open ATR: 343.30
- Volume: 26K
- Open Int: 247K
- Trend Grade: Bear
- From ATH: -30.2% (Rounded)
Key Levels (Rounded - Think of these as ranges)
- Long: 12391
- Mid: 11820
- Short: 10678
Keep in mind this is not speculation or a prediction. Only a report of the Power Range with Fib extensions for target hunting. Do your DD! You determine your risk tolerance. You are fully capable of making your own decisions.

NQ Power Range Report with FIB Ext - 11/17/2022 SessionCME_MINI:NQZ2022
- PR High: 11784.50
- PR Low: 11769.00
- NZ Spread: 34.50
Evening Stats (As of 12:05 AM)
- Weekend Gap: -0.39% (filled)
- 8/19 Session Gap: -0.04% (open > 13237)
- Session Open ATR: 347.45
- Volume: 18K
- Open Int: 258K
- Trend Grade: Bear
- From ATH: -30.0% (Rounded)
Key Levels (Rounded - Think of these as ranges)
- Long: 12391
- Mid: 11820
- Short: 10678
Keep in mind this is not speculation or a prediction. Only a report of the Power Range with Fib extensions for target hunting. Do your DD! You determine your risk tolerance. You are fully capable of making your own decisions.

BTC Open Interest has broken through resistanceBitcoin price was half asleep.
It seems that now the dormant volcano has woken up.
Overview
Open interest is a traditional term used to quantify the total dollar value of investors' positions in a futures contract.
These positions can be long or short. For example, imagine that the Bitcoin futures contract has just opened and Alice buys $100.
At this point, both volume and open interest equal $100. So Alice decides she wants to sell her half of her position.
Therefore, by closing half of the market's open positions, open interest decreases to $50, while volume increases to $150.
Open interest aggregates all positions and gives traders an idea of the dollar value that is at stake for a given contract.
For perpetual swaps, open interest can be held for an indefinite period, while for futures contracts, open interest reaches zero the moment a contract expires and usually starts to decline a few weeks before the settlement date.
How can I use it?
Similar to volume, open interest can be used to gauge trend strength.
For example, if open interest increases as the price increases, this indicates that more longs are being opened.
On the contrary, if prices increase and open interest rates decrease, it points to the weakening of the trend as derivatives traders' positions are being closed.
Therefore, the example above points to strong conviction among perpetual swap traders as the amount of open positions has increased along with the price of Bitcoin.
Source:
resources.intotheblock.com
