PINS Pinterest Options Ahead of EarningsIf you haven`t bought PINS before the previous earnings:
Now analyzing the options chain and the chart patterns of PINS Pinterest prior to the earnings report this week,
I would consider purchasing the 39usd strike price Calls with
an expiration date of 2025-8-8,
for a premium of approximately $2.22.
If these options prove to be profitable prior to the earnings release, I would sell at least half of them.
Option

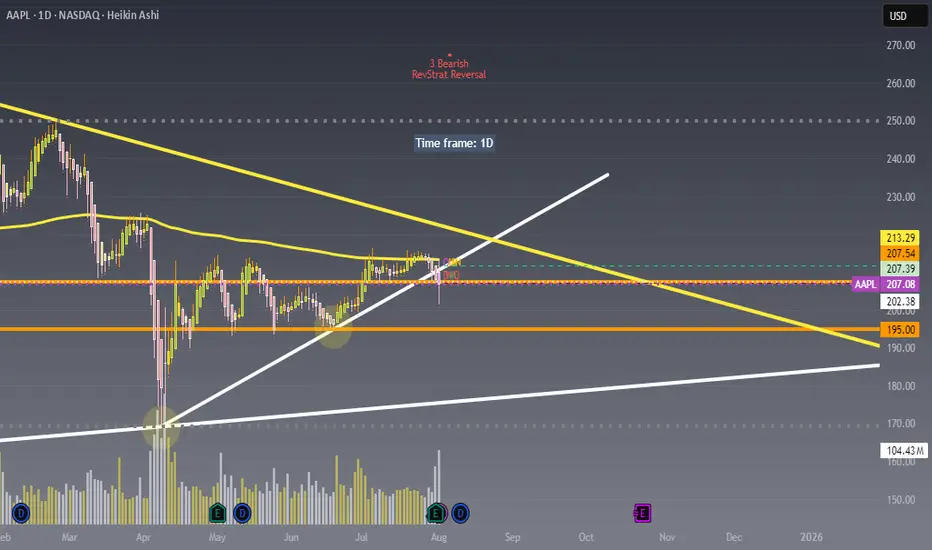
Watching AAPL closely here !!!Not financial advice – just sharing my outlook. 📉📈
Price is currently rejecting the upper trendline resistance around $213 and struggling to hold above the $207-$208 zone.
Looking for potential puts as long as price remains under this key resistance area.
Will be buying the dip near the $195 or $185 zone where strong demand and trendline support intersect.
Key levels :
Resistance: $213.29 / $207.54
Support: $202.38 / $195.00
META Meta Platforms Options Ahead Of EarningsIf you haven`t bought META before the rally:
Now analyzing the options chain and the chart patterns of META Platforms prior to the earnings report this week,
I would consider purchasing the 710usd strike price in the money Calls with
an expiration date of 2026-6-18,
for a premium of approximately $89.30.
If these options prove to be profitable prior to the earnings release, I would sell at least half of them.
Disclosure: I am part of Trade Nation's Influencer program and receive a monthly fee for using their TradingView charts in my analysis.

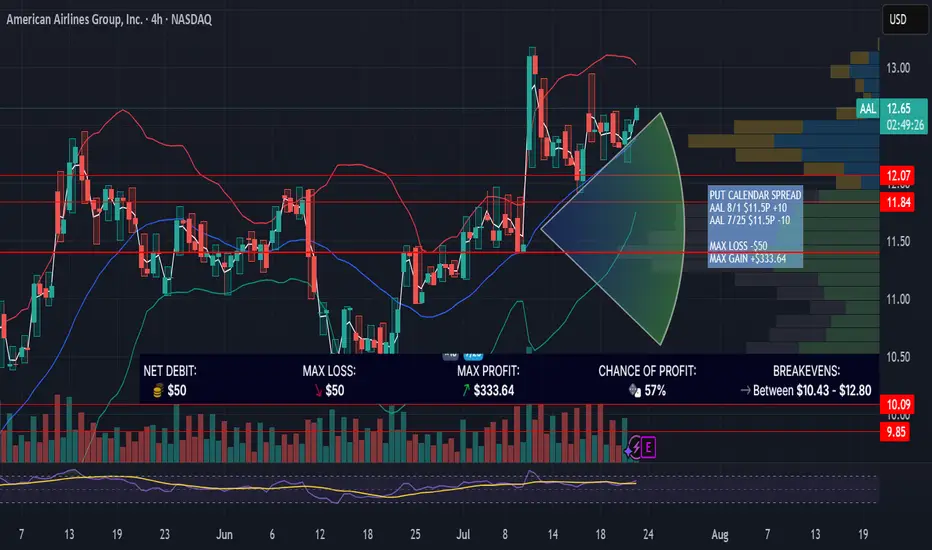
AAL PUT CALENDAR SPREAD / EARNINGSAAL is up 11% since 7/9/25 with a gap up riding on earnings of its competitor DAL. AAL earnings are in the morning on 7/24/25. Looking for a "sell the news" event with a good risk/reward options trade. This trade is designed for price to settle near the high volume node at $11.50 near expiration on 7/25/25.
PUT CALENDAR SPREAD
AAL 8/1 $11.5P +10
AAL 7/25 $11.5P -10
MAX LOSS -$50
MAX GAIN +$333.64
Gold. 14.07.2025. The plan for the next few days.The nearest resistance zones are where it's interesting to look for sales. It's not certain that there will be a big reversal, but I think we'll see a correction. We're waiting for a reaction and looking for an entry point.
The post will be adjusted based on any changes.
Don't forget to click on the Rocket! =)

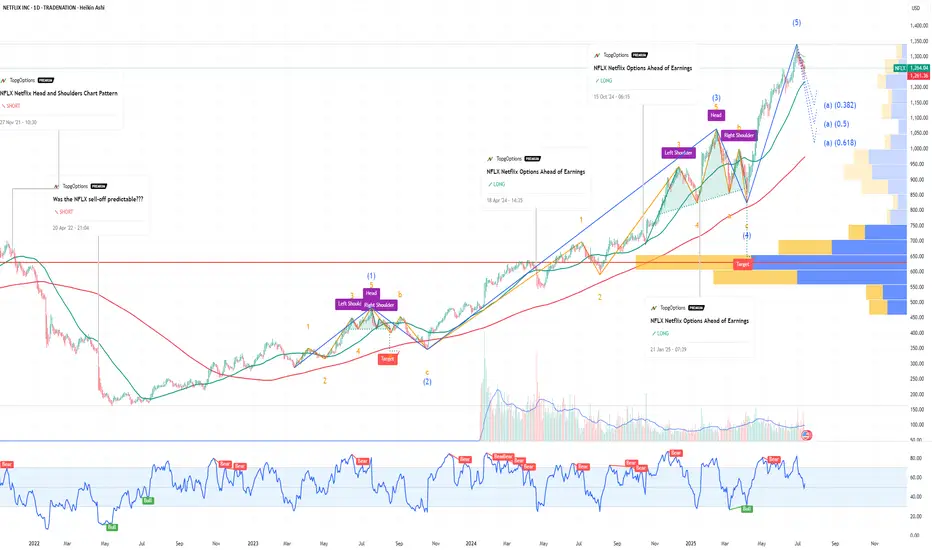
NFLX Netflix Options Ahead of EarningsIf you haven`t bought NFLX before the previous earnings:
Now analyzing the options chain and the chart patterns of NFLX Netflix prior to the earnings report this week,
I would consider purchasing the 1260usd strike price Puts with
an expiration date of 2025-9-19,
for a premium of approximately $71.10.
If these options prove to be profitable prior to the earnings release, I would sell at least half of them.
Disclosure: I am part of Trade Nation's Influencer program and receive a monthly fee for using their TradingView charts in my analysis.
(Daytrading) APPL going upH1 chart is respecting the uptrend.
Price has retested the 50 SMA on the H1 timeframe.
Price also touched the Ichimoku Cloud on H1.
→ Based on the risk-to-reward ratio, I’m expecting a Call position.

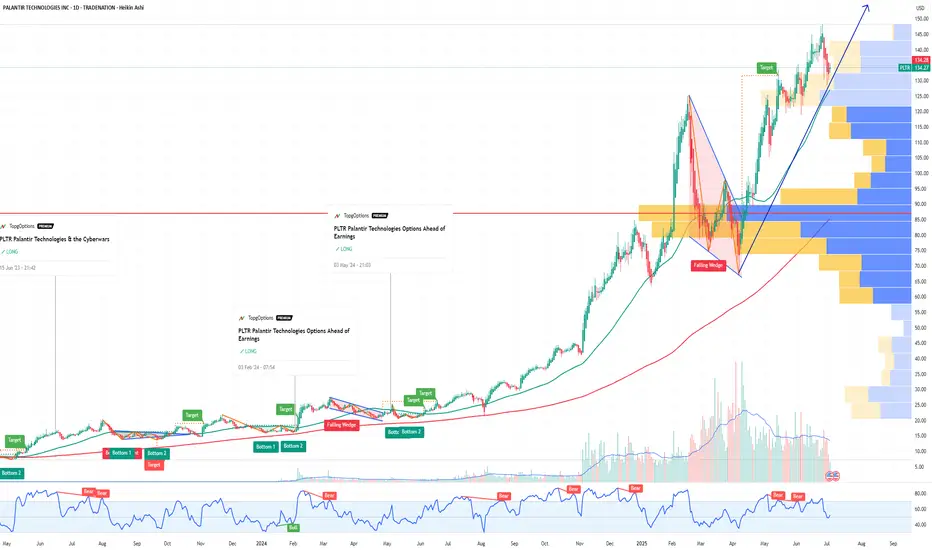
Why Palantir (PLTR) Could Be the NVDA of Government AI If you haven`t bought PLTR before the massive rally:
Palantir Technologies (PLTR) is proving it’s more than just another AI hype play — it’s becoming a core piece of the secure AI infrastructure for governments and large enterprises worldwide.
Key Bullish Arguments
1) Strong Government Moat
PLTR’s deep relationship with the U.S. government, NATO, and allies provides sticky, long-term revenue streams. In an age of geopolitical tension, this is exactly the type of mission-critical AI spending that stays funded.
2) Expanding Commercial Footprint
The commercial segment is no longer a side project. Palantir’s Foundry and Apollo platforms help enterprises deploy AI at scale — securely, in-house, and without sending sensitive data to open systems. Recent deals in healthcare, energy, and critical infrastructure show they’re broadening their customer base.
3) Profitability & Balance Sheet
Palantir is GAAP profitable for six consecutive quarters, with strong free cash flow and zero debt. For a growth stock in AI, this gives it rare staying power if macro conditions tighten.
4) Technical Strength
The stock broke out above ~$125–$130 support and is now testing key resistance in the $140–$148 range. Weekly momentum remains bullish, and institutional accumulation (A/D line) remains strong.
5) AI Tailwinds Remain
While the general AI trade has cooled for some names, PLTR’s unique moat in secure and domain-specific AI makes it more defensible than generic “AI SaaS” stocks. New contracts or AI platform updates could reignite momentum this summer.
Possible Summer Catalysts
New multi-year government deals — especially in defense and cybersecurity.
Major commercial partnerships — especially in healthcare or energy.
AI platform upgrades — more integrations with LLMs or domain-specific AI.
Inclusion in AI-focused ETFs — or further index rebalancing inflows.
Disclosure: I am part of Trade Nation's Influencer program and receive a monthly fee for using their TradingView charts in my analysis.
CRSP Could Crack the Holy Grails of Medicine: Cancer & AlzheimerWhen Tesla (TSLA) started, few believed a scrappy EV startup could transform the entire auto industry and ignite a green energy revolution. But it did.
Today, CRISPR Therapeutics (NASDAQ: CRSP) is quietly doing something similar for medicine — and if you squint, its upside might be even bigger than Tesla’s.
Gene Editing: The Next Industrial Revolution — For Your Cells
CRISPR/Cas9 gene editing is like biological software. It gives scientists the power to cut, delete, or rewrite genes — the source code of life — with surgical precision.
CRISPR Therapeutics was co-founded by Dr. Emmanuelle Charpentier, a Nobel Prize winner who helped pioneer this breakthrough. The company’s lead therapy, exa-cel — just FDA approved in the U.S. — is the first-ever CRISPR-based gene-editing treatment to hit the market.
First up: curing devastating blood disorders like sickle cell disease and beta-thalassemia — a $10 billion+ opportunity. But that’s only the start.
Aging: The Ultimate Disease
What if we treated aging itself as a disease?
Many scientists now argue that growing old is the result of accumulated genetic errors, cellular damage, and mutations — processes that can be slowed or even reversed.
Gene editing holds the promise to repair DNA damage, reprogram cells, and treat the root causes of age-related decline. If successful, it could extend healthy human lifespan by decades.
Think about that: Tesla made cars last longer and burn cleaner. CRSP could make you last longer and live healthier.
The Two Holy Grails: Cancer and Alzheimer’s
Beyond blood disorders, CRISPR Therapeutics is working on a pipeline targeting solid tumors, diabetes, and more. But the real game-changers are cancer and Alzheimer’s disease — the twin mountains every biotech company dreams of conquering.
With gene editing, we could one day rewrite the genetic mutations that fuel cancer growth or remove the faulty proteins that clog the brain in Alzheimer’s. These are trillion-dollar problems — and the company that cracks them will reshape human history.
Built for Scale — Like Tesla
CRSP isn’t going at it alone. Partnerships with Vertex, Bayer, and ViaCyte help spread risk and amplify impact. With over $2 billion in cash, it has the runway to execute — just as Tesla used capital to build factories and charging networks at scale.
The market still underestimates that this is a platform company — not a single-drug biotech. If Tesla went from cars to batteries, solar, and AI, CRSP could go from blood disorders to rewriting the code for life itself.
Bottom Line
Aging. Cancer. Alzheimer’s. These are the holy grails of medicine.
If you missed Tesla at $20 a share, CRISPR Therapeutics could be your second chance — the TSLA of Gene Editing.
Because the greatest disruption of all is not electric cars. It’s the chance that, one day, growing old will be optional.

NKE NIKE Options Ahead of EarningsIf you haven`t sold NKE before the previous earnings:
Now analyzing the options chain and the chart patterns of NKE NIKE prior to the earnings report this week,
I would consider purchasing the 62usd strike price Calls with
an expiration date of 2025-7-3,
for a premium of approximately $2.29.
If these options prove to be profitable prior to the earnings release, I would sell at least half of them.
Disclosure: I am part of Trade Nation's Influencer program and receive a monthly fee for using their TradingView charts in my analysis.

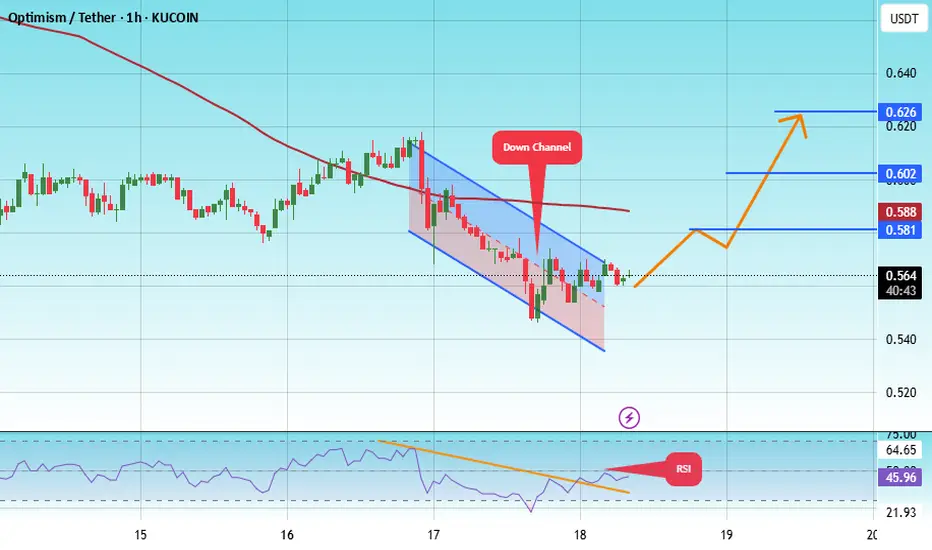
#OP/USDT#OP
The price is moving within a descending channel on the 1-hour frame, adhering well to it, and is heading toward a strong breakout and retest.
We are experiencing a rebound from the lower boundary of the descending channel. This support is at 0.544.
We have a downtrend on the RSI indicator that is about to be broken and retested, supporting the upward trend.
We are heading toward stability above the 100 moving average.
Entry price: 0.564
First target: 0.581
Second target: 0.602
Third target: 0.626
Bullish Thesis for INTC Intel Stock in 2025If you haven`t bought INTC before the previous earnings:
Now Intel INTC is positioned for a potential turnaround and upside by the end of 2025, driven by strategic leadership changes, foundry business expansion, AI innovation, and favorable geopolitical dynamics. Here’s why INTC could head higher this year:
1. Leadership Transformation and Strategic Vision
The appointment of Lip-Bu Tan as CEO in March 2025 has injected new optimism into Intel’s prospects. Tan is a respected semiconductor industry veteran, and his arrival was met with a 10% jump in INTC’s share price, reflecting renewed investor confidence in the company’s direction.
2. Foundry Business Expansion and Government Support
Intel’s pivot toward a foundry-centric model is gaining momentum. The company is leveraging its U.S.-based manufacturing footprint to attract domestic and international clients, especially as geopolitical tensions and trade restrictions make U.S. chip production more attractive.
There is speculation about strategic partnerships, such as TSMC potentially acquiring a stake in Intel’s foundry operations, which could accelerate technology transfers and client wins.
The U.S. government is likely to continue supporting domestic semiconductor manufacturing through incentives and tariffs, directly benefiting Intel’s foundry ambitions.
3. AI and Next-Gen Product Launches
Intel is aggressively targeting the AI and data center markets. The upcoming Jaguar Shores and Panther Lake CPUs, built on the advanced 18A process node, are set for release in the second half of 2025. These chips will be available not only for Intel’s own products but also for external clients like Amazon and Microsoft, expanding the addressable market.
Intel’s renewed focus on AI accelerators and competitive cost structures could help it regain share in high-growth segments.
4. Financial Resilience and Market Position
Despite recent setbacks, Intel remains a dominant player in the PC CPU market and continues to generate substantial revenue, outpacing some key competitors in the latest quarter.
Analysts have revised their short-term price targets upward, with some projecting INTC could reach as high as $62—a potential upside of over 170% from current levels.
Forecasts for 2025 suggest an average price target in the $40–$45 range, with bullish scenarios pointing even higher if execution on foundry and AI strategies meets expectations.
5. Technical and Sentiment Factors
While technical analysis currently signals caution, the $18.50–$20 zone has provided strong support, and any positive news on foundry contracts or AI wins could catalyze a breakout from current consolidation patterns.
Market sentiment has shifted more positively following the CEO change and strategic announcements, suggesting the potential for a sustained rebound if Intel delivers on its promises.
In conclusion:
Intel’s combination of visionary leadership, foundry expansion, AI innovation, and favorable geopolitical trends sets the stage for a potential stock price recovery by the end of 2025. With analyst targets and investor sentiment turning more bullish, INTC presents a compelling case for upside as it executes its turnaround strategy
Disclosure: I am part of Trade Nation's Influencer program and receive a monthly fee for using their TradingView charts in my analysis.

[06/09] [GEX] Weekly SPX OutlookLast week’s outlook played out quite well — as anticipated, SPX hit the 6000 level, closing exactly there on Friday. This was the realistic target we highlighted in last week's idea.
🔭 SPX: The Bigger Outlook
It's difficult to say whether the rising SPX trend will continue. We're still in the "90-day agreement period" set by the administration, and so far, the market has shown resilience, avoiding deeper pullbacks like the one we saw in April.
With VIX hovering around 17–18, we’ve reached a zone where further SPX upside would require volatility. For the index to continue rising meaningfully, it needs to reverse the current bearish macro environment, and that can only happen with strong buying momentum — not a slow grind.
The parallel downward channel drawn a few weeks ago is still technically valid. Even a short 100-point squeeze would fit within this structure before a larger move down unfolds.
GEX levels give us useful clues heading into Friday. We're currently in a net positive GEX zone across all expirations, giving bulls a structural advantage, just like last week.
As of Monday’s premarket, SPX spot is at 6009.The Gamma Flip zone is between 5975–5990, with a High Volume Level (HVL) at 5985.
🔍 Let’s zoom in with our GEX levels — this gives us a deeper view than our GEX Profile indicator for TradingView alone.
🐂 🟢 If SPX moves higher, the following are logical profit-taking zones:
6050 (Delta ≈ 33)
6075 (Delta ≈ 25)
6100 (Delta ≈ 17)
🎯 Targeting above 6100 currently feels irrational — for instance, the next major gamma squeeze zone is at 6150, but that corresponds to a delta 6 level (≈94% chance the price closes below it), so I won’t aim that high yet.
🐻🔴 In a bearish scenario:
5975 and 5950 are the first nearby support zones (Deltas 30 and 38).
If momentum picks up, 5900 becomes reachable quickly, even if it's technically a 17-delta distance — because that’s deep in the negative GEX zone.
📅 Don’t forget: On Wednesday premarket, we’ll get Core Inflation Rate data — a key macro risk that could shake things up, regardless of TSLA drama fading.
📌 SPX Weekly Trading Plan Conclusion
Whatever your bias, keep cheap downside hedges in place. We've been rising for a long time, and even if SPX breaks out of the descending channel temporarily, resistance and the gamma landscape may pull price back swiftly.

BANKNIFTY - 1 Day Time Frame Analysis📈 NSE:BANKNIFTY - 1 Day Time Frame Analysis
This chart shows a classic Inverse Head and Shoulders pattern forming on the daily timeframe of BankNifty. This is a bullish reversal pattern, generally indicating a potential shift from a downtrend to an uptrend.
Left Shoulder: Formed around April 23rd–25th, marked by a short-term low.
Head: The lowest point in the pattern, formed around May 8th.
Right Shoulder: Formed around May 28th, indicating buyers are stepping in earlier, showing strength.
The neckline resistance lies near 55,913, which the price is currently testing. A decisive breakout above this level, with good volume, could signal a further upward move towards the higher resistance zones like 56,526, 56,907, and possibly 57,292.
Key Support Zones:
55,167
54,791
54,479
Traders may look for a daily candle close above 55,913 for confirmation. Risk management is crucial as a failed breakout may lead to a retest of support levels.
TRADE PLAN:
🔹 Entry:
On a daily candle close above 55,913 (neckline resistance).
Preferably with strong volume confirmation.
🔹 Targets (Upside Levels):
Target 1: 56,526
Target 2: 56,907
Target 3: 57,292
🔹 Stop Loss:
Below 55,167 (recent support and right shoulder low)
Conservative traders can use a tighter stop below 55,400 (previous candle low).
🔹 Risk Management:
Use appropriate position sizing (risk only 1-2% of capital).
Wait for candle close above breakout level, not just intraday movement.
🔹 Invalidation:
If price fails to hold above neckline and breaks below 55,167, pattern becomes invalid.
This setup favors bulls as long as price sustains above the neckline.
Disclaimer: This analysis is for educational and informational purposes only. Please consult your financial advisor before making any trading or investment decisions.

#OP/USDT#OP
The price is moving within a descending channel on the 1-hour frame and is expected to break and continue upward.
We have a trend to stabilize above the 100 moving average once again.
We have a downtrend on the RSI indicator that supports the upward move with a breakout.
We have a support area at the lower limit of the channel at 0.600, acting as strong support from which the price can rebound.
Entry price: 0.616
First target: 0.630
Second target: 0.641
Third target: 0.658

06/02 Weekly GEX Analysis - 6000 Looks EasyThe biggest event last week was undoubtedly the court ruling involving Trump. The market responded with optimism, and on Thursday premarket, SPX surged toward the 6000 level — only to get instantly rejected. That strong rejection suggests this is a firm resistance zone.
From the GEX expiry matrix, it's clear that the market is hedging upward for this week, but downward for next week. To me, this indicates that while the near-term GEX sentiment remains slightly bullish, the market may be preparing for a pullback or retest in the medium term.
This week, SPX has already entered a GEX zone surrounded by positive strikes — up to around the 6000 level. That makes 6000 an “easy target” for bulls, and we’ll likely see profit-taking here, just like we did last Thursday premarket.
⚠️ However, if we look more closely at the weekly net open interest:
...we can see a strong bullish net OI build-up starting to emerge around the 6100 level — a price zone that currently feels distant and even unreachable. But if the 6000 resistance breaks, we could see a fast gamma-driven squeeze up to 6050 and possibly 6100 before the next wave of profit-taking kicks in.
As is often the case during bullish moves, the market seems blind to the bigger picture — no one’s looking down, only up. The mood is greedy, and momentum favors the bulls... for now.
Never underestimate FOMO — but also never underestimate Trump. He’s unlikely to accept the court’s decision on tariffs quietly. Any new negative headline could shake the market, no matter where price is sitting…

AVGO Broadcom Options Ahead of EarningsIf you haven`t bought AVGO before the rally:
Now analyzing the options chain and the chart patterns of AVGO Broadcom prior to the earnings report this week,
I would consider purchasing the 250usd strike price Calls with
an expiration date of 2025-6-13,
for a premium of approximately $14.75.
If these options prove to be profitable prior to the earnings release, I would sell at least half of them.
Disclosure: I am part of Trade Nation's Influencer program and receive a monthly fee for using their TradingView charts in my analysis.

Don't miss today's signal.Hello friends
Based on the extensive and comprehensive analysis we conducted, we were able to obtain the buying points and targets for this currency for you so that you can buy in stages with risk and capital management.
*Trade safely with us*

NVDA NVIDIA Corporation Options Ahead of EarningsIf you haven`t bought NVDA before the previous earnings:
Now analyzing the options chain and the chart patterns of NVDA NVIDIA Corporation prior to the earnings report this week,
I would consider purchasing the 131usd strike price Puts with
an expiration date of 2025-6-20,
for a premium of approximately $7.00.
If these options prove to be profitable prior to the earnings release, I would sell at least half of them.
I`m overall bullish long term on NVDA.
Disclosure: I am part of Trade Nation's Influencer program and receive a monthly fee for using their TradingView charts in my analysis.

#OP/USDT#OP
The price is moving within a descending channel on the 1-hour frame, adhering well to it, and is heading for a strong breakout and retest.
We are seeing a bounce from the lower boundary of the descending channel, which is support at 0.653.
We have a downtrend on the RSI indicator that is about to be broken and retested, supporting the upward trend.
We are looking for stability above the 100 moving average.
Entry price: 0.702
First target: 0.757
Second target: 0.805
Third target: 0.865

#OP/USDT#OP
The price is moving within a descending channel on the 1-hour frame and is expected to continue upward.
We have a trend to stabilize above the 100 moving average once again.
We have a downtrend on the RSI indicator, which supports the upward move by breaking it upward.
We have a support area at the lower limit of the channel at 0.817.
Entry price: 0.860
First target: 0.891
Second target: 0.916
Third target: 0.950

QURE uniQure Options Ahead of EarningsAnalyzing the options chain and the chart patterns of QURE uniQure prior to the earnings report this week,
I would consider purchasing the 15usd strike price Calls with
an expiration date of 2026-1-16,
for a premium of approximately $2.32.
If these options prove to be profitable prior to the earnings release, I would sell at least half of them.

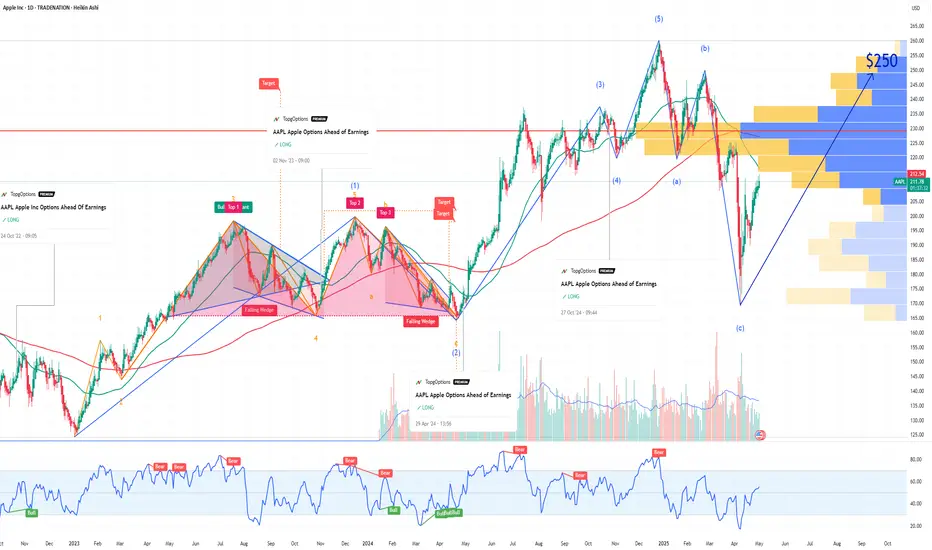
AAPL Apple Options Ahead of EarningsIf you haven`t bought AAPL before the previous rally:
Now analyzing the options chain and the chart patterns of AAPL Apple prior to the earnings report this week,
I would consider purchasing the 255usd strike price Calls with
an expiration date of 2026-1-16,
for a premium of approximately $7.30.
If these options prove to be profitable prior to the earnings release, I would sell at least half of them.
Disclosure: I am part of Trade Nation's Influencer program and receive a monthly fee for using their TradingView charts in my analysis.