Banknifty pin point analysis profit booked.Nothing much to say. Price speaks and it's very loud . It's just that you need to learn. Do go through my profile, if u wanna learn banknifty options trading.
Options-strategy

EUR/USD 20 year low what happens with Peace?EUR/USD has taken the brunt of the USD strength since the Ukraine War and Russian sanctions soured the economic outlook of the Eurozone.
What happens with peace? Well obviously we rally but the argument is that with the ECB acting as well we will not just bounce but fly back above EUR/USD 1.10.
Now timing this potential outcome is the issue and we could rally organically from 20 year lows if the USD weakens as well.
FX Options are a solution and on our easyMarkets Options are made accesible for everyone. 3 month EUR/USD is currently 240 pips so we have a long time for peace with a maximum loss of 240pips.
For more information on Options, Professional traders will get a 1-1 tutorial from a FX options Dealer.

USD / INR Forex BreakoutThis Currency Pair has broken out and retested, therefore may undergo a reversal rally. Trade is supported by Supports Nearby.
Risk Reward Ratio - 2:1
SL is placed below the support zone & the lower trendline. The target is placed near resistance.

Gold (MCX) Breakout & RetestGold Petal MCX ( Commodity ) has broken out and retested, therefore may undergo a reversal rally. Trade is supported by Supports Nearby.
Risk Reward Ratio - 2:1
SL is placed below the support zone & the lower trendline. The target is placed near resistance.

AAPL LONG - Trade Idea$AAPL Would be foolish of me to not include this on the watchlist as the 150C is on everyone and their mothers radar. The flow in 150C is beautiful and if there is any dip come monday market open this will be one of the first contracts I enter. 5/20 150C on AAPL. If we dip further I will scale further into the position. Unless we break previous LOD at 143 does not make sense for me to cut, but I see it as better priced contracts I will DCA into. Great week to make some very good money with a SL of a break below 143. Play next week contracts and your risking a max of -50-60% value to make 100% plus on a break-over 150 overnight swing as IV flows into your premiums. R/R is vital to understand to be successful in a volatile market.

$AAPL shares up today on thinner volumesEven though the $AAPL shares are up today, the volumes are not great today with only half an hour remaining. The volume is much lower than the previous days when the stock was beaten strongly. I'd wait till Monday to comment whether the stock has bottomed out.

NIFTY Breakout (15 Minute Time Frame)INTRADAY/BTST Trade Idea
The index looks to have broken out of the descending trendline and looks to rally. It looks good to be bullish in the ultra short term. We can go long in the nifty future or hedged Bullish Option strategy.
Long @ 16015
Target @ 16285
Stop Loss @ 15878
DYOR before trading or investing. Not Responsible For P&L.

S&P 500 looks bearish at the current levelS&P 500 broke the major support level of 4062 yesterday and today's trade was a confirmation of that with another lower low and lower high. The next major support level is 3594 which is another 10% away.

SPX Probably Closing below 4000 Once AgainSPX would probably close again below 4000. The next major support level is at 3594, around 10% further down from here.
Would be interesting to watch in the next few days.

One Swing trading Equity Option -HEROMOTOCOHEROMOTOCO buy above 2437-2460
Target -2500, 2555. 2600, 2640, 2700
SL below 2280/ 2395 as per your risk
Better to create option strategy
Buy HERMOTOCO 2500 CALL along with Sell of 2600 CALL May Expiry
Max loss:-9000
Max. Profit:-19000

Weekly Prediction 9-13 May QQQ Iron CondorQQQ
9 - 13 May
The weekly VXN-> Volatility Index for S&P 100 index / Nasdaq
Implied = 37.4
In this we have to standard it for weekly session
37.4 / sqrt(52-> 52 weeks in a year) = 5.19%
My historical product is telling me with 1.5x coficient that the expected movement for this week
E Volatility = 38.02 / sqrt(52) = 5.27%
With this data, from my calculations, when EV > VIX, there were a 86.6% chance that the market
stay within the bottom and top created with the ranged from the E Vol
So for next week this range for us is going to be
TOP - 325.5
BOT - 293
Lets look into an iron condor oppotunity for trading:
325Call Sell - 328Call Buy
293Put sell - 290 Put buy
This is giving us at the current moment a 0.35 expectancy
So taking into account from 1109 weekly candles, that 86.6% of the times the market stay within our top/bot channel,
Our profit margin would be 86.4% * 0.35 - 13.6%*1 = 16.9ROI after 100 trades

$SPX testing major support level 4062Today's low tested major support level for S&P 500 at 4062 once again. Let's see what happens on Monday.
Even the good Nonfarm Payroll numbers were not able to cheer the market.

NASDAQ BEARISHI can def see it going sideway till open for a recovery pop then fade the rest of the day tomorrow is friday. First week of may.

VRM another 20.5K Calls in the Options Chain !!After a block o 35K calls on April 21, today VRM has another 20.5K calls expiring on the same date, May 20, same strike price, $2.5.
They paid a premium of over $200K for the calls.
The chart is full of bullish divergences and the stock is undervalued.
I think the earnings (in 4 days) will deliver a surprise and the stock will bounce to $3!
The stock is now $1.42, a rare buy opportunity in my opinion!
Looking forward to read your opinion about it.

BANKNIFTY TRADES WITH EASY BUY AND SELL SIGNALSTHE INDICATOR base entry, once turn the trend lines green we will initiate CALL option or long in FUTURE
Once trend lines red will initiate PUT option or short FUTURE
Indicator available with small one time charge...+917410564245


BUY Opportunity on DE40Good chance here to make some money
Always play safe, take no more than 2% risk per trade.
Price will hit TP (14241)
Cheers

Short and Long Iron Condor SPX 05 May 2022We can estimate with a 84% confidence that the volatility for today is going to be below 1.65%
For this the market will stay within
TOP 4371
BOT 4230
At the same time We can estimate with a 86% confidence that the volatility for today is going move more than
0.4% based on the last 5658 Daily candles.
For this the market will stay above the
TOP 4306
BOT 4272
From the fundamental point of view, yesterday we had the release of the interest rates, so I believe currently
we are in a short relief moment, where we can have for some days/weeks a small bull trend
For today we have no big volatility news, so we cant expect big surprises.
From volume point, we can see that the point of concentration is around 4300-4285
Having said that we have 2 different ways of trading for today
IRON CONDOR for the first option, with the 4370sell 4400buy Call / 4230sell 4200buy Put
Reverse IRON CONDOR for the second option wiht 4305buy 4330sell Call/ 4275buy 4250sell PUT

One Swing trading Equity Option -APOLLOHOSPAPOLLO HOSP sell below 4293
SL above 4350/4450 (depending on your target)
Target- 4250, 4225, 4205, 4142, 4050
Option strategy :- +1x 26MAY2022 4300PE - ₹ 185.2
-1x 26MAY2022 4200PE - ₹ 138.2
Max. Profit ₹ +6,625 (35.19%)
Max. Loss ₹ -5,875 (-31.21%)
Max. RR Ratio 1:1.13
Breakevens 0-4253.0

TECHNICAL BREAKOUT LEVELS FOR NIFTY.125+ POINTS Nifty Targets on Either Side.
.................................................

Bank Nifty AlgoHere I developed after many years how typically Banknifty indices operate sudden huge move, its completely controlled by Big players after trapping retailers SL. There are few methods identified and back tested after several months. Basically its perfectly works with Banknifty future & Option buyers. Can easily capture 200 to 300 points from sudden level in intraday. The purpose of this indicator mainly to eliminate Fear, greedy, emotions., its basically "KONW YOUR RISK & REWARD" & Kindly note this for only intraday players how to use it. Its updated version of Millreeh
This indicator facility to plot following for some reason,
1. SMA 20 & 200
2. Swing forming in MTF (current chart TF, 15, 1 Hr )
The basic setup categories two way
1. Setup2 - Just taking out retailer SL zone and trade against Retailers & RR 1:5
2. Algorithm Setup - Join hand with big players. (When S2 Fails) & RR 1:10
How to use for Setup2:
1. Keep your Chart 3 mins
2. Identify Reaction zone/area ( Where to take trade)
3. Action center (When to enter & Know the SL level)
4. Exit Trade ( Know the Target level)
For Algo setup its need lot experience to spot and its move like free fall most of time.

DOA trading Strategy - SPY#SPY - Update, we are currently bouncing at HL
If we hold here we'll see $445 by May 16, 2022

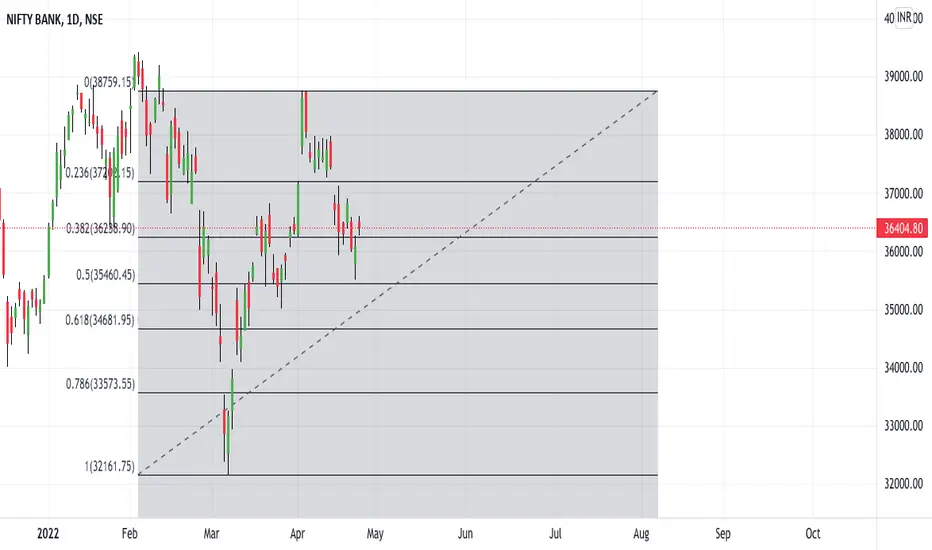
i just be waiting for the fib levels to get broke...there no such big bad news in the market yet the sentiments are still a bit bearish. will be wating for the bearish signal. not so comfortable to take long position for today.