Opening (IRA): USO Nov 15th 63 Covered Call... for a 61.27 debit.
Comments: Adding to my USO position at strikes better than what I currently have on (the Nov 15th 67's and the Dec 20th 69's). Selling the -75 delta call against stock to emulate the delta metrics of a 25 delta short put, but with built-in short call defense.
Metrics:
Buying Power Effect/Break Even: 61.27/share
Max Profit: 1.73 ($173)
ROC at Max: 2.82%
50% Max: .87 ($87)
ROC at 50% Max: 1.41%
Will generally look to take profit at 50% max, roll out short call on side test.
Optionsstrategies

Opening (IRA): IWM Oct 25th 185/207.5/207.5/230 Iron Fly... for a 12.32 credit.
Comments: More small stuff while I thumb twiddle, waiting for longer-dated setups to play out.
Metrics:
Buying Power Effect: 10.18
Max Profit: 12.32
25% Max: 3.08
ROC at 25% Max: 25.00%
Break Evens: 195.18/219.82

GBP/USD: Bullish Continuation or Reversal?Today, GBP/USD continues its upward trend and is trading around 1.312 by the end of the session. Overall, the pair is approaching a key support level, and the EMA 34 and EMA 89 lines have not yet reversed, indicating that bullish momentum may still be in play. The recent price pullback seems more like a test rather than a confirmed reversal.
However, we must not rule out the possibility of breaking support, especially if the Head and Shoulders pattern completes as projected. The 1.3261 resistance level is currently being actively defended by sellers. Should a break occur, GBP/USD will present a profitable opportunity for short sellers, with the price potentially heading towards the lower boundary of the ascending channel once again.
This is a critical moment to closely monitor the market. Whether it's a continuation of the uptrend or a support break, make sure you're ready for both scenarios.
Good luck with your trading!

USDJPY: Back to Uptrend?Hello everyone,
Currently, USDJPY continues its strong upward momentum, trading steadily around the high level of 146.70, up 0.19% on the day.
From a technical analysis perspective, USDJPY is forming an Elliott Wave 5 pattern, with the first three waves already completed (currently in wave 4). Ben expects the support level around 145.77, aligning with the 0.618 Fibonacci retracement of the previous upward move, to hold, with the next target being the psychological level of 149.22.
What about you? Where do you think USDJPY will gain strength next? Share your thoughts!

XAUUSD: Positive Technical OutlookHello everyone!
Currently, gold is hovering around the $2,658 mark in early trading, showing a slight recovery after its price correction from $2,640 late yesterday.
On the technical chart, gold continues to maintain a strong uptrend within a parallel wedge pattern, with the convergence of the 34 and 89 EMAs signaling further upward potential. A solid support level is also clearly established, reinforcing this recovery trend.
Given these factors, we can confidently expect gold to break out of its current sideways phase, likely surpassing the upper boundary of the wedge and pushing higher in the near future. Therefore, the preferred strategy right now is to *buy* – seize this opportunity, my friends!

BANK NIFTY INTRADAY LEVELS FOR 04/10/2024BUY ABOVE - 51990
SL - 51820
TARGETS - 52120,52260,52400
SELL BELOW - 51670
SL - 51820
TARGETS - 51530,51400,51230
NO TRADE ZONE - 51670 to 51990
Previous Day High - 52600
Previous Day Low - 51670
Based on price action major support & resistance's are here, the red lines acts as resistances, the green lines acts as supports. If the price breaks the support/resistance, it will move to the next support/resistance line. White lines indicates previous day high & low, high acts as a resistance & low acts as a support for next day.
Trendlines are also significant to price action. If the price is above/below the trendlines, can expect an UP/DOWN with aggressive move.
Please NOTE: this levels are for intraday trading only.
Disclaimer - All information on this page is for educational purposes only,
we are not SEBI Registered, Please consult a SEBI registered financial advisor for your financial matters before investing And taking any decision. We are not responsible for any profit/loss you made.
Request your support and engagement by liking and commenting & follow to provide encouragement
HAPPY TRADING 👍

NIFTY INTRADAY LEVELS FOR 04/10/2024BUY ABOVE - 25310
SL - 25240
TARGETS - 25380,25440,25490
SELL BELOW - 25240
SL - 25310
TARGETS - 25190,25130,25080
NO TRADE ZONE - 25240 to 25310
Previous Day High - 25620
Previous Day Low - 25240
Based on price action major support & resistance's are here, the red lines acts as resistances, the green lines acts as supports. If the price breaks the support/resistance, it will move to the next support/resistance line. White lines indicates previous day high & low, high acts as a resistance & low acts as a support for next day.
Trendlines are also significant to price action. If the price is above/below the trendlines, can expect an UP/DOWN with aggressive move.
Please NOTE: this levels are for intraday trading only.
Disclaimer - All information on this page is for educational purposes only,
we are not SEBI Registered, Please consult a SEBI registered financial advisor for your financial matters before investing And taking any decision. We are not responsible for any profit/loss you made.
Request your support and engagement by liking and commenting & follow to provide encouragement
HAPPY TRADING 👍

EURUSD: Continuously searching for new bottoms!Dear Investors,
Today, let's dive into the EURUSD pair analysis with Conan!
In recent days, EURUSD has not had many big fluctuations, but still maintains the trend of finding new bottoms through red candles. Technically, the double top pattern has been confirmed and the price has broken the 1.1100 level, opening the possibility of a deeper decline. However, to break the strong support at 1.1000, the sellers need confirmation from the new resistance zone at 1.1085 - a level that matches the 0.618 Fibonacci level in our forecast. Potential profit-taking levels that investors can consider are 1.1000 and 1.0900 respectively.
What do you think about this analysis? Share your views!

BANK NIFTY INTRADAY LEVELS FOR 03/10/2024BUY ABOVE - 53140
SL - 52970
TARGETS - 53290,53200,53700
SELL BELOW - 52800
SL - 52970
TARGETS - 52620,52400,52260
NO TRADE ZONE - 52800 to 53140
Previous Day High - 53180
Previous Day Low - 52800
Based on price action major support & resistance's are here, the red lines acts as resistances, the green lines acts as supports. If the price breaks the support/resistance, it will move to the next support/resistance line. White lines indicates previous day high & low, high acts as a resistance & low acts as a support for next day.
Trendlines are also significant to price action. If the price is above/below the trendlines, can expect an UP/DOWN with aggressive move.
Please NOTE: this levels are for intraday trading only.
Disclaimer - All information on this page is for educational purposes only,
we are not SEBI Registered, Please consult a SEBI registered financial advisor for your financial matters before investing And taking any decision. We are not responsible for any profit/loss you made.
Request your support and engagement by liking and commenting & follow to provide encouragement
HAPPY TRADING 👍

NIFTY INTRADAY LEVELS FOR 03/10/2024BUY ABOVE - 25860
SL - 25790
TARGETS - 25920,25980,26050
SELL BELOW - 25700
SL - 25790
TARGETS - 25610,25550,25490
NO TRADE ZONE - 25700 to 25860
Previous Day High - 25920
Previous Day Low - 25700
Based on price action major support & resistance's are here, the red lines acts as resistances, the green lines acts as supports. If the price breaks the support/resistance, it will move to the next support/resistance line. White lines indicates previous day high & low, high acts as a resistance & low acts as a support for next day.
Trendlines are also significant to price action. If the price is above/below the trendlines, can expect an UP/DOWN with aggressive move.
Please NOTE: this levels are for intraday trading only.
Disclaimer - All information on this page is for educational purposes only,
we are not SEBI Registered, Please consult a SEBI registered financial advisor for your financial matters before investing And taking any decision. We are not responsible for any profit/loss you made.
Request your support and engagement by liking and commenting & follow to provide encouragement
HAPPY TRADING 👍

Trading strategy !Hello, dear traders! In my view, the recent rally in gold is mainly due to expectations of lower US interest rates and the growing demand for safe havens amid geopolitical uncertainty. Currently, gold is trading around $2,660, down -0.14% on the day. However, I believe that the overall bullish trend remains intact.
Looking at the 4-hour chart, I can see that XAUUSD is holding above the rising trendline and the 34.89 EMA. This reinforces the idea that gold prices could continue to rise. If gold breaks above the all-time high of $2,685, this could signal further upside momentum, targeting round numbers like $2,700 and even the psychological level of $2,750.
What do you think about the trend of XAUUSD? Do you see more room for it to break higher? Let's discuss!

Gold price today is still supported to increase !Hello everyone! What do you expect from the gold price today, let's discuss today's strategy?
Yesterday XAUUSD did not change much compared to yesterday's trading session, fluctuating around $2656, down 0.1% due to lack of new bullish momentum.
Although it is under some short-term pressure due to the strength of the USD, the situation in the Middle East is gradually strengthening, promoting the demand for safe-haven gold.
Besides, there is still positive potential for further appreciation of XAUUSD, as it is still in an unbroken upward channel. A break of $2660 will not see significant resistance until $2670.
What do you think?

USDJPY: Strong recovery from 143.00Ben, hello everyone! Let's dive into today's USDJPY analysis with Ben!
USDJPY is in an uptrend today, currently trading at 143.95, up 0.29% on the day.
With USDJPY continuing to trade steadily at this positive level, the resistance level of 144.50 will be set as a short-term target, before potentially reacting and testing the price level of 143.00, forming a trend line and using it as strong support for further increases in the medium and long term. The current expected price levels are at the round level of 145.00 and 146.00 respectively and even the upper trend channel limit at 147.00.
Wishing you all profitable trading!

XAUUSD: 500 pip trading strategy!Dear friends, XAUUSD continues to gain some recovery momentum as it has reclaimed 2625, but the main trend and the long-term trend are still moving in a bearish direction from the head and shoulders perspective.
In the short term, the price is approaching 2650 and XAUUSD is approaching the neckline limit. And the bearish pattern is expected to continue to strengthen in the near term, as shown by the unchanged 34.89 EMA, the target is the support levels of 2605 - 2600.
And you, how do you think XAUUSD will move in today's trading day!

Gold price may break through to 2700Gold extended its decline after hitting a record high, currently trading around $2,650. However, the precious metal remains in an uptrend on a short, medium and long-term basis, and since the basic principle of technical analysis is that “the trend is your friend”, the odds are in favor of further upside for the yellow metal.
Support levels to watch are: 2,650 - 2,644
Resistance levels to watch are: 2,670 - 2,680 - 2,700

BANK NIFTY INTRADAY LEVELS FOR 30/09/2024BUY ABOVE - 54400
SL - 54150
TARGETS - 54600,54800,55000
SELL BELOW - 54150
SL - 54400
TARGETS - 53920,53700,53500
NO TRADE ZONE - 53700 to 53930
Previous Day High - 54400
Previous Day Low - 53700
Based on price action major support & resistance's are here, the red lines acts as resistances, the green lines acts as supports. If the price breaks the support/resistance, it will move to the next support/resistance line. White lines indicates previous day high & low, high acts as a resistance & low acts as a support for next day.
Trendlines are also significant to price action. If the price is above/below the trendlines, can expect an UP/DOWN with aggressive move.
Please NOTE: this levels are for intraday trading only.
Disclaimer - All information on this page is for educational purposes only,
we are not SEBI Registered, Please consult a SEBI registered financial advisor for your financial matters before investing And taking any decision. We are not responsible for any profit/loss you made.
Request your support and engagement by liking and commenting & follow to provide encouragement
HAPPY TRADING 👍

NIFTY INTRADAY LEVELS FOR 30/09/2024BUY ABOVE - 26250
SL - 26150
TARGETS - 26350,26460,26560
SELL BELOW - 26150
SL - 26250
TARGETS - 26050,25980,25920
NO TRADE ZONE - 26150 to 26250
Previous Day High - 26250
Previous Day Low - 26150
Based on price action major support & resistance's are here, the red lines acts as resistances, the green lines acts as supports. If the price breaks the support/resistance, it will move to the next support/resistance line. White lines indicates previous day high & low, high acts as a resistance & low acts as a support for next day.
Trendlines are also significant to price action. If the price is above/below the trendlines, can expect an UP/DOWN with aggressive move.
Please NOTE: this levels are for intraday trading only.
Disclaimer - All information on this page is for educational purposes only,
we are not SEBI Registered, Please consult a SEBI registered financial advisor for your financial matters before investing And taking any decision. We are not responsible for any profit/loss you made.
Request your support and engagement by liking and commenting & follow to provide encouragement
HAPPY TRADING 👍

ACN Accenture plc Options Ahead of EarningsIf you haven`t bought ACN before the previous earnings:
Now analyzing the options chain and the chart patterns of ACN Accenture plc prior to the earnings report this week,
I would consider purchasing the 340usd strike price Calls with
an expiration date of 2024-11-15,
for a premium of approximately $11.55.
If these options prove to be profitable prior to the earnings release, I would sell at least half of them.

Opening (IRA): QQQ October 18th 430 Monied Covered Call... for a 424.60 debit.
Comments: Re-upping in the Q's after profit taking ... .
As with my IWM position, I'm not being as aggressive as I usually am from a delta standpoint. This is because I've already made money in the cycle and want to give myself a little more room to be wrong since we've had somewhat of a bodice ripper from early August lows. Selling the -84 short call against stock, resulting in a setup with a net delta of around 16.
Metrics:
Buying Power Effect/Break Even: 424.60
Max Profit: 5.40
ROC at Max: 1.27%
50% Max: 2.70
ROC at 50% Max: .64%
Will generally look to take profit at 50% max/roll out in-profit short call if there's a sell-off and the setup's net delta converges on +30.

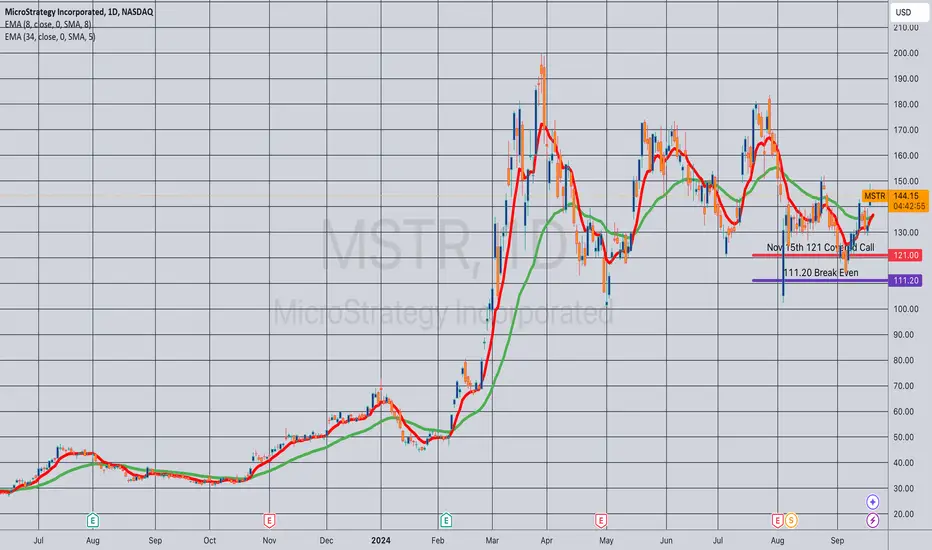
Opening (IRA): MSTR Nov 15th 121 Monied Covered Call... for a 111.20 debit.
Comments: High IV (88.8%). Selling the -75 delta call against stock to emulate the delta metrics of a 25 delta short put with the built-in defense of the short call.
Back into MSTR after taking off my previous November setup in profit. (See Post Below). This has earnings on 11/6, so I'll be looking to take it off before then ... .
Metrics:
Buying Power Effect/Break Even: 111.20
Max Profit: 9.80
ROC at Max: 8.81%
50% Max: 4.90
ROC at 50% Max: 4.41%
Part 1: Option Selling: A Simple Way to Earn Consistent PremiumsWe’ll explore the top 7 option-selling strategies on the NSE (National Stock Exchange) that could help traders target up to 10% monthly returns per Month on their capital. Option selling is an advanced strategy that can generate consistent income, but it’s important to balance high rewards with the right risk management. Whether you are new to options or an experienced trader, this guide will provide an overview of each strategy, rated based on its risk, reward, and suitability for achieving your financial goals.
Option Selling on NSE: A Simple Way to Earn Consistent Premiums
Introduction
Option selling is a great way to make steady income on the NSE. Instead of waiting for big market moves, you can sell options and collect premium upfront. It’s a strategy that benefits from time decay, meaning the longer the option sits without action, the more money you can make. Let’s break down why it works and why traders love it on the NSE.
What is Option Selling?
When you sell an option, you’re giving someone the right to buy or sell an asset at a specific price. In return, you get paid a premium upfront. As long as the market stays within a certain range, you keep that money.
Selling a Call : You profit if the price stays below a certain level.
Selling a Put : You profit if the price stays above a certain level.
It’s simple – the less the market moves, the more you earn.
Why Traders Choose Option Selling
1. Immediate Income
You get paid right away when you sell an option. No waiting for market moves, just steady income.
2. Time is Your Friend
As time passes, options lose value due to time decay. This works in your favor as a seller, since the option becomes less likely to be exercised.
3. High Win Rate
You don’t need big price moves. As long as the market stays within a range, you win.
4. Control Risk with Spreads
You can limit your risk by using spreads, where you buy another option to protect yourself if the market moves too much.
Why the NSE is Ideal for Option Selling:
High Liquidity: Options like Nifty and Bank Nifty have a lot of buyers and sellers, so trades are easy to make.Low Capital Requirement: You need less money to sell options on the NSE compared to other strategies.Risk Control: With the wide variety of options, you can set up trades that limit your risk.
Conclusion
Option selling on the NSE is a simple and effective way to generate steady income. By collecting premiums and managing risk with spreads, you can create a reliable strategy for consistent earnings. Whether you’re new to trading or experienced, option selling offers an accessible path to profit.

Opening (IRA): GDX Oct 18th 32/37/37/42 Iron Fly... for a 2.66 credit.
Comments: High IVR/High IV (59.8/35.2). Some more "little stuff" in that 45 DTE wheelhouse while I wait for other things to come in or require management.
Metrics:
Max Profit: 2.66
Buying Power Effect: 2.34
ROC at Max: 113.68%
25% Max: .67
ROC at 25% Max: 25.19%

BANK NIFTY INTRADAY LEVELS FOR 27/09/2024BUY ABOVE - 54400
SL - 54150
TARGETS - 54600,54800,55000
SELL BELOW - 54150
SL - 54400
TARGETS - 53920,53700,53500
NO TRADE ZONE - 54150 to 54400
Previous Day High - 54400
Previous Day Low - 53920
Based on price action major support & resistance's are here, the red lines acts as resistances, the green lines acts as supports. If the price breaks the support/resistance, it will move to the next support/resistance line. White lines indicates previous day high & low, high acts as a resistance & low acts as a support for next day.
Trendlines are also significant to price action. If the price is above/below the trendlines, can expect an UP/DOWN with aggressive move.
Please NOTE: this levels are for intraday trading only.
Disclaimer - All information on this page is for educational purposes only,
we are not SEBI Registered, Please consult a SEBI registered financial advisor for your financial matters before investing And taking any decision. We are not responsible for any profit/loss you made.
Request your support and engagement by liking and commenting & follow to provide encouragement
HAPPY TRADING 👍
