NIFTY INTRADAY LEVELS FOR 23/05/2024BUY ABOVE - 22640
SL - 22590
TARGETS - 22710,22780,22830
SELL BELOW - 22550
SL - 22590
TARGETS - 22500,22440,22350
NO TRADE ZONE - 22550 to 22640
Previous Day High - 22640
Previous Day Low - 22500
Based on price action major support & resistance's are here, the red lines acts as resistances, the green lines acts as supports. If the price breaks the support/resistance, it will move to the next support/resistance line. White lines indicates previous day high & low, high acts as a resistance & low acts as a support for next day.
Trendlines are also significant to price action. If the price is above/below the trendlines, can expect an UP/DOWN with aggressive move.
Please NOTE: this levels are for intraday trading only.
Disclaimer - All information on this page is for educational purposes only,
we are not SEBI Registered, Please consult a SEBI registered financial advisor for your financial matters before investing And taking any decision. We are not responsible for any profit/loss you made.
Request your support and engagement by liking and commenting & follow to provide encouragement
HAPPY TRADING 👍
Optionsstrategies

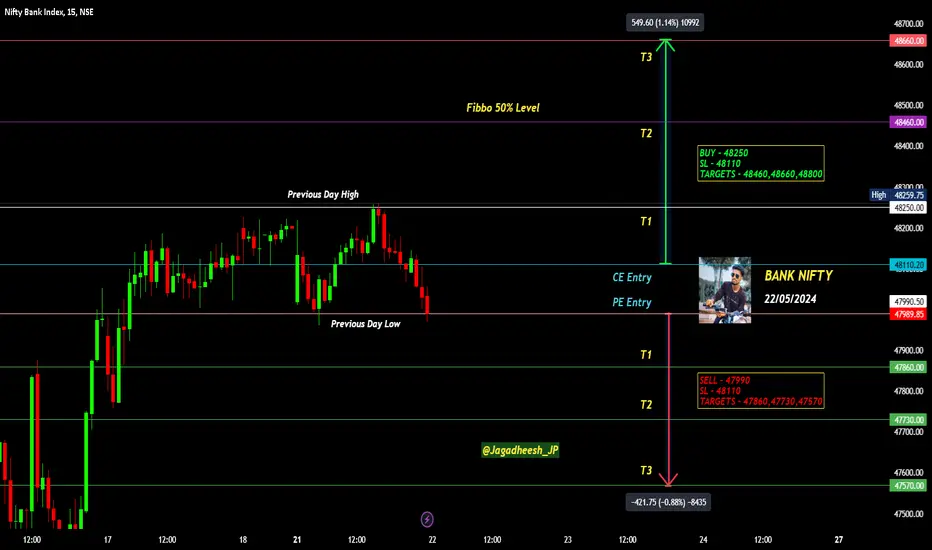
BANK NIFTY INTRADAY LEVELS FOR 22/05/2024BUY ABOVE - 48250
SL - 48110
TARGETS - 48460,48660,48800
SELL BELOW - 47990
SL - 48110
TARGETS - 47860,47730,47570
NO TRADE ZONE - 47990 to 48100
Previous Day High - 48250
Previous Day Low - 47990
Based on price action major support & resistance's are here, the red lines acts as resistances, the green lines acts as supports. If the price breaks the support/resistance, it will move to the next support/resistance line. White lines indicates previous day high & low, high acts as a resistance & low acts as a support for next day.
Trendlines are also significant to price action. If the price is above/below the trendlines, can expect an UP/DOWN with aggressive move.
Please NOTE: this levels are for intraday trading only.
Disclaimer - All information on this page is for educational purposes only,
we are not SEBI Registered, Please consult a SEBI registered financial advisor for your financial matters before investing And taking any decision. We are not responsible for any profit/loss you made.
Request your support and engagement by liking and commenting & follow to provide encouragement
HAPPY TRADING 👍
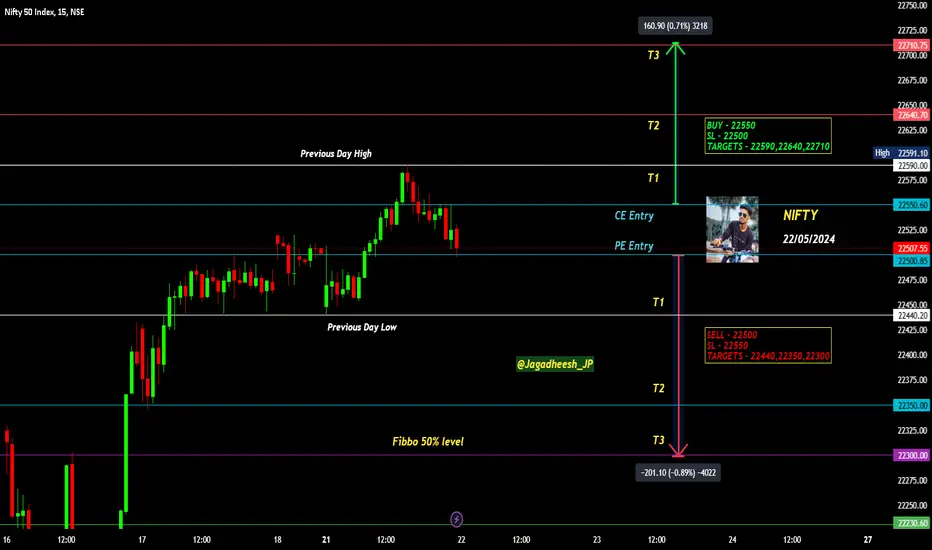
NIFTY INTRADAY LEVELS FOR 22/05/2024BUY ABOVE - 22550
SL - 22500
TARGETS - 22590,22640,22710
SELL BELOW - 22500
SL - 22550
TARGETS - 22440,22350,22300
NO TRADE ZONE - 22500 to 22550
Previous Day High - 22590
Previous Day Low - 22440
Based on price action major support & resistance's are here, the red lines acts as resistances, the green lines acts as supports. If the price breaks the support/resistance, it will move to the next support/resistance line. White lines indicates previous day high & low, high acts as a resistance & low acts as a support for next day.
Trendlines are also significant to price action. If the price is above/below the trendlines, can expect an UP/DOWN with aggressive move.
Please NOTE: this levels are for intraday trading only.
Disclaimer - All information on this page is for educational purposes only,
we are not SEBI Registered, Please consult a SEBI registered financial advisor for your financial matters before investing And taking any decision. We are not responsible for any profit/loss you made.
Request your support and engagement by liking and commenting & follow to provide encouragement
HAPPY TRADING 👍
Opening (IRA): BITO July 19th 30 Covered Call... for a 26.12 debit.
Comments: Re-upping after closing out my longer-dated covered call (which I had rolled all the way out to December).
Selling the -30 delta call against long stock here. As before, will look to roll out the short call for duration at 50% max, collect the monthly dividend along the way ... . I'll also look at selling short put, assuming I can get in on weakness and with a resulting break even better than what I currently have on.

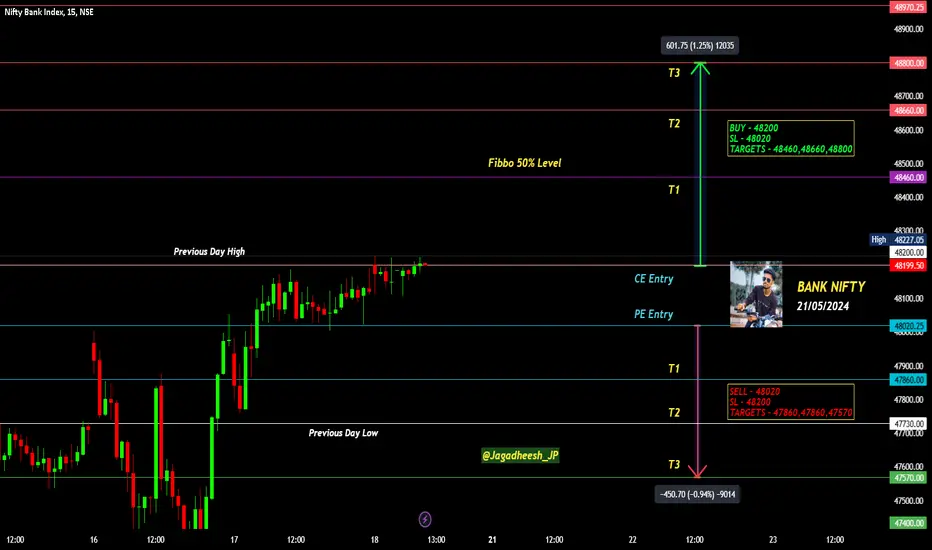
BANK NIFTY INTRADAY LEVELS FOR 21 MAY 2024BUY ABOVE - 48200
SL - 48020
TARGETS - 48460,48660,48800
SELL BELOW - 48020
SL - 48200
TARGETS - 47860,47860,47570
NO TRADE ZONE - 48020 to 48200
Previous Day High - 48200
Previous Day Low - 47730
Based on price action major support & resistance's are here, the red lines acts as resistances, the green lines acts as supports. If the price breaks the support/resistance, it will move to the next support/resistance line. White lines indicates previous day high & low, high acts as a resistance & low acts as a support for next day.
Trendlines are also significant to price action. If the price is above/below the trendlines, can expect an UP/DOWN with aggressive move.
Please NOTE: this levels are for intraday trading only.
Disclaimer - All information on this page is for educational purposes only,
we are not SEBI Registered, Please consult a SEBI registered financial advisor for your financial matters before investing And taking any decision. We are not responsible for any profit/loss you made.
Request your support and engagement by liking and commenting & follow to provide encouragement
HAPPY TRADING 👍
NIFTY INTRADAY LEVELS FOR 21 MAY 2024BUY ABOVE - 22500
SL - 22430
TARGETS - 22550,22600,22640
SELL BELOW - 22430
SL - 22500
TARGETS - 22350,22300,22230
NO TRADE ZONE - 22430 to 22500
Previous Day High - 22500
Previous Day Low - 22350
Based on price action major support & resistance's are here, the red lines acts as resistances, the green lines acts as supports. If the price breaks the support/resistance, it will move to the next support/resistance line. White lines indicates previous day high & low, high acts as a resistance & low acts as a support for next day.
Trendlines are also significant to price action. If the price is above/below the trendlines, can expect an UP/DOWN with aggressive move.
Please NOTE: this levels are for intraday trading only.
Disclaimer - All information on this page is for educational purposes only,
we are not SEBI Registered, Please consult a SEBI registered financial advisor for your financial matters before investing And taking any decision. We are not responsible for any profit/loss you made.
Request your support and engagement by liking and commenting & follow to provide encouragement
HAPPY TRADING 👍

Closed (IRA): SMH July 19th 189/199/275/285 Iron Condor... for a 1.17 debit.
Comments: Mixing and matching profitable put wing with profitable call wing from iron condors put on at different times (See Posts Below) to de-risk running into NVDA earnings on 5/22. (NVDA is around 21% of SMH holdings).
The resulting setup is a July 19th 205/215/255/265 on which I've collected a net 3.23 in credits; delta/theta -.28/3.45.
I'll look at doing a delta adjustment post-earnings if necessary.

Extreme Weather Sends Wheat Prices SurgingWheat plays a critical role in global agriculture and trade. Extreme weather has turned wheat prices bullish, rising more than 22% in a month after having languished for more than two years.
After reaching their lowest level in more than three years in March 2024, prices have rebounded strongly. Wheat rally is driven by extreme weather events in multiple places compounded by supply-demand imbalances.
Wheat rally is far from over. The May 2024 WASDE report painted a surprisingly positive outlook for wheat, suggesting an increase in US production. Outlook may be too optimistic, making revisions likely. Prices face risk to the upside once weather impact is comprehensively reassessed.
This paper posits a long position in wheat options benefiting not only from price appreciation and from expanding volatility.
WASDE PAINTS A POSITIVE WHEAT OUTLOOK
Recent WASDE report provides initial forecasts for 2024/25 marketing year (MY24/25) and updates projections for the current MY. These updates are crucial for estimating ending stocks which will be carried over to the next year.
Global production is expected to grow 1.3% in the upcoming MY to 798.19MT. Projections are even more optimistic for the US crop. USDA expects US wheat production in MY24/25 to be 3% higher YoY and total supplies to be almost 6% higher YoY.
Source: USDA
WHEAT CROPS ARE GETTING IMPACTED BY SEVERE WEATHER
Russia is the largest wheat exporter commanding 24% of total global exports. Russia has been hit by severe frost and cold.
Three of Russia’s key grain producing regions have declared a state of emergency, stating that May frost has caused severe damage to crops, reports Reuters . This year’s crop output will be lower. Frost linked damage follows record hot April which also harmed wheat crops.
The USDA has reduced its outlook for Russian wheat production by 3.5MT which might be an underestimate given widespread damage. WASDE report was released merely two days after Russia declared emergency, leaving USDA with little to no time to assess the impact.
STOCKS-TO-USE NEAR ALL-TIME-LOW
Data Source: PSD
Stocks to Use levels at major wheat exporters is currently at a 16-year low at 13.8%. It is expected to drop further to a record low of 12.4% in the upcoming MY24/25.
Low stocks-to-use ratio suggests that supplies are tight. Ending stocks are low relative to total consumption. Low stock-to-use ratios make prices extremely sensitive to minor shocks in physical markets.
MANAGED MONEY HAVE REVERSED COURSE ON WHEAT BEARISHNESS
Sentiment is shifting rapidly. Asset managers have been net short on wheat futures since 2022. This trend has reversed sharply over the last month with asset managers cutting short positioning by 70%. Net short positioning is at its lowest level since October 2022. Last week, asset managers continued to reduce their short positioning (down 35% over the past month) while also increasing their long positioning.
Source: CME QuikStrike
Bullish sentiment prevails with a put/call ratio of 0.57 in wheat options. Calls dominate both near-term and later contracts. Recent options market trading has been bullish for later expires.
Despite strong rally, implied volatility is lower than the levels seen last year and even during late 2022 signalling potential IV expansion.
Source: CME CVOL
HYPOTHETICAL TRADE SETUP
Wheat faces multifaceted upside risks stemming from weather-driven uncertainty and damage which may not have been factored into USDA’s supply outlook. Wheat supply also faces the risk of disruption from record low stocks-to-use ratio.
Wheat prices are up 22% over the last one month. A long futures position may be impacted negatively by a near-term correction. Instead, a long call position offers limited downside and substantial upside from expanding volatility and rising prices.
TradingView recently launched options suite brings traders a raft of options analytical tools. Wheat options chain can be visualised clearly.
Options IV across a range of expiries to identify key strike levels can also be visualised.
Strategy simulator enables evaluation of various strategies intuitively by visualizing the payoff based on not only price but also expansion or contraction of IV or time-decay.
The above hypothetical trade setup shows the payoff for a simple long call position in OZWU24 contract expiring on 23/August at a strike price of 750.
The premium for this option as of 17/May stood at 33 cents/bushel which results in a premium of USD 1,650 for a full options contract consisting of 5,000 bushels.
The above position breaks even at USc 783. If IV expands by 2%, the position would break even at USc 778.
Assuming constant IV, the:
• trade delivers profit of 1,850, if prices rise to 820.
• option expires worthless leading to a loss of 1,650 if prices remain below strike.
The options simulator features simple and intuitive interface enabling visualization of common options strategies. The tool also enables users to easily create and customize trading strategies.
Alternative to a long call, the bull call spread provides a pre-determined maximum profit and loss. The long call benefits from price rise and volatility expansion.
While short call offsets long call premium reducing potential losses. However, the profit potential is limited because any appreciation beyond the short call strike is negated by equivalent losses from the short position.
Bull Call Spread consists of a long call at a strike of USc 680 and a short call at a higher strike of USc 700. The width of the spread is set at 2 (700-680), a wider range can offer higher upside and reward/risk ratio, but it is only viable when the expected move is large.
MARKET DATA
CME Real-time Market Data helps identify trading set-ups and express market views better. If you have futures in your trading portfolio, you can check out on CME Group data plans available that suit your trading needs www.tradingview.com
DISCLAIMER
This case study is for educational purposes only and does not constitute investment recommendations or advice. Nor are they used to promote any specific products, or services.
Trading or investment ideas cited here are for illustration only, as an integral part of a case study to demonstrate the fundamental concepts in risk management or trading under the market scenarios being discussed. Please read the FULL DISCLAIMER the link to which is provided in our profile description.

NU Holdings Options Ahead of EarningsIf you haven`t bought NU before the previous earnings:
Then analyzing the options chain and the chart patterns of NU Holdings prior to the earnings report this week,
I would consider purchasing the 11.50usd strike price Calls with
an expiration date of 2024-5-17,
for a premium of approximately $0.67.
If these options prove to be profitable prior to the earnings release, I would sell at least half of them.

DOCS Doximity Options Ahead of EarningsIf you haven`t bought DOCS before the previous earnings:
Then analyzing the options chain and the chart patterns of DOCS Doximity prior to the earnings report this week,
I would consider purchasing the 25usd strike price Calls with
an expiration date of 2024-6-21,
for a premium of approximately $1.15.
If these options prove to be profitable prior to the earnings release, I would sell at least half of them.

GOTU Gaotu Techedu Options Ahead of EarningsIf you haven`t bought GOTU before the previous earnings:
Then analyzing the options chain and the chart patterns of GOTU Gaotu Techedu prior to the earnings report this week,
I would consider purchasing the 9usd strike price Calls with
an expiration date of 2024-7-19,
for a premium of approximately $1.12.
The chart looks bearish, but my bet is on a China recovery this year!
If these options prove to be profitable prior to the earnings release, I would sell at least half of them.

Opened (IRA): ARKK July 19th 40 Short Put... for a 1.01 credit.
Comments: Adding a short put here in the vicinity of the 25 delta out in July with a break even better than what I currently have on for my covered call. (See Post Below).
Will generally look to take profit at 50% max.

Opened (IRA): BITO April 19th 31 Covered Call... for a 27.54 debit.
Comments: High IVR/IV at 97.9/81.9% and a monthly dividend to take advantage of. However, the monthly dividend has varied widely -- with the last two distributions paying .36 (February 8th) and .73 (March 8th) with an annual dividend of 8.72 (.73 average monthly) (31.7% annualized as a function of current price).
I'm primarily looking to grab the April monthly here; anything additional above my break even will be gravy ... .
In any event, the metrics:
BPE/Break Even/Cost Basis in Shares: 27.54
Max Profit (ex. dividend): 3.46 ($346)
ROC at Max: 12.56%

Opening (IRA): SMH July 19th 205/215/275/285 IC... for a 2.17 credit.
Comments: An additive delta adjustment to the current SMH IC I have on. (See Post Below).
With the original setup's short call aspect converging on -25 delta and the short put converging on +10, selling a skewed IC with the oppositionally delta'd short call/short put (i.e., at the +25 short put and the -10 delta short call) to bring back the position back to net delta flat with 63 days until expiry.
4.40 total credits collected with a current delta/theta of 1.02/5.81.

Opening (IRA): BITO June 21st 24 Short Put... for a 1.82 credit.
Comments: Adding a short put on weakness here to my covered call, which I'm sticking in with to grab the monthly divvy.
I'm okay with being assigned additional shares, since the break even of the June 24 is below the cost basis of what I currently have on. Otherwise, I'm perfectly fine with doing my usual take profit at 50% of max.
Metrics:
Buying Power Effect/Break Even: 22.18
Max Profit: 1.82 ($182)
ROC as a Function of Buying Power Effect: 8.21%
ROC at 50% Max: 4.10%


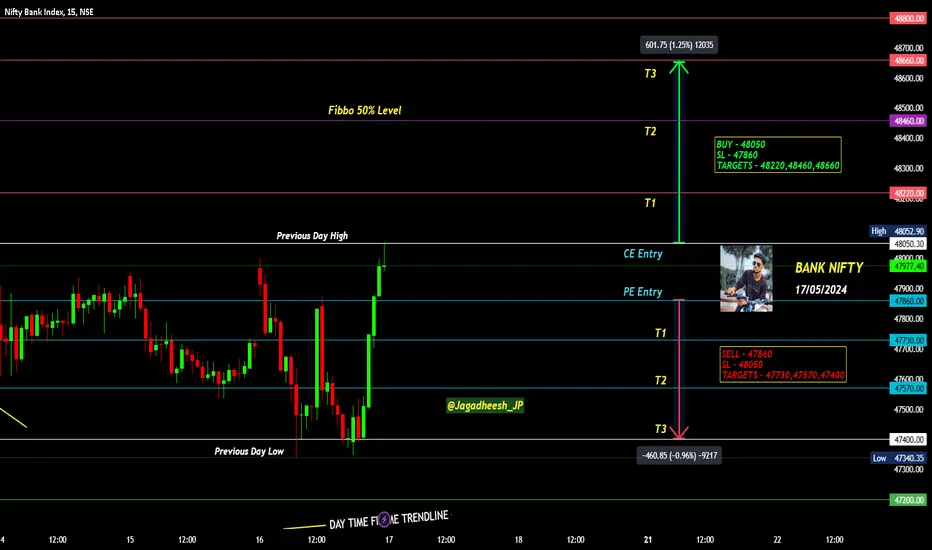
BANK NIFTY INTRADAY LEVELS FOR 17 MAY 2024BUY ABOVE - 48050
SL - 47860
TARGETS - 48220,48460,48660
SELL BELOW - 47860
SL - 48050
TARGETS - 47730,47570,47400
NO TRADE ZONE - 47860 to 48050
Previous Day High - 48050
Previous Day Low - 47400
Based on price action major support & resistance's are here, the red lines acts as resistances, the green lines acts as supports. If the price breaks the support/resistance, it will move to the next support/resistance line. White lines indicates previous day high & low, high acts as a resistance & low acts as a support for next day.
Trendlines are also significant to price action. If the price is above/below the trendlines, can expect an UP/DOWN with aggressive move.
Please NOTE: this levels are for intraday trading only.
Disclaimer - All information on this page is for educational purposes only,
we are not SEBI Registered, Please consult a SEBI registered financial advisor for your financial matters before investing And taking any decision. We are not responsible for any profit/loss you made.
Request your support and engagement by liking and commenting & follow to provide encouragement
HAPPY TRADING 👍
NIFTY INTRADAY LEVELS FOR 17 MAY 2024BUY ABOVE - 22420
SL - 22350
TARGETS - 22470,22510,22550
SELL BELOW - 22350
SL - 22300
TARGETS - 22300,22230,22160
NO TRADE ZONE - 22350 to 22420
Previous Day High - 22420
Previous Day Low - 22060
Based on price action major support & resistance's are here, the red lines acts as resistances, the green lines acts as supports. If the price breaks the support/resistance, it will move to the next support/resistance line. White lines indicates previous day high & low, high acts as a resistance & low acts as a support for next day.
Trendlines are also significant to price action. If the price is above/below the trendlines, can expect an UP/DOWN with aggressive move.
Please NOTE: this levels are for intraday trading only.
Disclaimer - All information on this page is for educational purposes only,
we are not SEBI Registered, Please consult a SEBI registered financial advisor for your financial matters before investing And taking any decision. We are not responsible for any profit/loss you made.
Request your support and engagement by liking and commenting & follow to provide encouragement
HAPPY TRADING 👍

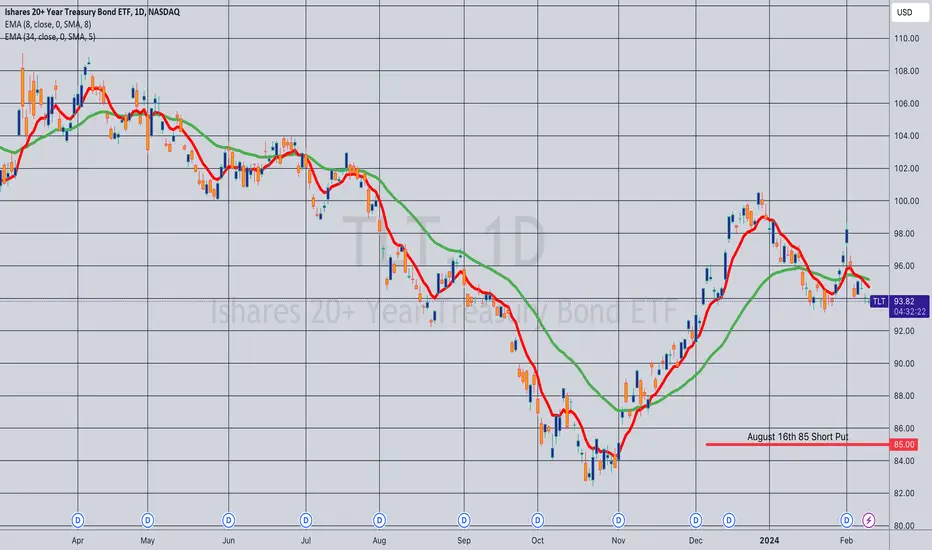
Opening (IRA): TLT August 16th 85 Short Put... for a .98 credit.
Comments: Targeting the strike paying around 1% of the strike price in credit, adding to my position at intervals, assuming I can get in at strikes better than what I currently have on.
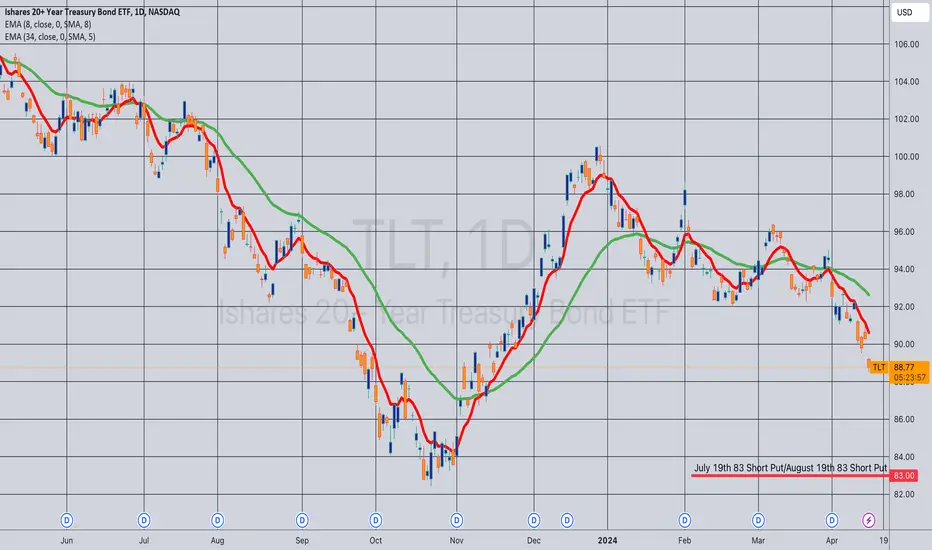
Opening (IRA): TLT July 19th 83/August 16th 83 Short PutsComments: Getting in at strikes better than what I currently have on in July and August.
July 19th 83: Filled for an .85 credit
August 16th 83: Filled for a 1.11 credit
I'm fine with potentially getting assigned with shares at 83, since they're way below the cost basis of the covered calls I currently have on. I knew this might end up being a very, very long duration trade that would potentially take time to work out, but ... yeesh, the weakness.
Will look to roll out the most at risk strikes I've got in July (at the 86) and August (at the 85) at some point ... .
BANK NIFTY INTRADAY LEVELS 16 MAY 2024BUY ABOVE - 47730
SL - 47450
TARGETS - 47930,48050,48220
SELL BELOW - 47570
SL - 47730
TARGETS - 47400,47200,47000
NO TRADE ZONE - 47570 to 47730
Previous Day High - 47930
Previous Day Low - 47570
Based on price action major support & resistance's are here, the red lines acts as resistances, the green lines acts as supports. If the price breaks the support/resistance, it will move to the next support/resistance line. White lines indicates previous day high & low, high acts as a resistance & low acts as a support for next day.
Trendlines are also significant to price action. If the price is above/below the trendlines, can expect an UP/DOWN with aggressive move.
Please NOTE: this levels are for intraday trading only.
Disclaimer - All information on this page is for educational purposes only,
we are not SEBI Registered, Please consult a SEBI registered financial advisor for your financial matters before investing And taking any decision. We are not responsible for any profit/loss you made.
Request your support and engagement by liking and commenting & follow to provide encouragement
HAPPY TRADING 👍

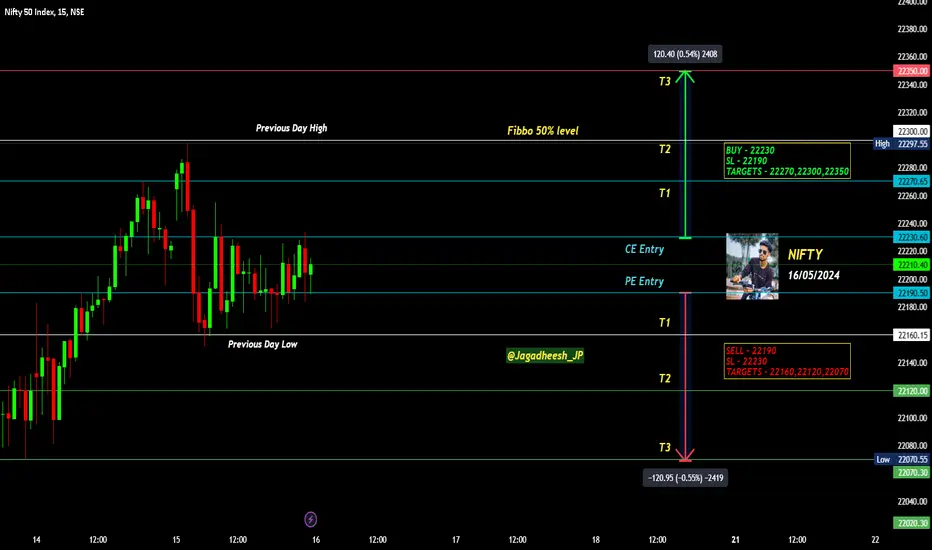
NIFTY INTRADAY LEVELS FOR 16 MAY 2024BUY ABOVE - 22230
SL - 22190
TARGETS - 22270,22300,22350
SELL BELOW - 22190
SL - 22230
TARGETS - 22160,22120,22070
NO TRADE ZONE - 22190 to 22230
Previous Day High - 22300
Previous Day Low - 22160
Based on price action major support & resistance's are here, the red lines acts as resistances, the green lines acts as supports. If the price breaks the support/resistance, it will move to the next support/resistance line. White lines indicates previous day high & low, high acts as a resistance & low acts as a support for next day.
Trendlines are also significant to price action. If the price is above/below the trendlines, can expect an UP/DOWN with aggressive move.
Please NOTE: this levels are for intraday trading only.
Disclaimer - All information on this page is for educational purposes only,
we are not SEBI Registered, Please consult a SEBI registered financial advisor for your financial matters before investing And taking any decision. We are not responsible for any profit/loss you made.
Request your support and engagement by liking and commenting & follow to provide encouragement
HAPPY TRADING 👍
BANK NIFTY INTRADAY LEVELS FOR 15/05/2024BUY ABOVE - 47900
SL - 47730
TARGETS - 48050,48220,48460
SELL BELOW - 47730
SL - 47900
TARGETS - 47560,47400,47200
NO TRADE ZONE - 47730 to 47900
Previous Day High - 47900
Previous Day Low - 47570
Based on price action major support & resistance's are here, the red lines acts as resistances, the green lines acts as supports. If the price breaks the support/resistance, it will move to the next support/resistance line. White lines indicates previous day high & low, high acts as a resistance & low acts as a support for next day.
Trendlines are also significant to price action. If the price is above/below the trendlines, can expect an UP/DOWN with aggressive move.
Please NOTE: this levels are for intraday trading only.
Disclaimer - All information on this page is for educational purposes only,
we are not SEBI Registered, Please consult a SEBI registered financial advisor for your financial matters before investing And taking any decision. We are not responsible for any profit/loss you made.
Request your support and engagement by liking and commenting & follow to provide encouragement
HAPPY TRADING 👍
