SPY WEEKLY-MAY 6 2024Welcome to SPY weekly and I have clearly explained which levels to trade & what direction market can take.
If you have any questions feel free to DM
NOTE: AVOID TRADING SPY
Optionsstrategies

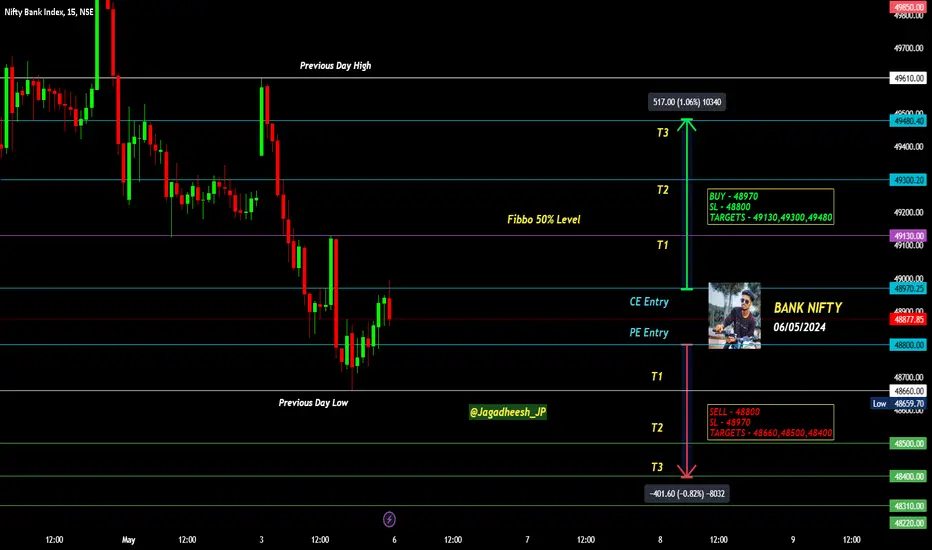
BANK NIFTY INTRADAY LEVELS FOR 06/05/2024BUY ABOVE - 48970
SL - 48800
TARGETS - 49130,49300,49480
SELL BELOW - 48800
SL - 48970
TARGETS - 48660,48500,48400
NO TRADE ZONE - 48800 to 48970
Previous Day High - 49610
Previous Day Low - 48660
Based on price action major support & resistance's are here, the red lines acts as resistances, the green lines acts as supports. If the price breaks the support/resistance, it will move to the next support/resistance line. White lines indicates previous day high & low, high acts as a resistance & low acts as a support for next day.
Trendlines are also significant to price action. If the price is above/below the trendlines, can expect an UP/DOWN with aggressive move.
Please NOTE: this levels are for intraday trading only.
Disclaimer - All information on this page is for educational purposes only,
we are not SEBI Registered, Please consult a SEBI registered financial advisor for your financial matters before investing And taking any decision. We are not responsible for any profit/loss you made.
Request your support and engagement by liking and commenting & follow to provide encouragement
HAPPY TRADING 👍
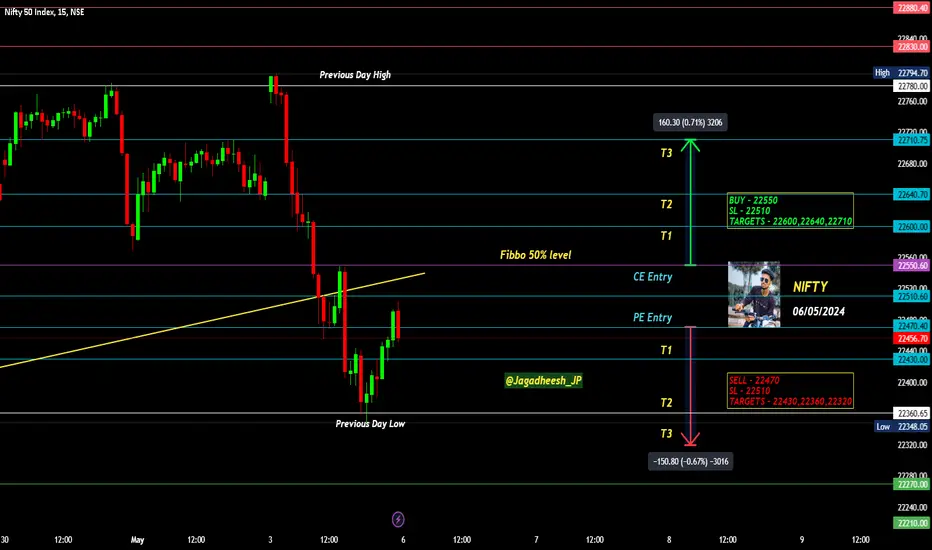
NIFTY INTRADAY LEVELS FOR 06/05/2024BUY ABOVE - 22550
SL - 22510
TARGETS - 22600,22640,22710
SELL BELOW - 22470
SL - 22510
TARGETS - 22430,22360,22320
NO TRADE ZONE - 22470 to 22550
Previous Day High - 22780
Previous Day Low - 22360
Based on price action major support & resistance's are here, the red lines acts as resistances, the green lines acts as supports. If the price breaks the support/resistance, it will move to the next support/resistance line. White lines indicates previous day high & low, high acts as a resistance & low acts as a support for next day.
Trendlines are also significant to price action. If the price is above/below the trendlines, can expect an UP/DOWN with aggressive move.
Please NOTE: this levels are for intraday trading only.
Disclaimer - All information on this page is for educational purposes only,
we are not SEBI Registered, Please consult a SEBI registered financial advisor for your financial matters before investing And taking any decision. We are not responsible for any profit/loss you made.
Request your support and engagement by liking and commenting & follow to provide encouragement
HAPPY TRADING 👍
DDOG Datadog Options Ahead of EarningsIf you haven`t sold DDOG before the previous earnings:
Then analyzing the options chain and the chart patterns of DDOG Datadog prior to the earnings report this week,
I would consider purchasing the 125usd strike price Puts with
an expiration date of 2024-6-21,
for a premium of approximately $9.10.
If these options prove to be profitable prior to the earnings release, I would sell at least half of them.

Mayor resistanceI bought puts there expire a month from now strike 190. That's a mayor resistance zone I think is going to 180 right there 10 dollars drop. My SL 195.

Opening (IRA): IWM Sept/Oct 160/150 Short PutsComments: Going ahead and rounding out Q3 rungs here with IVR at 82.7.
September 20th 160: filled for a 1.99 credit
October 18th 150: filled for a 1.61 credit
Will look to manage shorter duration rungs as I come to them ... .

Opening (IRA): TLT July 19th 86 Short Put... for a .98 credit.
Comments: Adding to my TLT position on weakness here, targeting the strike paying around 1% of the strike price in credit.
I already have rungs on in April/May/June, so am adding a smidge out in July.
With QQQ and SPY knocking on ATH's, holding off on my usual broad market plays to await weakness and/or higher IV.

Opening (IRA): QQQ September 20th 430 Short Put... for a 4.34 credit.
Comments: Adding a rung out in Sept at the <16 delta strike paying around 1% of the strike price in credit to emulate dollar cost averaging Into the Q's. I already have rungs on in June, July, and August ... .
Will naturally back-track into shorter duration if I can get in at strikes better than what I currently have on.

Opening (IRA): QQQ August 16th 370 Short Put... for a 4.30 credit.
Comments: Targeting the <16 delta strike paying around 1% of the strike price in credit to emulate dollar cost averaging into the Q's.
Adding at a strike better than what I currently have on in August ... .

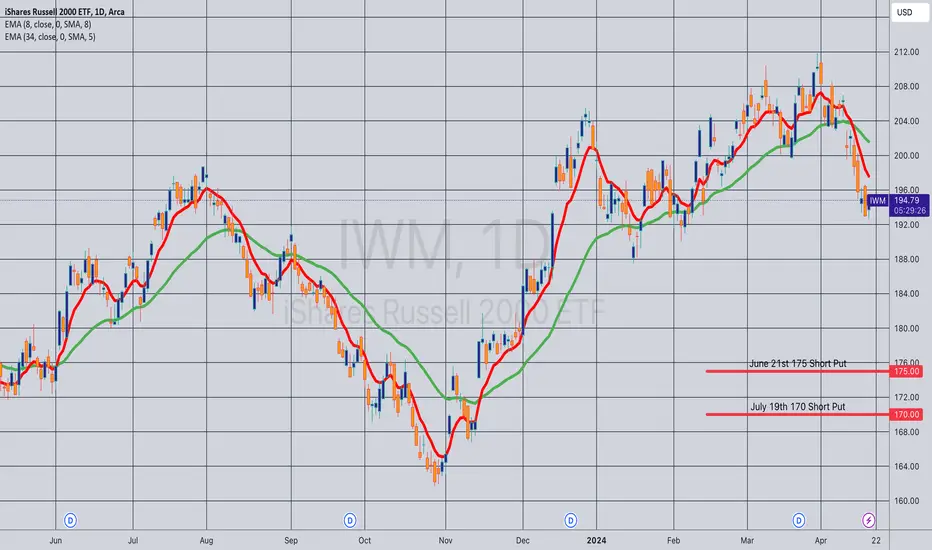
Opening (IRA): IWM August 16th 170 Short Put... for a 1.78 credit.
Comments: Starting to round out my Q3 rungs here on weakness and higher IV, targeting the <16 delta strike paying around 1% of the strike price in credit to emulate dollar cost averaging into the broad market. Already have June and July rungs on, so going out to August here.

Opened (IRA): IWM June/July 182/180 Short PutsComments: Added at strikes better than what I currently have on in weakness, targeting the <16 delta strikes in the respective expiries paying around 1% of the strike price in credit to emulate dollar cost averaging into the small cap ETF.
June 21st 182: Filled for 1.89
July 19th 180: Filled for 2.22
I also briefly looked at QQQ and SPY, but couldn't get in at strikes better than what I currently have on, so am leaving those positions alone for now.

Opening (IRA): IWM June 21st 175/July 19th 170 Short PutsComments: Targeting the <16 delta strikes paying around 1% of the strike price in credit to emulate dollar cost averaging into the small caps ETF.
Adding here on weakness, better strikes than what I currently have on in those expires.
Filled the June 21st for a 1.75 credit; the July 21st 170 for 1.76.
Opening (IRA): IWM June 21st 185 Short Put... for a 1.87 credit.
Comments: Targeting the <16 delta strike in the shortest duration that pays around 1% of the strike price in credit to emulate dollar cost averaging into the broad market.
The ROC %-age isn't tremendously sexy here, so primarily doing this to keep theta on and burning while I work shorter duration, higher IV underlyings (e.g., SMH, XBI, GDX/GDXJ, etc.).

Opening (IRA): XBI June 21st 82 Short Put... for a 1.90 credit.
Comments: Selling a put here, since the resulting cost basis if assigned shares would be lower than the cost basis of the position I've currently got on now. The full position is now a June 21st 82/88 covered strangle (i.e., short put, stock, short call).
Will look to take profit at 50% max.
Metrics:
Buying Power Effect/Break Even/Cost Basis in Shares if Assigned: 80.10
ROC at Max as a Function of Buying Power Effect: 2.37%
ROC at 50% Max as a Function of Buying Power Effect: 1.19%
Delta/Theta: 23.36/2.42

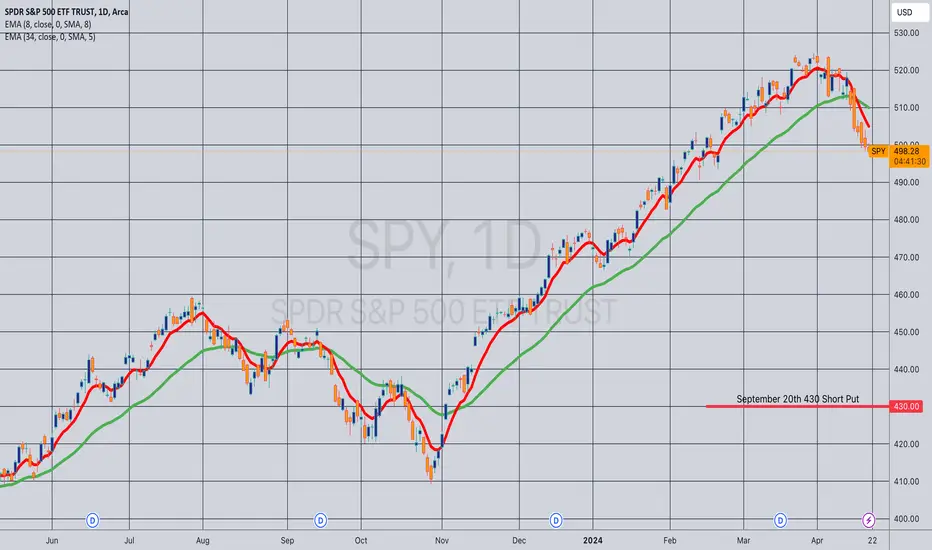
Opening (IRA): SPY September 20th 430 Short Put... for a 4.34 credit.
Comments: Targeting the <16 delta strike paying around 1% of the strike price in credit to emulate dollar cost averaging into S&P 500 ETF, adding at a strike better than what I currently have on.
As with my other broad market, will look to generally take profit at 50% max or -- if assigned -- sell call against at the strike price my short put was at.
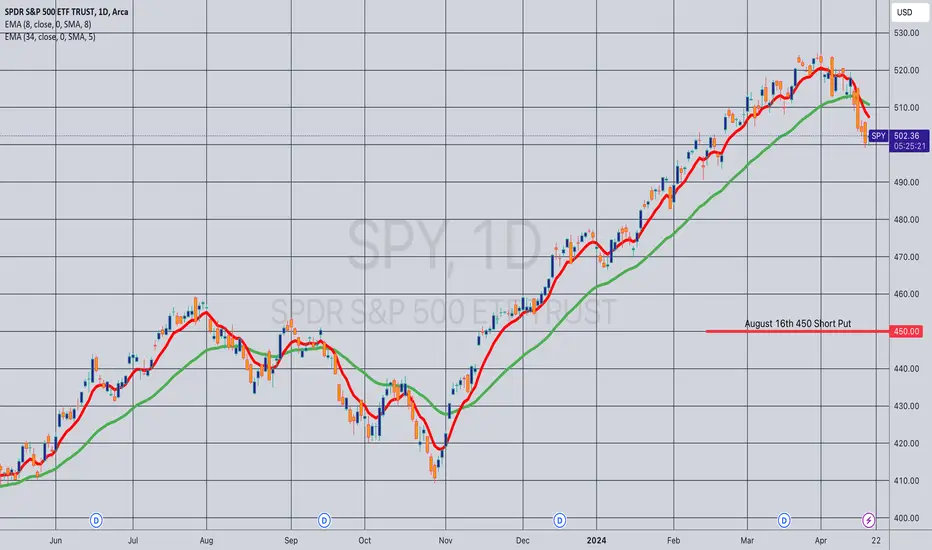
Opening (IRA): SPY August 16th 450 Short Put... for a 4.50 credit.
Comments: Targeting the <16 delta strike paying around 1% of the strike price in credit to emulate dollar cost averaging into the S&P 500 ETF.
Here, adding a strike better than what I currently have on in the August expiry.
Will generally look to take profit at 50% max.
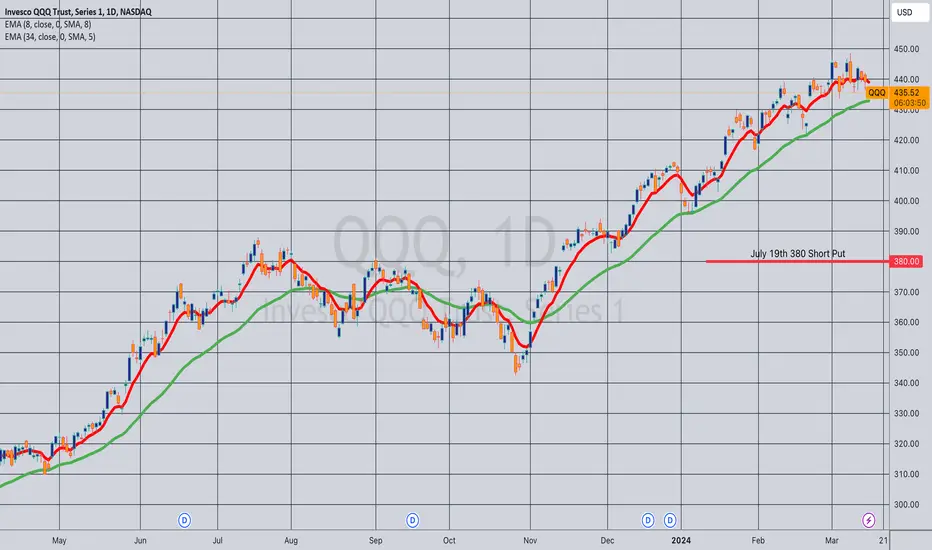
Opening (IRA): QQQ July 21st 380 Short Put... for a 3.90 credit.
Comments: Starting to tip-toe into Q3 (July/August/September) contracts in broad market (IWM, SPY, QQQ). Targeting the <16 delta strike paying around 1% of the strike price in credit to emulate dollar cost averaging into the broad market.
As usual, will look to sell in shorter duration on weakness, assuming I can get in at strikes better than what I currently have on.
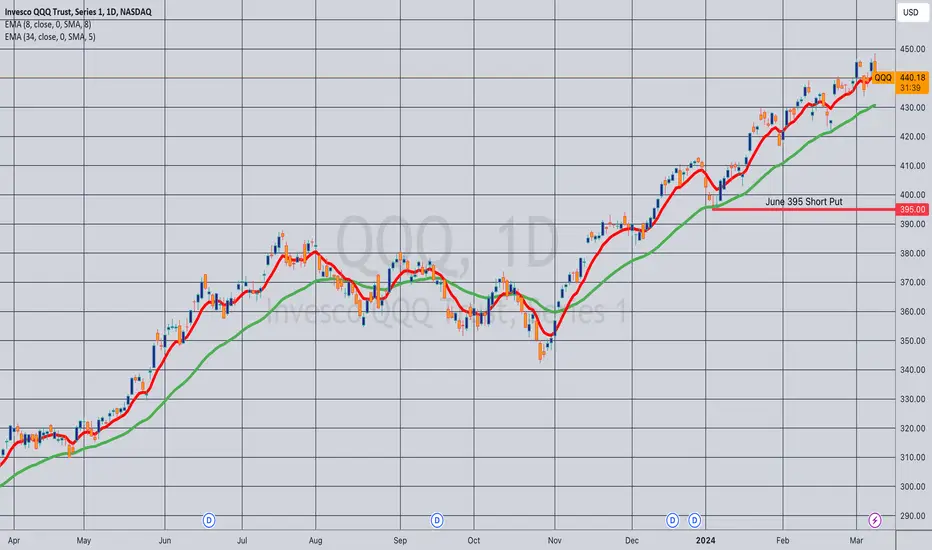
Opening (IRA): QQQ June 21st 395 Short Put... for a 4.09 credit.
Comments: Finally, a bit of weakness ... . Targeting the shortest duration <16 delta strike paying around 1% of the strike price in credit to emulate dollar cost averaging in without actually being in stock.
BANK NIFTY INTRADAY LEVELS FOR 03/05/2024BUY ABOVE - 49480
SL - 49340
TARGETS - 49670,49850,50000
SELL BELOW - 49180
SL - 49340
TARGETS - 49020,48800,48630
NO TRADE ZONE - 49180 to 49480
Previous Day High - 49480
Previous Day Low - 49180
Based on price action major support & resistance's are here, the red lines acts as resistances, the green lines acts as supports. If the price breaks the support/resistance, it will move to the next support/resistance line. White lines indicates previous day high & low, high acts as a resistance & low acts as a support for next day.
Trendlines are also significant to price action. If the price is above/below the trendlines, can expect an UP/DOWN with aggressive move.
Please NOTE: this levels are for intraday trading only.
Disclaimer - All information on this page is for educational purposes only,
we are not SEBI Registered, Please consult a SEBI registered financial advisor for your financial matters before investing And taking any decision. We are not responsible for any profit/loss you made.
Request your support and engagement by liking and commenting & follow to provide encouragement
HAPPY TRADING 👍

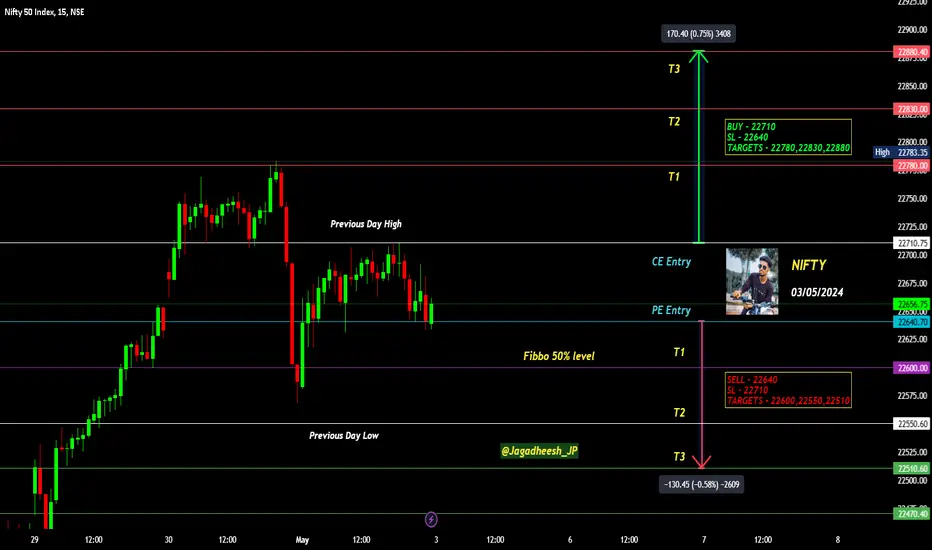
NIFTY INTRADAY LEVELS FOR 03/05/2024BUY ABOVE - 22710
SL - 22640
TARGETS - 22780,22830,22880
SELL BELOW - 22640
SL - 22710
TARGETS - 22600,22550,22510
NO TRADE ZONE - 22640 to 22710
Previous Day High - 22710
Previous Day Low - 22550
Based on price action major support & resistance's are here, the red lines acts as resistances, the green lines acts as supports. If the price breaks the support/resistance, it will move to the next support/resistance line. White lines indicates previous day high & low, high acts as a resistance & low acts as a support for next day.
Trendlines are also significant to price action. If the price is above/below the trendlines, can expect an UP/DOWN with aggressive move.
Please NOTE: this levels are for intraday trading only.
Disclaimer - All information on this page is for educational purposes only,
we are not SEBI Registered, Please consult a SEBI registered financial advisor for your financial matters before investing And taking any decision. We are not responsible for any profit/loss you made.
Request your support and engagement by liking and commenting & follow to provide encouragement
HAPPY TRADING 👍
BANK NIFTY INTRADAY LEVELS FOR 02/05/2024BUY ABOVE - 49480
SL - 49250
TARGETS - 49670,49850,50000
SELL BELOW - 49250
SL - 49480
TARGETS - 49020,48800,48630
NO TRADE ZONE - 49250 to 49480
Previous Day High - 50000
Previous Day Low - 49250
Based on price action major support & resistance's are here, the red lines acts as resistances, the green lines acts as supports. If the price breaks the support/resistance, it will move to the next support/resistance line. White lines indicates previous day high & low, high acts as a resistance & low acts as a support for next day.
Trendlines are also significant to price action. If the price is above/below the trendlines, can expect an UP/DOWN with aggressive move.
Please NOTE: this levels are for intraday trading only.
Disclaimer - All information on this page is for educational purposes only,
we are not SEBI Registered, Please consult a SEBI registered financial advisor for your financial matters before investing And taking any decision. We are not responsible for any profit/loss you made.
Request your support and engagement by liking and commenting & follow to provide encouragement
HAPPY TRADING 👍

NIFTY INTRADAY LEVELS FOR 02/05/2024BUY ABOVE - 22600
SL - 22550
TARGETS - 22660,22710,22780
SELL BELOW - 22550
SL - 22600
TARGETS - 22510,22470,22430
NO TRADE ZONE - 22550 to 22600
Previous Day High - 22780
Previous Day Low - 22550
Based on price action major support & resistance's are here, the red lines acts as resistances, the green lines acts as supports. If the price breaks the support/resistance, it will move to the next support/resistance line. White lines indicates previous day high & low, high acts as a resistance & low acts as a support for next day.
Trendlines are also significant to price action. If the price is above/below the trendlines, can expect an UP/DOWN with aggressive move.
Please NOTE: this levels are for intraday trading only.
Disclaimer - All information on this page is for educational purposes only,
we are not SEBI Registered, Please consult a SEBI registered financial advisor for your financial matters before investing And taking any decision. We are not responsible for any profit/loss you made.
Request your support and engagement by liking and commenting & follow to provide encouragement
HAPPY TRADING 👍

BANK NIFTY INTRADAY LEVELS FOR 30/04/2024BUY ABOVE - 49480
SL - 49250
TARGETS - 49670,49850,50000
SELL BELOW - 49250
SL - 49480
TARGETS - 49020,48800,48630
NO TRADE ZONE - 49250 to 49480
Previous Day High - 49480
Previous Day Low - 48310
Based on price action major support & resistance's are here, the red lines acts as resistances, the green lines acts as supports. If the price breaks the support/resistance, it will move to the next support/resistance line. White lines indicates previous day high & low, high acts as a resistance & low acts as a support for next day.
Trendlines are also significant to price action. If the price is above/below the trendlines, can expect an UP/DOWN with aggressive move.
Please NOTE: this levels are for intraday trading only.
Disclaimer - All information on this page is for educational purposes only,
we are not SEBI Registered, Please consult a SEBI registered financial advisor for your financial matters before investing And taking any decision. We are not responsible for any profit/loss you made.
Request your support and engagement by liking and commenting & follow to provide encouragement
HAPPY TRADING 👍
