Opening (IRA): TNA April 17th 29 Covered Call... for a 28.28 debit.
Comments: Adding at strikes better than what I currently have on. Selling the -84 delta call against shares to emulate the delta metrics of a 16 delta short put, but with the built-in defense of the short call.
Metrics:
Buying Power Effect/Break Even: 28.28/share
Max Profit: .72
ROC at Max: 2.55%
50% Max: .36
ROC at 50% Max: 1.28%
Will generally look to take profit at 50% max, add at intervals assuming I can get in at strikes better than what I currently have on, roll out short call in the event my take profit is not hit.
Optionsstrategies

Opening (IRA): SPX May 16th 5000/5030/5785/5815 Iron Condor... for a 10.45 credit.
Comments: High IVR. After having taken small profit on the setup I put on before "Liberation Day," back in with a more symmetric setup in a higher IV environment.
Metrics:
Buying Power Effect: 19.55
Max Profit: 10.45
ROC at Max: 53.45%
50% Max: 5.23
ROC at 50% Max: 26.73%
Will generally look to take profit at 50% max, roll in untested side on side test, manage at 21 DTE.

Opening (IRA): SPXL March 21st 154 Covered Call... for a 151.04 debit.
Comments: Selling the -84 call against shares to emulate the delta metrics of a 16 delta short put, but with the built-in defense of the short call. (In all honesty, this is just an attempt to keep my theta/net liquidity ratio above .05, which is kind of the minimum of where I like to have it).
Metrics:
Buying Power Effect/Break Even: 151.04/share
Max Profit: 3.96
ROC at Max: 1.96%
50% Max: 1.98
ROC at 50% Max: .98

Opening (IRA): SOXL March 21st 29 Covered Call... for a 26.85 debit.
Comments: High IV; starter position. Selling the -75 delta call against shares to emulate the delta metrics of a 25 delta short put, but with the built-in defense of the short call.
Metrics:
Buying Power Effect/Break Even: 26.85
Max Profit: 2.15
ROC at Max: 8.01%
50% Max: 1.08
ROC at 50% Max: 4.00%
Will generally look to take profit at 50% max, add at intervals if I can get in at better strikes/better break evens than what I currently have on, and/or roll out the short call if take profit is not hit.

Opening (IRA): SOXL April 17th 24 Covered Call... for 22.48 debit.
Comments: Starting my run at April, adding at strikes better than what I currently have on.
Metrics:
Buying Power Effect/Break Even: 22.48
Max Profit: 1.52
ROC at Max: 6.76%
50% Max: .76
ROC at 50% Max: 3.38%
Will generally look to take profit at 50% max, add at intervals assuming I can get in at strikes better than what I currently have on, and/or roll out short call if my take profit is not hit.

Opening (IRA): SOXL May 16th 17 Covered Call... for a 15.68 debit.
Comments: Laddering out a smidge here, selling the -84 delta call against shares to emulate the delta metrics of a 16 delta short put, but with the built-in defense of the short call.
Metrics:
Buying Power Effect/Break Even: 15.68
Max Profit: 1.32
ROC at Max: 8.42%
50% Max: .66
ROC at 50% Max: 4.21%
Will generally look to take profit at 50% max, add at intervals, assuming I can get in at strikes/break evens than what I currently have on, and/or roll out short call if my take profit is not hit.
Opening (IRA): SMCI April 17th 34 Covered Call... for a 32.13 debit.
Comments: High IVR/IV. Selling the -84 delta call against shares to emulate the delta metrics of a 2 x expected move 16 delta short put, but with the built-in defense of the short call.
Metrics:
Buying Power Effect/Break Even: 32.13/share
Max Profit: 1.87
ROC at Max: 5.82%
50% Max: .94
ROC at 50% Max: 2.91%
Will generally look to take profit at 50% max, roll out short call if take profit is not hit.

Opening (IRA): PYPL February 21st 77.5/82.5/97/102 Iron Condor... for a 1.66 credit.
Comments: Earnings announcement volatility contraction play.
Metrics:
Max Profit: 1.66
Buying Power Effect: 3.34
ROC at Max: 49.70%
50% Max: .84
ROC at 50% Max: 24.85%

Opening (IRA): PLTR May 17th 100 Covered Call... for a 86.55 debit.
Comments: After closing out my long-dated covered call for a realized gain, re-upping with a shorter duration setup with a max profit potential of greater than 11.18, which is what I'm net down on this underlying YTD.
Metrics:
Buying Power Effect/Break Even: 86.55
Max Profit: 13.45
Will look to roll out the short call at 50% max to reduce my break even.

Opening (IRA): LULU April 17th 300/310/390/400 Iron Condor... for a 3.39 credit.
Comments: Delta neutral earnings announcement IV contraction play.
Metrics:
Buying Power Effect: 6.61
Max Profit: 3.39
ROC at Max: 51.3%
50% Max: 1.70
ROC at 50% Max: 25.6%
Will generally look to take profit at 50% max ... .

Opening (IRA): IWM May 16th 190/195/220/225 Iron Condor... for a 1.70 credit.
Comments: I think I have more than enough long delta on at the moment, so opting to go nondirectional/delta neutral here. Selling the 25's and buying the wings out from there, collecting one-third the width of the wings in credit.
Metrics:
Buying Power Effect: 3.30
Max Profit: 1.70
ROC at Max: 51.5%
50% Max: .85
ROC at 50% Max: 25.8%
Will generally look to take profit at 50% max, roll in oppositional side on side test.

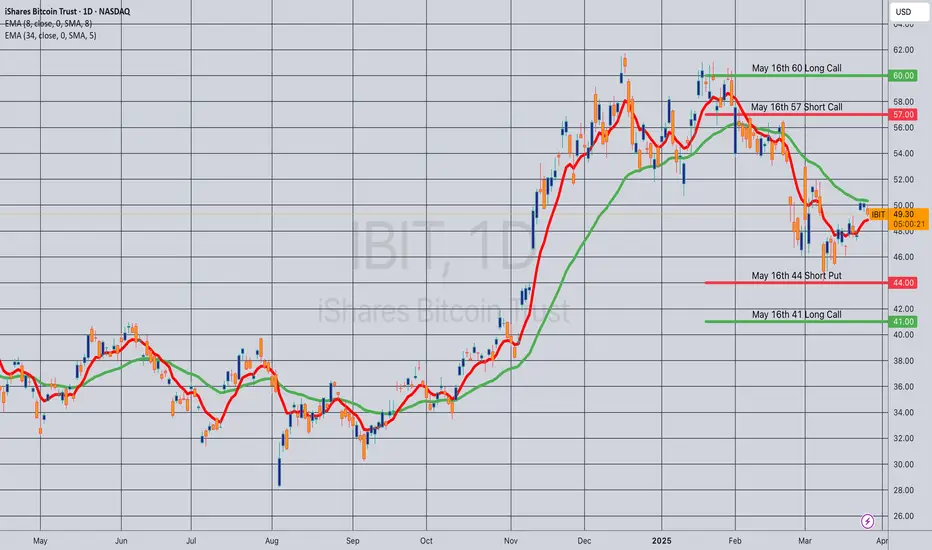
Opening (IRA): IBIT May 16th 41/44/57/60 Iron Condor... for a 1.02 credit.
Comments: Going neutral assumption here, selling the 25 delta's and buying wings 3 strikes out, collecting one-third the width of the wings.
Metrics:
Buying Power Effect: 1.98
Max Profit: 1.02
ROC at Max: 51.5%
50% Max: .51
ROC at 50% Max: 25.8%
Will generally look to take profit at 50% max, roll wings in on side test.
Update: EWZ December 2026 32 Covered CallHere, starting to break my EWZ position (See Post Below) into its constituent pieces.
The first piece involves shares I acquired way back at 31.65/share. (Ugh). Rather than go back and calculate trade to date break even, I'm going out far in duration to sell the short call at or above my break even. Sometimes, you have to go way longer dated than you'd like, but I'm fine with devoting some buying power to this, particularly since EWZ pays a fairly decently dividend, albeit only twice a year.
The remaining legs are the January 17th 26 short put -- on which I'm pretty sure I'll be assigned shares, and the January 17th 23 short put, which is in-the-money by .50 or so. On assignment, I'll look to sell the call at the strike at which I was assigned and go from there ... .

Opening (IRA): EWZ Oct 17th 26/45 Short Call Vertical... for a 1.13 credit.
Comments: I'm fairly certain that I'm going to be assigned on my January 17th 26 short put, so am going out to October to sell a spread with the short leg at the 26 strike that pays at least 1.00. The reason I do this (sell a call for at least 1.00), is that this enables me to roll the short call down a strike by 1.00 without giving up profit potential if I need to. The 26 short call aspect of this spread will become the short call aspect of an October 17th 26 covered call, with the covered call setup having a break even of the strike at which I was assigned (26) minus the 1.13 in credit I got paid for this spread or 24.87.
Because I haven't been assigned shares yet and short calls are generally verboten in a cash secured account like an IRA, I've had to pay a few bones (.05 to be exact), to define the risk of the short call. I also had to pay a debit that is equal to the width of the spread (19.00) minus the credit received of 1.13 or 17.87 for the spread. I'm fine with this, since this buying power will eventually free up when I get assigned.
Naturally, the October expiry is extremely long-dated. I'm fine with this here, since EWZ pays a fairly decent dividend, albeit only in June and December.

Opening (IRA): COIN March 21st 220 Covered Call... for a 215.96 debit.
Comments: High IV + weakness. Selling the -85 delta call against shares to emulate the delta metrics of a 16 delta short put, but with the built-in defense of the short call. Going lower net delta due to the shorter duration (35 DTE).
Metrics:
Buying Power Effect/Break Even: 215.96/share
Max Profit: 4.04
ROC at Max: 1.87%
50% Max: 2.02
ROC at 50% Max: .94
Will generally look to take profit at 50% max, roll out short call if my take profit is not hit.

Opening (IRA): TMF May 17th 39 Covered Call... for a 38.06 debit.
Comments: Along with TLT, one of the only red things on my ETF board. Doing a starter position here, selling the -75 delta call against shares to emulate the delta metrics of a 25 delta short put, but with the built-in defense of the short call.
Metrics:
Buying Power Effect/Break Even: 38.06/share
Max Profit: .94
ROC at Max: 2.47%
50% Max: .47
ROC at 50% Max: 1.24%
Will generally look to take profit at 50% max, add at intervals if I can get in at strikes/break evens better than what I currently have on, and/or roll out the short call at 50% max.

Opening (IRA): SPX May 16th 5130/5160/5850/5880 Iron Condor... for a 10.20 credit.
Comments: High IVR/IV >21. Hesitant to add more long delta here, so going delta neutral in SPX and structuring the trade such that I receive one-third the width of the wings (30) in credit.
Metrics:
Buying Power Effect: 19.80
Max Profit: 10.20
ROC at Max: 51.52%
50% Max: 5.10
ROC at 50% Max: 25.8%
Will generally look to take profit at 50% max, rolling down oppositional side on side test, but won't hesitate to take profit quickly if IV crushes in dramatically post "Liberation Day."

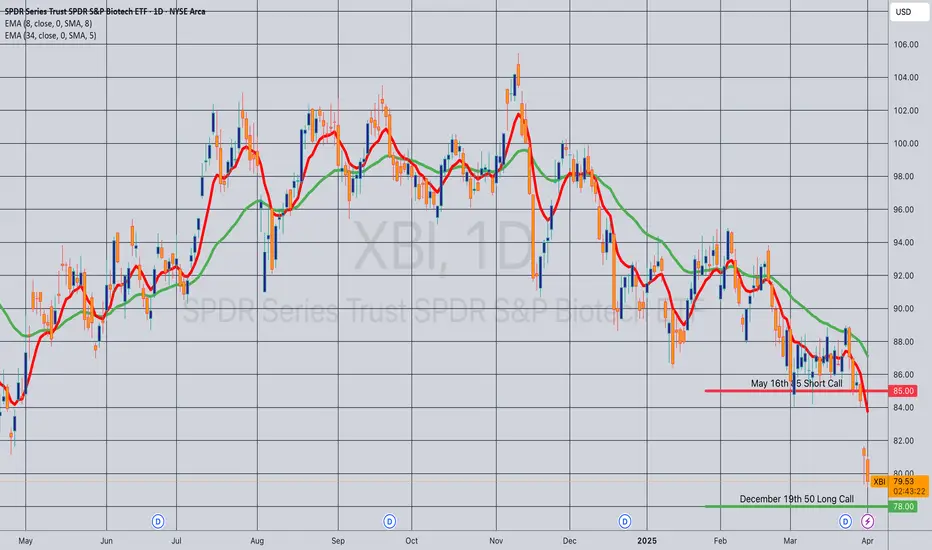
Opening (IRA): XBI May 16th -85C/December 19th 50C LCD*... for a 29.50 debit.
Comments: Adding to my XBI position at or near 52-week lows, buying the back month 90 delta and selling the front month -30 delta that pays for all of the extrinsic in the long. (The 50C is depicted at a higher strike so that it fits on the chart).
Metrics:
Buying Power Effect: 29.50
Max Profit: 5.50
ROC at Max: 18.64%
50% Max: 2.25
ROC at 50% Max: 9.37%
Will generally look to take profit at 50% max and/or roll out short call to reduce downside break even.
* -- Long call diagonal.
NEULANDLAB short opportunityUpon the breakdown of the trendline NEULANDLAB has immense downside of 42 odd percentage. Next quarter results will be the catalyst, making or breaking the stock. Negative surprise in last two consecutive results declare us participants to beware of the liquidity present below this key level.
Short below daily close of 11,100
Stoploss - 8%
TP - Trail the 50 DMA close above

Opening (IRA): TMF May 16th 37 Covered Call... for a 36.05 debit.
Comments: Adding at strikes/break evens better than what I currently have on, selling the -75 delta call against shares to emulate the delta metrics of a 25 delta short put, but with the built-in defense of the short call.
Metrics:
Buying Power Effect/Break Even: 36.05/share
Max Profit: .95
ROC at Max: 2.64%
50% Max: .48
ROC at 50% Max: 1.32%
Will generally look to take profit at 50% max, look to add at intervals if I can get in at a break even better than what I currently have on, and/or roll out short call when that aspect hits 50% max.

NVDA 2 The????NASDAQ:NVDA
Outlook - -GEX and -DEX but +OI This week. NASDAQ:NVDA ’s price action will likely hinge on broader
market sentiment rather than company-specific releases, given no major NVIDIA events are slated.
Weekly -- 2nd consecutive down week with increasing volume
Daily -- Downtrend to next HVL under 106 possible
Hourly -- Consolidating at support zone
10m -- Consolidating
Bias -Monitoring U.S. trade policy updates and technical levels for short-term direction.
Volatility remains high, so caution is warranted.
Pivot - 109.65
Upside Targets:
* 111.47--112.91--113.66--115.01
Downside Targets:
* 109.62--108.45--105.05--104.34

BTC Volatility Play: Compression, Fib Confluence & 48% IV OptionBTCUSD | Volatility Compression Meets Macro Catalyst: Options & Technical Thesis
Chart: BTC/USD 1M (BITSTAMP)
Bitcoin is currently consolidating below all-time highs after touching the $95K level. The monthly candle structure shows the first significant pause in momentum, with price now holding around the $82,000–$84,000 range. This area represents a confluence of prior resistance-turned-support, Fib retracement zones, and the VWAP session level (~$84,910).
Technically, the long-term ascending broadening wedge remains intact. MACD is extended but positive, while RSI has cooled to approximately 62. The structure supports the thesis of short-term rebalancing before a potential continuation or breakdown. Volatility compression is evident.
Options Market Context | BTC1! (May 30, 2025 Expiry)
Implied Volatility (IV): 48.1% across strikes
Underlying Spot Price: $82,978
ATM Strike: $84,500
Theta: ~ -52 per leg (high decay environment)
Delta Cluster: Calls around 0.53–0.59, Puts around -0.41 to -0.47
Despite BTC's recent move and upcoming halving-related volatility potential, the options market is pricing in moderate movement, not extreme. This opens the door for straddles, strangles, and gamma-based strategies if volatility expands or price breaks out of range.
Breakeven Analysis: BTC Straddles (May 30, 2025)
The table below illustrates the breakeven zones and required directional moves for various straddle positions, based on total premium (call + put).
Strike Total Premium ($) Upper Breakeven ($) Lower Breakeven ($) % Move Up % Move Down
82,500 13,468 95,968 69,032 15.65% 16.81%
83,000 13,454 96,454 69,546 16.24% 16.19%
84,000 13,488 97,488 70,512 17.45% 15.04%
84,500 13,546 98,046 70,954 18.16% 14.48%
85,000 13,607 98,607 71,393 18.87% 13.97%
Interpretation:
The FWB:83K –$84.5K strikes offer the most balanced convexity. The average breakeven range requires BTC to move approximately 15%–18% in either direction by expiration to achieve profitability.
Strategy Considerations
1. Long Straddle at ATM ($84,500):
Total cost: ~$13,546
Profit potential if BTC > GETTEX:98K or < $70.9K
Ideal for traders anticipating a significant move in either direction
Vega + gamma rich; best for breakout environments
2. Directional Option Play:
Long Call at $85,000 (~$6,538) for a lower-cost breakout bet
Long Put at $82,500 (~$5,713) to lean bearish
Scaled exposure possible for either side, depending on directional bias
3. Advanced Structures (Neutral Thesis):
Short Straddle or Iron Butterfly at $84,500 to harvest premium
High decay potential, but vulnerable to directional expansion
Only suitable if anticipating range-bound behavior near-term
Final Thoughts
Bitcoin is entering a historically volatile phase post-halving with price compressing below all-time highs and implied volatility sitting at moderate levels. This convergence of technical consolidation and underpriced volatility creates a strong environment for defined-risk, high-reward trades.
Whether you favor directional breakouts or volatility-based strategies, the current setup offers clear levels, manageable risk, and strong reward-to-risk symmetry.
Chart source: BTCUSD Monthly (BITSTAMP)
Options source: CME BTC Options (May 30, 2025)

NVDA Silicon Slippage: The Bearish Case for NVDA in 5 ContractsNVDA Bearish Options Thesis — “AI’s Reality Check”
A $500 Bet Against Hype, Headwinds, and a Tired Rally
Underlying: NVIDIA (NVDA)
Current Price: $109.67
Strategy: Buy 5x $90 PUTs expiring May 2, 2025 @ $1.00
Total Cost (Risk): $500
Breakeven: $89.00
Max Value at Expiry: $45,000 (if NVDA → $0)
Target Zone: $85–$95
Risk/Reward Profile: Asymmetric 1:9+
🧠 Thesis Summary: Why NVDA Could Drop
NVIDIA, the undisputed champion of the AI GPU race, now finds itself under increasing pressure from macro forces, competition, and sentiment. This trade capitalizes on a short-term reversal thesis into earnings season and macro repricing.
🚨 Key Catalysts for Downside:
🧬 1. AI Hype Fatigue
The market is cooling on generative AI names after 12+ months of hype.
Investor sentiment is shifting toward monetization over narrative — which hits NVDA’s high-multiple story.
💥 2. DeepSeek & Chinese Competition
The emergence of DeepSeek (a competitive LLM) raises the risk of a hardware shift in the East.
China accelerating self-sufficiency in chips = reduced NVDA demand.
📉 3. Macro Headwinds & Tariffs
Renewed trade war tensions threaten advanced chip exports.
Tariffs and tighter regulations = real demand compression for NVDA’s top-line growth.
📊 4. Technical Breakdown Confirmed
Weekly close below Fib 0.382 ($109.44) — now resistance.
RSI at 41.44 — weak and trending down.
Below VWAP ($113.65), signaling momentum shift.
"NVIDIA isn't breaking down because it's bad — it's breaking down because the market is waking up."
💰 Trade Breakdown: 5x $90 PUTs @ $1.00 (May 2, 2025)
Metric Value
Contracts 5
Cost per Contract $100
Total Premium $500
Breakeven $89.00
Max Gain $45,000
Max Loss $500 (premium only)
📊 P&L Scenarios (5 Contracts)
NVDA Price Drop % Intrinsic Value Total Payout Net Profit ROI (%)
$100 -8.8% $0.00 $0 -$500 -100%
$95 -13.4% $0.00 $0 -$500 -100%
$90 -17.9% $0.00 $0 -$500 -100%
$85 -22.5% $5.00 $2,500 $2,000 400%
$82.70 -24.6% $7.30 $3,650 $3,150 630%
$80 -27.1% $10.00 $5,000 $4,500 900%
🧮 Technical Levels to Watch
Level Price Notes
VWAP $113.65 Rejected
0.382 Fib $109.44 Just breached
0.5 Fib $96.07 Strong support
0.618 Fib $82.70 Bearish target
RSI 41.44 Weak momentum
✅ Summary
Factor Insight
Total Spent $500 (5x $90 PUTs @ $1.00)
Breakeven $89.00
Risk Fully capped at $500
Potential Return Up to $4,500 (900%) if NVDA → $80
Catalyst Market re-rating AI, earnings unknowns, regulatory clouds
Trade Horizon 33 days — high velocity post-breakdown possible
