Weekly GEX of SPX | Option Chain Analysis for Option TradersI’d like to share my thoughts below after analyzing the SPX option chain. In this analysis, I focus exclusively on the weekly time range, examining the SPX option chain and the changes in top-tier options metrics.
🔶 Breakout and Bullish Outlook
Last Friday's price action saw the SPX break through the 5800 call gamma wall, generating strong bullish momentum . This breakout opens the door for further upward movement throughout the week, especially if buying pressure persists. Breaking through a call gamma wall often leads to a rapid price increase, as these levels act as resistance, but once broken, they support further upward moves.
However, caution is advised, as additional call gamma levels (around 5850 and 5875) could act as resistance, where the price may stall. These levels can reverse roles and, if the price falters, could act as significant resistance, potentially leading to a pullback toward the 5800 level.
🔴 Put Skew and IVx Changes
The put pricing skew on the Options Oscillator shows a declining trend, meaning that while put options are still more expensive than calls at equivalent strikes, this trend is softening when looking at the November expiration. This indicates a weakening of put options relative to calls, which could be another bullish signal as demand for puts may be declining.
The five-day IVx average declining , indicating a decrease in market volatility = VIX is melting down.
🟨 Backwardation and Diagonal/Calendar Strategy Opportunities
It's also worth noting the 10.5% backwardation based on the IV skew for the expirations between 10/18 and 10/21 (4/7DTE). This backwardation (downward sloping volatility curve) could benefit calendar and diagonal spread strategies, as options with different expirations have varying volatility conditions.
🔶 GEX Wall Levels: Where Is Support and Resistance?
🔹Gamma Exposure (GEX) levels continue to play a crucial role in the market’s movements:
🔹On the upside, the largest call gamma wall for the next 7 days is at 5850, while the 5875 level may also act as significant resistance. The 5875 is a more likely a realistic bullish target, supported by the Options Overlay’s blue OTM delta 16 probability curve.
🔹On the downside, the 5750 put support level currently offers strong support, with sellers forming a barrier here. The 5800 level is also interesting because it was the largest call gamma level last week, meaning there could be significant volatility as bulls and bears battle around this point.
(NOTE: GEX levels is not part of the TanukiTrade Options Overlay indicator yet. The automatic GEX levels will be available by the end of October.)
🟨 How Delta 16 Curves Define My Rational Price Range in Options Trading
The blue OTM Delta 16 curves from the Options Overlay define the rational probability range for me based on a lognormal distribution. This is important because there’s a 68% chance the price will stay within this range by expiration. These values are also visible in the Overlay Expiry table.
This represents the 68% probability range defined by OTM 16 delta PUTs and OTM 16 delta CALLs, showing a clear directional expected move value. It provides an insightful view of the expected price movement’s directional range, often used by delta-neutral strangle traders like those at TastyTrade.
⅀ SPX Summary
The SPX options chain is showing a bullish direction with the breakout above 5800, but it will be key to watch the gamma levels where the market might stall this week. The rising IV and declining put skew trend could provide further signals that the bull market might continue, but the possibility of resistance or a pullback remains. For those considering diagonal strategies, the backwardation may offer interesting opportunities to capitalize on.
(NOTE: GEX levels is not part of the TanukiTrade Options Overlay indicator yet. The automatic GEX levels will be available soon, by the end of October!)
Optionstrading

BankNifty Long Trade on 15m Time Frame: Strong MomentumWe entered a long trade on BankNifty at 51155.90 on the 11th of October at 2:30 pm. The price has shown solid upward movement, and we have now set a trailing stop at 51,250 to lock in gains as we aim for higher targets.
Target Points:
TP 1: 51248.60 (hit)
TP 2: 51398.65
TP 3: 51548.70
TP 4: 51641.40
Trailing Stop: 51,250
Stop Loss (SL): 51080.85
The bullish trend remains strong, and we will continue monitoring the position for further developments as it approaches the remaining targets.

Armageddon after the election, huh?Someone yesterday dumped a lot of money into an options portfolio, that's designed to lower the price of December US10-year Bond futures. That automatically means more US 10Y yield, and since there's a strong correlation with the Dollar, it also means the Dollar is going up.
The most curious thing is watching how the S&P 500 makes ATH during rising Dollar.
Such synchronicity has historically led to powerful corrections, and something tells me that it will not be the Dollar.
Now, I ain't saying we should all go out and start selling stocks like never before. But what I am sayin' is that maybe, just maybe, we should take a step back and look at the bigger picture. Maybe the market's got some more room to run, and maybe we should be lookin' for opportunities to get in on the action.
So, yeah, the option sentiment's looking a little bearish, but that don't mean we should all be running for the hills just yet.
Let's keep our cool, do our research, and see what the market's got in store for us.

$META Trade Update This is just a follow up to the previous NASDAQ:META setup I posted yesterday.
Please watch video for additional commentary.

TIGR UP Fintech Holding Limited Options Ahead of EarningsIf you haven`t bought TIGR before the previous earnings:
Now analyzing the options chain and the chart patterns of TIGR UP Fintech Holding Limited prior to the earnings report this week,
I would consider purchasing the 4usd strike price Calls with
an expiration date of 2025-1-17,
for a premium of approximately $0.72.
If these options prove to be profitable prior to the earnings release, I would sell at least half of them.

UNFI United Natural Foods Options Ahead of EarningsAnalyzing the options chain and the chart patterns of UNFI United Natural Foods prior to the earnings report this week,
I would consider purchasing the 17usd strike price Calls with
an expiration date of 2024-10-18,
for a premium of approximately $1.25.
If these options prove to be profitable prior to the earnings release, I would sell at least half of them.

WFC Wells Fargo & Company Options Ahead of EarningsIf you haven`t bought the dip on WFC:
Now analyzing the options chain and the chart patterns of WFC Wells Fargo & Company prior to the earnings report this week,
I would consider purchasing the 51usd strike price Puts with
an expiration date of 2024-11-1,
for a premium of approximately $0.24.
If these options prove to be profitable prior to the earnings release, I would sell at least half of them.

Domino’s Pizza ($DPZ) Earnings Preview: Breakout or Breakdown?Domino's Pizza ( NYSE:DPZ ) is set to release its Q3 FY2024 earnings on October 10, pre-market, with expectations of an EPS of $3.62 and revenue around $1.1 billion. The stock is currently sitting at the 200-day EMA on the weekly chart, indicating a critical technical range. While market sentiment leans bearish, a surprise in earnings could trigger a sharp move.
Key levels to watch:
Bullish: Target above $445 on a breakout.
Bearish: Watch for a move toward $385 if earnings disappoint.
Implied volatility is currently at 7.5%, suggesting significant potential for post-earnings movement. Stay tuned for the market’s reaction!
#DPZ #Earnings #Options #Investing #Solidified

$META Wedge Breakout Setup with Key Targets AheadNASDAQ:META is attempting a wedge breakout on the session hourly, with a candle confirmation above the 9-EMA. If the breakout holds, our first target is a retest of $594.24. Should we break that, we’re looking at a potential retest of the all-time high (ATH) at $602.90. However, if the breakout fails, we could see a retest of key support levels at $588.36 and $583.14.
On the daily chart, we’re seeing a hammer candle after retesting support, alongside a 2-1-3 pattern that could signal continued momentum.

Recent Trends in Crypto Options MarketWell, he crypto options market is experiencing a surge in growth, driven by increasing adoption and maturation. Key trends include short-term turbulence versus long-term growth, with a focus on short volatility on elections and long positions on new all-time highs by the end of the year.
Whale Activity
Whales are taking a protectionist approach, with a focus on long-term optimism:
Puts: $40K is the most popular strike price, with 2562.5 contracts
Focus: November 8, 2024, and March 28, 2025
Calls: Bets on FWB:65K -$100K by the end of the year
Currently: Selling volatility at 60K-65K (November 8)
Retail Activity
Retail traders are taking an aggressive approach, with a focus on optimism:
Puts: Weak protection $60K-$61K (October 2024)
Calls: Focus on $95K-$100K (December 2024)
Summary
Short-term Turbulence vs Long-term Growth: The crypto options market is experiencing short-term turbulence, but long-term growth is expected.
Long on New ATH: Whales are taking long positions on new all-time highs by the end of the year.
Data Source for Analysis: Deribit

NIFTY Short Mastery on 15m Time Frame: 940 Points SecuredOn the 30th of September, we initiated a short entry at 25996.85 using the Risological Swing Trader, capturing a robust downtrend as the price continued to respect our dotted trendline indicator. To date, this strategy has delivered a significant 940 points in profit, exemplifying the effectiveness of our approach.
Target Points:
TP 1: 25823.50
TP 2: 25543.00
TP 3: 25262.50
TP 4: 25089.15
Stop Loss (SL): 26137.10
The Risological Swing Trader has once again proven its strength in spotting market reversals, allowing us to secure substantial gains. We will stay vigilant as we approach the reversal.

FINNIFTY Short: 1450 Points Secured with RisologicalFINNIFTY Short: 1450 Points Secured with Risological Swing Trader
Massive Short Entry Captured on 27 Sep with Risological Swing Trader
On the 27th of September, we secured a powerful short entry at 25099.95 using the Risological Swing Trader, aligning perfectly with the downtrend as indicated by our proprietary trendline. Since the entry, we've bagged an impressive 1450 points as the price action continues to confirm our strategy's precision.
Target Points:
TP 1: 24976.95
TP 2: 24777.90
TP 3: 24578.90
TP 4: 24455.90
Stop Loss (SL): 25199.50
This setup showcases the strength of Risological Swing Trader in identifying trend reversals and executing trades with pinpoint accuracy. We will continue to monitor this position as it edges closer to our final targets.

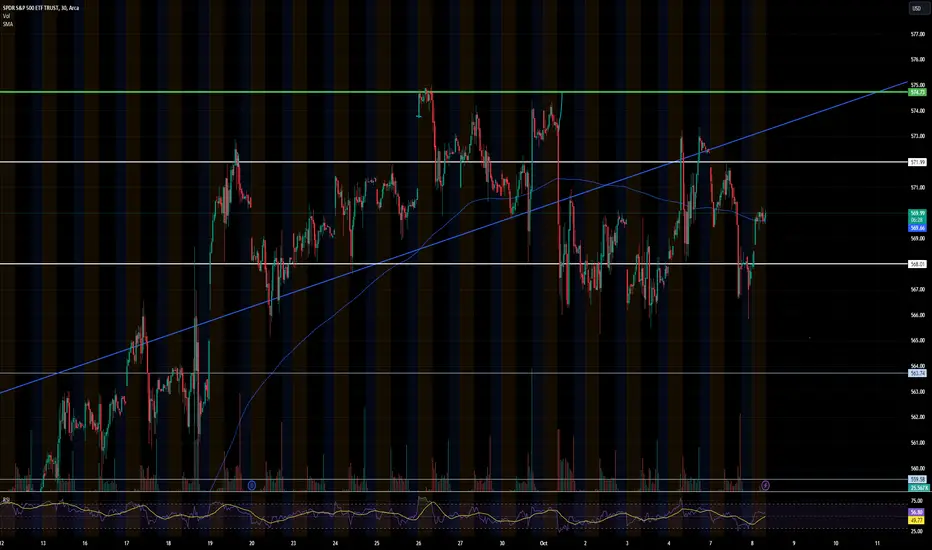
Weekly $SPY Options SPY Options to Kick off October
Election is less than a month away. Investors are taking profit and repositioning defensively until after the election noise. VIX over $21. We’re still just 3% off from all-time highs. The next catalysts are rate cuts, job numbers, and earnings. We expect volatility until the election noise settles.
This week, we are leaning bearish to start the week. However, the upside trade has the most room for continuation. We are using 15-30 minute candle closes for confirmation.
Best of luck!
$569 Call 10/16
Entry: 15-30 minute confirmation OVER $568
Targets: $569, $571, $574
$565 Put 10/16
Entry: 15-30 minute confirmation UNDER $568
Target: $565
AMEX:SPY
BankNifty 3000+ Points Profit in This MASSIVE Short TradeBankNifty 3000+ Points Profit in This MASSIVE Short Trade
Just look at this beautiful short trade.
No complex technical setup.
No small profit exits.
Neat entry, huge trade with massive 3000+ points profit.
As a trader, this is the the most ideal trade one can dream of!
How has been your trades lately?

$AMD Chart Setup: A Strategic Play Ahead of Advancing AI Event.As we approach AMD’s highly anticipated Advancing AI event this Thursday, the market may soon see the company in a whole new light. Historically, these events tend to prompt a "sell the news" reaction, giving us the opportunity to front-run the event throughout the week.
The chart is setting up nicely with a confirmed wedge breakout, supported by strong bullish volume on both daily and weekly candles. If the stock goes flat or even sells off ahead of the event, it could present a bullish opportunity for us to capitalize on, if it continues to run, could be a short opportunity as the move could be priced in.
My positions are as follows:
Calls over $171.21, with targets at $177.55 and $185.
Puts under $164.42, with targets at $162.58 and $154.49.
Let’s stay sharp and position ourselves for what could be a pivotal moment for NASDAQ:AMD this week. Cheers.

EHUSDT: Cup and handle pattern is formed. Based on the Ethereum (ETH/USDT) chart you've shared, here is a concise trading strategy:
Support Zone: The price is currently testing a key support zone around $2,350. This area has shown buying interest in the past.
Short-Term Bullish Scenario: If the price holds above this support, a potential short-term bullish move could occur, with targets at the Fibonacci retracement levels of $2,471 (0.618) and $2,520 (0.5). Watch for bullish signals in this area to confirm potential upward movement.
Bearish Scenario: If the price fails to hold this support zone, a deeper decline could follow, with a major target at the 1.618 Fibonacci extension level, around $2,054.
Trading Plan: Consider entering a long position if the price bounces off the support zone with confirmation. Set a stop-loss below the support zone. Alternatively, if the price breaks below the support, look for a short opportunity with a target near $2,054.
This strategy provides a balanced approach for both potential bullish and bearish moves.

Shake Shack SHAK likely to remain volatile into remainder of yrLooking for the price levels shown to function as turning points on the next buy & sell waves for this ticker. Trading calls & puts as appropriate at those levels.
Using ITM option contracts given the lower liquidity & wider spread values. Most of my contracts are 3-6 weeks out from expiration.
Share your thoughts!!

$SNOW Breakout on the HorizonSnowflake (A.I. data storage) NYSE:SNOW , has been trading in VERY tight range for over a month that is much smaller than its normal expected move, which is insane.
1. If it’s at a major support, than its breakout is to the upside (which I’m inclined to believe)
2. If there some crazy news about AI data storage, than it could break below the support.
I am more inclined to believe it’s the former. The point of control on the volume profile is $155-$160/share, so that’s where it is likely heading if it breaks out upward. NYSE:SNOW

$NKE Trade IdeaNYSE:NKE Trade Idea
Puts under $82.5
Target: $80.83, $79.97, $78.10, $76.82
Calls over $83.60
Target: $84.76, $85.40, $86, $87.83


$SMCI Trade IdeaNASDAQ:SMCI Trade Idea
Calls over $42.74
Target: $43.77, $44.64
Puts under $40
Target: $37.30, $34.76, $33.36

ACN Accenture plc Options Ahead of EarningsIf you haven`t bought ACN before the previous earnings:
Now analyzing the options chain and the chart patterns of ACN Accenture plc prior to the earnings report this week,
I would consider purchasing the 340usd strike price Calls with
an expiration date of 2024-11-15,
for a premium of approximately $11.55.
If these options prove to be profitable prior to the earnings release, I would sell at least half of them.

MKC McCormick & Company Options Ahead of EarningsAnalyzing the options chain and the chart patterns of MKC McCormick & Company prior to the earnings report this week,
I would consider purchasing the 85usd strike price Calls with
an expiration date of 2024-10-18,
for a premium of approximately $1.45.
If these options prove to be profitable prior to the earnings release, I would sell at least half of them.
