NIFTY INTRADAY LEVELS FOR 2ND JULY 2024BUY ABOVE - 24160
SL - 24100
TARGETS - 24280,24380,24480
SELL BELOW - 24010
SL - 24100
TARGETS - 23900,23800,23740
NO TRADE ZONE - 24010 to 24160
Previous Day High - 24160
Previous Day Low - 24010
Based on price action major support & resistance's are here, the red lines acts as resistances, the green lines acts as supports. If the price breaks the support/resistance, it will move to the next support/resistance line. White lines indicates previous day high & low, high acts as a resistance & low acts as a support for next day.
Trendlines are also significant to price action. If the price is above/below the trendlines, can expect an UP/DOWN with aggressive move.
Please NOTE: this levels are for intraday trading only.
Disclaimer - All information on this page is for educational purposes only,
we are not SEBI Registered, Please consult a SEBI registered financial advisor for your financial matters before investing And taking any decision. We are not responsible for any profit/loss you made.
Request your support and engagement by liking and commenting & follow to provide encouragement
HAPPY TRADING 👍
Optionstrading

BankNifty Finally Reversal?BankNifty, after a massive rally of 2400+ points on the CE Buying side, now looks ready for a nice short opportunities (PE Buying side).
I close my CE position today in a good profit and opened a PE buy position. Usually after such big moves, market becomes range-bound. And that, only next week can tell.
So, stay tuned, dont forget to enjoy your weekend.
Trust me, we deserve it.

Biocon Trade Idea Super bullish on Biocon as well. On daily timeframe, biocon is looking super bullish.
Hourly TF shows the stock is about to breakout.
For calls, entry above the 352.9 level.

Grasim Bullish Trade IDeaFor Grasim, I am still holding bullish conviction. Chart is showing good strength on the daily time frame. has been bouncing off this trendline.
Entering Long calls above PDH

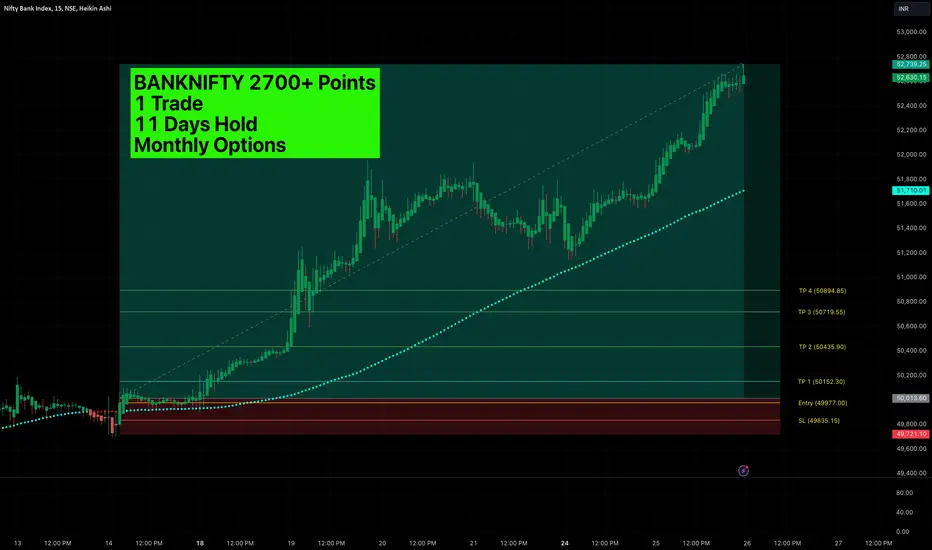
BankNifty Swing Update, 25 June 15 m time frameBANKNIFTY 2700+ Points complete and it is still not done!
Iam going to hold this position till the reversal happens - the price closes below the dotted trend line.
Calculation:
1 Trade
11 Days Hold
Monthly Options
2700+ running profit / per lot!
MASSIVE MASSIVE Trade!
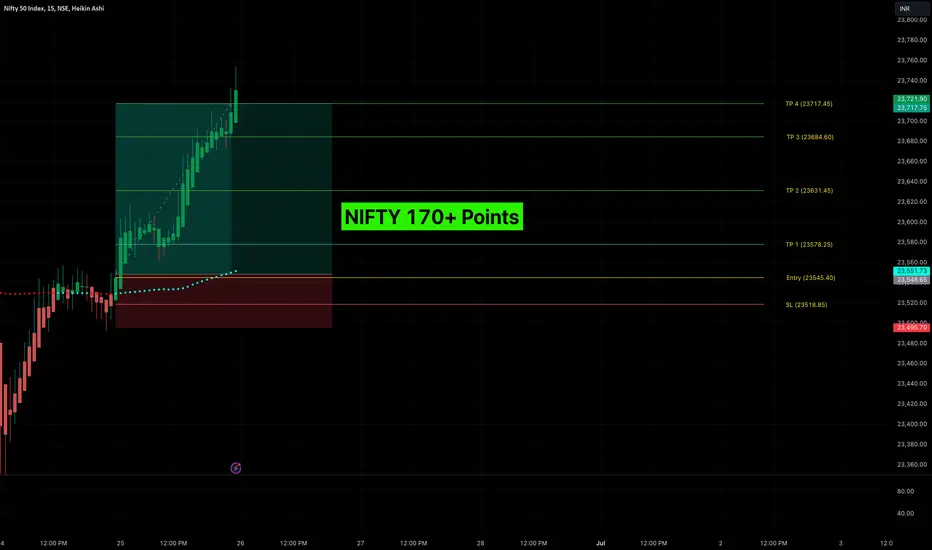
NIFTY Swing Update (+170 Points) 25 June, 15m TFNIFTY Swing Update, 25 June, 15m TF
I was in a long position since yesterday and NIFTY hit the 4th take profit target today with a comfortable 170+ points.
A good profitable trade.
BANKNIFTY 2600+ Points BALLE BALLE!!This is the best moment in my trading career.
Unbelievable how I ve been able to catch this amazing trade in BankNifty 15 min chart.
2600+ points and running!!!
3 Lots!
Thank you god!!

BANK NIFTY INTRADAY LEVELS FOR 25 JUNE 2024BUY ABOVE - 51740
SL - 51510
TARGETS - 51960,52200,52500
SELL BELOW - 51510
SL - 51740
TARGETS - 5151200,50950,50730
NO TRADE ZONE - 51510 to 51740
Previous Day High - 51740
Previous Day Low - 51200
Based on price action major support & resistance's are here, the red lines acts as resistances, the green lines acts as supports. If the price breaks the support/resistance, it will move to the next support/resistance line. White lines indicates previous day high & low, high acts as a resistance & low acts as a support for next day.
Trendlines are also significant to price action. If the price is above/below the trendlines, can expect an UP/DOWN with aggressive move.
Please NOTE: this levels are for intraday trading only.
Disclaimer - All information on this page is for educational purposes only,
we are not SEBI Registered, Please consult a SEBI registered financial advisor for your financial matters before investing And taking any decision. We are not responsible for any profit/loss you made.
Request your support and engagement by liking and commenting & follow to provide encouragement
HAPPY TRADING 👍

See you later ChevronNYSE:CVX
note the following directional arrows are concepts and how I want to enter
With firms rotating out of AMEX:XLE we can expect some of the sectors top holdings and laggers get downside potential. Looking more into this I found NYSE:CVX to be the best candidate. NYSE:CVX and other gas stocks seem to be the ones catching the momentum down. Chevron also is following the same structure as AMEX:XLE which if AMEX:XLE gets the drop Monday we can expect NYSE:CVX to follow.
Expected Range - Upside $158.78 Downside $151.82
Key Levels - $153.37 - $153.59, $155.05 - $155.30, $155.61 - $156.94
Rating - Rotation out of AMEX:XLE +5, Rising volume near pivot +1, formed a base (slowed down)/topping wicks after break of base +1, same weakness as AMEX:XLE +1
8/10 Bullish, 2/10 Bearish

WBA Walgreens Boots Alliance Options Ahead of EarningsIf you haven`t bought WBA before the previous earnings:
Now analyzing the options chain and the chart patterns of WBA Walgreens Boots Alliance prior to the earnings report this week,
I would consider purchasing the 17.50usd strike price Calls with
an expiration date of 2024-7-19,
for a premium of approximately $0.41.
If these options prove to be profitable prior to the earnings release, I would sell at least half of them.

BANK NIFTY INTRADAY LEVELS FOR 19/06/2024BUY ABOVE - 50550
SL - 50400
TARGETS - 50730,50950,51100
SELL BELOW - 50250
SL - 50400
TARGETS - 50100,49890,49670
NO TRADE ZONE - 50250 to 50550
Previous Day High - 50550
Previous Day Low - 49890
Based on price action major support & resistance's are here, the red lines acts as resistances, the green lines acts as supports. If the price breaks the support/resistance, it will move to the next support/resistance line. White lines indicates previous day high & low, high acts as a resistance & low acts as a support for next day.
Trendlines are also significant to price action. If the price is above/below the trendlines, can expect an UP/DOWN with aggressive move.
Please NOTE: this levels are for intraday trading only.
Disclaimer - All information on this page is for educational purposes only,
we are not SEBI Registered, Please consult a SEBI registered financial advisor for your financial matters before investing And taking any decision. We are not responsible for any profit/loss you made.
Request your support and engagement by liking and commenting & follow to provide encouragement
HAPPY TRADING 👍

Options Blueprint Series: Swap Strategies for High VolatilityIntroduction
CME Group Gold Futures have always been a cornerstone in the commodities market, offering investors and traders a way to hedge against economic uncertainties and inflation. With the current market environment exhibiting heightened volatility, traders are looking for strategies to capitalize on these fluctuations. One such strategy is the Straddle Swap, which is particularly effective in high volatility scenarios.
By utilizing the Straddle Swap strategy on Gold Futures, traders can potentially benefit from price swings driven by news events, economic data releases, and other market-moving occurrences.
Strategy Explanation
The Straddle Swap strategy is designed to capitalize on high volatility by leveraging options with different expirations. Here’s a detailed breakdown of how this strategy works:
Components of the Straddle Swap:
1. Buy one call option (longer expiration)
This long call option benefits from upward price movements in Gold Futures.
2. Sell one call option (shorter expiration)
This short call option generates premium income, which offsets the cost of the long call option. As it has a shorter expiration, it benefits from faster time decay.
3. Buy one put option (longer expiration)
This long put option benefits from downward price movements in Gold Futures.
4. Sell one put option (shorter expiration)
This short put option generates premium income, which offsets the cost of the long put option. It also benefits from faster time decay due to its shorter expiration.
Rationale for Different Expirations:
Longer Expirations: The options with more days to expiration provide a longer timeframe to capture significant price movements, whether upward or downward.
Shorter Expirations: The options with less days to expiration decay more quickly, providing premium income that reduces the overall cost of the strategy. This helps mitigate the effects of time decay on the longer-dated options.
Market Analysis Using TradingView Charts:
To effectively implement the Straddle Swap strategy, it’s crucial to analyze the current market conditions of Gold Futures using TradingView charts. This analysis will help identify optimal entry and exit points based on volatility and price trends.
The current price action of Gold Futures along with key volatility indicators. Recent data shows that the 1-month, 2-month, and 3-month Historical Volatilities have all been on the rise, confirming a high volatility scenario.
Application to Gold Futures
Let’s apply the Straddle Swap strategy to Gold Futures given the current market conditions.
Identifying Optimal Entry Points:
Call Options: Buy one call option with a 100-day expiration (Sep-25 2024) at a strike price of 2370 @ 64.5. Sell one call option with a 71-day expiration (Aug-27 2024) at the same strike price of 2370 @ 53.4.
Put Options: Buy one put option with a 100-day expiration (Sep-25 2024) at a strike price of 2350 @ 63.4. Sell one put option with a 71-day expiration (Aug-27 2024) at the same strike price of $2350 @ 52.5.
Target Prices:
Based on the relevant UFO support and resistance levels, set target prices for potential profit scenarios:
Upper side, target price: 2455.
For put options, target price: 2260.
Potential Profit and Loss Scenarios:
Scenario 1: Significant Upward Movement
If Gold Futures rise sharply above 2370 within 100 days, the long call option will generate a potentially substantial profit. The short call option will expire in 71 days, limiting potential losses.
Scenario 2: Significant Downward Movement
If Gold Futures fall sharply below 2350 within 100 days, the long put option will generate a potentially substantial profit. The short put option will expire in 71 days, limiting potential losses.
Scenario 3: Minimal Movement
If Gold Futures remain relatively stable, the premiums collected from the short options (71-day expiration) will offset some of the cost of the long options (100-day expiration), minimizing overall losses. Further options could be sold against the long 2350 call and long 2350 put once the shorter expiration options have expired.
Specific Action Plan:
1. Initiate the Straddle Swap Strategy:
Enter the positions as outlined above following your trading plan, ensuring to buy and sell the options at the desired strike prices and expirations.
2. Monitor Market Conditions:
Continuously monitor Gold Futures prices and volatility indicators.
Adjust or close the strategy if necessary based on significant market changes.
3. Manage Positions:
Use stop-loss orders to limit potential losses.
If the market moves favorably, consider exiting the positions at the target prices to lock in profits.
4. Reevaluate Periodically:
Periodically reevaluate the positions as the options approach their expiration dates.
Make any necessary adjustments to the strategy based on updated market conditions and volatility.
By following this type of trade plan, traders can effectively implement the Straddle Swap strategy, taking advantage of high volatility in Gold Futures while managing risk through careful monitoring and the use of stop-loss orders.
Risk Management
Effective risk management is crucial for success in options trading, particularly when employing strategies like the Straddle Swap. Here, we will discuss the importance of risk management, key techniques, and best practices to ensure that traders can mitigate potential losses and protect their capital.
Importance of Risk Management:
Minimizing Losses: Trading inherently involves risk. Effective risk management helps minimize potential losses, ensuring that a single adverse move does not significantly impact the trader’s overall portfolio.
Preserving Capital: By managing risk, traders can preserve their capital, allowing them to stay in the market longer and capitalize on future opportunities.
Enhancing Profitability: Proper risk management allows traders to optimize their strategies, potentially increasing profitability by avoiding unnecessary losses.
Key Risk Management Techniques:
1. Stop-Loss Orders:
Implementing stop-loss orders helps limit potential losses by automatically closing a position if the market moves against it.
For the Straddle Swap strategy, set stop-loss orders for the long call and put options to exit positions if prices reach predetermined levels where losses would exceed the desired trade risk set by the trader.
2. Hedging:
Use hedging techniques to protect positions from adverse market movements. This can involve purchasing protective options or futures contracts.
Hedging provides an additional layer of security, ensuring that losses in one position are offset by gains in another.
3. Avoiding Undefined Risk Exposure:
Ensure that all positions have defined risk parameters. Avoid strategies that can result in unlimited losses.
The Straddle Swap strategy inherently has limited risk due to the offsetting nature of the long and short options.
4. Precision in Entries and Exits:
Timing is crucial in options trading. Ensure precise entry and exit points to maximize potential gains and minimize losses.
Use technical analysis key price levels such as UFO support and resistance prices, and volatility indicators to identify optimal entry and exit points.
5. Regular Monitoring and Adjustment:
Continuously monitor market conditions and the performance of open positions.
Be prepared to adjust the strategy based on changing market dynamics, such as shifts in volatility or unexpected news events.
Additional Risk Management Practices:
Diversification: Spread risk across multiple positions and asset classes to reduce the impact of any single trade. Other liquid options markets could be WTI Crude Oil Futures; Agricultural products such as Wheat Futures, Corn Futures, or Soybean Futures; Index Futures such as the E-mini S&P 500 Futures; and even Bond and Treasury Futures such as the 10-Year Note or the 30-Year Bond Futures.
Position Sizing: Carefully determine the size of each position based on the trader’s overall portfolio and risk tolerance.
Education and Research: Stay informed about market conditions, economic indicators, and trading strategies to make well-informed decisions.
By incorporating these risk management techniques, traders can effectively navigate the complexities of options trading and protect their investments. Ensuring more precision with entries and exits, using stop-loss orders, and implementing hedging strategies are essential practices that contribute to long-term trading success.
When charting futures, the data provided could be delayed. Traders working with the ticker symbols discussed in this idea may prefer to use CME Group real-time data plan on TradingView: www.tradingview.com This consideration is particularly important for shorter-term traders, whereas it may be less critical for those focused on longer-term trading strategies.
General Disclaimer:
The trade ideas presented herein are solely for illustrative purposes forming a part of a case study intended to demonstrate key principles in risk management within the context of the specific market scenarios discussed. These ideas are not to be interpreted as investment recommendations or financial advice. They do not endorse or promote any specific trading strategies, financial products, or services. The information provided is based on data believed to be reliable; however, its accuracy or completeness cannot be guaranteed. Trading in financial markets involves risks, including the potential loss of principal. Each individual should conduct their own research and consult with professional financial advisors before making any investment decisions. The author or publisher of this content bears no responsibility for any actions taken based on the information provided or for any resultant financial or other losses.

RDDT Option trading arbitrageCurrent price 60.90$
Puts for 21st of June @60 cost 110@ per contract. 100 contracts=10K$ investment,
We can immodestly cover the position with 2000/2500 stocks @61 depending on the risk tolerance of the trader. My personal choice is not covering the whole position since I am expecting my main position which is the PUTS to gain 50K by the end of the week and in case I am wrong I prefer to cover only 7K from the initial 10k investment.
So basically we need more than 10K capital to make this position but the risk of actually losing money is max 2-3K lose with a potential gain of 50thousand and the chance of the position being a winner is 63% which for such an RIsk-Reward is an amazing opportunity.

BIG MOVE! SHORTS TRAPPED! What's next?Based on the chart analysis, the rising wedge pattern signals a likely bearish correction in the short term, with the price potentially testing the 0.618 Fibonacci retracement level around $518.36 as a key support. However, the Elliott Wave projection suggests a bullish reversal toward point (C) if support holds, indicating a medium-term upward move. Traders should watch for confirmation of support at the 0.618 level and look for signs of reversal to enter long positions, targeting the previous high around $532.99 and beyond. We must stay above $524.71 to escape this wedge channel and maintain the potential for an upward breakout. Maintain vigilance for a break below the 0.618 retracement, which could signal further downside risk.
Leave a comment of what you think about where the market is heading!

Options Blueprint Series: Cost Efficient Skip Strike ButterflyUnderstanding Skip Strike Butterfly
The Skip Strike Butterfly strategy is a unique and cost-effective options trading strategy that builds upon the traditional butterfly spread. This strategy involves buying and selling options at different strike prices to create a position with limited risk and potential for profit. Unlike the traditional butterfly spread, the Skip Strike Butterfly "skips" a strike price, which reduces the overall cost of the trade while maintaining a similar payoff profile.
Benefits:
Cost Efficiency: Lower upfront cost compared to traditional butterfly spreads.
Limited Risk: The maximum risk is limited to the net premium paid for the strategy.
Profit Potential: Potential for significant returns if the underlying asset moves within the expected range.
Understanding the mechanics of the Skip Strike Butterfly strategy can provide traders with a versatile tool for navigating market conditions when trading Corn Futures. This strategy allows traders to participate in market movements with a well-defined risk and reward profile, making it an attractive option for those looking to optimize their trading costs.
Strategy Setup
Setting up the Skip Strike Butterfly strategy for Corn Futures involves selecting the appropriate strike prices and expiration dates. Here, we detail the steps to configure this strategy effectively.
Steps to Set Up the Skip Strike Butterfly:
1. Select the Expiration Date:
Choose an expiration date that aligns with your market outlook and trading plan. Ensure you select an expiration that provides enough time for the expected price movement to occur.
2. Determine the Strike Prices:
Identify the current price of Corn Futures.
Typically, use calls for bullish setups and puts for bearish setups.
Buy one in-the-money (ITM) option.
Sell two at-the-money (OTM) options using a strike located near to where the trade target price is.
Skip one or multiple strikes and buy one further out-of-the-money (OTM) option.
3. Calculate the Cost:
Calculate the net premium paid for the strategy by considering the premiums of each option involved. The net cost is generally lower due to the skipped strike price.
4. Establish the Payoff Structure:
The maximum profit is realized if the price of Corn Futures closes at the middle strike at expiration.
The maximum loss is limited to the net premium paid for the strategy.
Application to Corn Futures
Analyzing the current market conditions for Corn Futures is crucial before implementing the Skip Strike Butterfly strategy. Let's examine the market and set up a trade based on recent data and trends.
Market Analysis:
Current Price: Corn Futures are trading at 456'6 per contract.
Market Trend: The market has shown moderate volatility with a tendency to hover around the 450 level.
Technicals: Recently, buy UnFilled Orders (UFOs) have formed around the 450 level, indicating strong buying interest and potential support at this price. On the other hand, sell UFOs are positioned much higher, around the 490 level, suggesting limited selling pressure in the immediate range and opening the door for a directional move with a potentially strong reward-to-risk ratio.
Setting Up the Trade:
Based on our analysis, we will implement the Skip Strike Butterfly strategy as follows:
Current Price of Corn Futures: 456'6
Expiration Date: 74 days from today.
Strike Prices and Premiums:
Buy 1 ITM Call: Strike Price 450, Premium 27.25
Sell 2 ATM Calls: Strike Price 480, Premium 16 each
Buy 1 OTM Call: Strike Price 540, Premium 6
Net Premium Paid: 27.25 (buy) - 32 (sell) + 6 (buy) = 1.25 points = $62.5 (Point Value is $50/point)
Source: Options chain available at www.tradingview.com
Trade Execution:
Entry Price: The trade is entered at 1.25 points, making it highly cost-efficient.
Target Price: The optimal scenario is for Corn Futures to close at 480 at expiration, where the maximum profit is realized.
Break-Even Points: Calculate the break-even points to ensure clarity on potential losses or gains. For this setup, the break-even points are 451.25 and 508.75.
Risk: In the worst-case scenario, this trade could incur a loss of 31.25 points if Corn Futures surpasses the upper break-even point. Conversely, a minor loss of 1.25 points would occur if Corn Futures falls below the lower break-even point.
Source: Risk profile graph available at www.tradingview.com
Risk Management
Risk management is a critical aspect of any trading strategy, and it is especially important when trading options like the Skip Strike Butterfly. Effective risk management helps protect against unexpected market movements and ensures that losses are minimized while maximizing potential gains.
Importance of Risk Management:
Limit Losses: By setting clear stop-loss levels, traders can limit the amount of capital at risk and prevent large losses.
Preserve Capital: Protecting trading capital is essential for long-term success. Effective risk management allows traders to stay in the game even after a series of losing trades.
Emotional Control: Having a risk management plan helps traders stick to their strategy and avoid emotional decisions driven by market volatility.
Maximize Gains: Proper risk management enables traders to capitalize on profitable opportunities while keeping losses in check.
Techniques for Managing Risk with Skip Strike Butterfly:
1. Stop-Loss Orders:
Set stop-loss orders at predetermined price levels to automatically exit the trade if the market moves against you.
2. Position Sizing:
Only allocate a small percentage of your trading capital to any single trade. This helps to mitigate the impact of any one trade on your overall portfolio.
3. Diversification:
Diversify your trading strategies and instruments to spread risk across different markets and reduce the impact of adverse movements in any one asset.
4. Hedging:
Use other options strategies to hedge your positions. For example, buying protective puts can limit downside risk if the market moves significantly against your position.
5. Regular Monitoring:
Continuously monitor the market and your positions. Be prepared to adjust your strategy or exit the trade if market conditions change.
Conclusion
The Skip Strike Butterfly strategy offers a cost-efficient and flexible approach for trading Corn Futures. By strategically setting up options at different strike prices while skipping an intermediate strike, traders can reduce the cost of the trade while maintaining a similar payoff structure to a traditional butterfly spread. This strategy is particularly useful in markets exhibiting limited price movements, making it ideal for the current conditions in Corn Futures.
Key Takeaways:
Cost Efficiency: The Skip Strike Butterfly reduces the upfront cost of entering a trade, providing a significant advantage over traditional butterfly spreads.
Limited Risk: With a well-defined risk profile, this strategy ensures that losses are capped at the net premium paid.
Profit Potential: Although the maximum profit is achieved if the underlying asset closes at the middle strike price, the strategy still offers substantial profit opportunities within a specific price range.
Risk Management: Implementing robust risk management techniques is essential for success. Utilizing stop-loss orders, managing position sizes, diversifying strategies, and regular market monitoring can help protect trading capital and maximize gains.
When trading options and employing strategies like the Skip Strike Butterfly, it is crucial to stay disciplined and adhere to your trading plan. Always ensure that your risk management measures are in place to navigate market uncertainties effectively.
When charting futures, the data provided could be delayed. Traders working with the ticker symbols discussed in this idea may prefer to use CME Group real-time data plan on TradingView: www.tradingview.com This consideration is particularly important for shorter-term traders, whereas it may be less critical for those focused on longer-term trading strategies.
General Disclaimer:
The trade ideas presented herein are solely for illustrative purposes forming a part of a case study intended to demonstrate key principles in risk management within the context of the specific market scenarios discussed. These ideas are not to be interpreted as investment recommendations or financial advice. They do not endorse or promote any specific trading strategies, financial products, or services. The information provided is based on data believed to be reliable; however, its accuracy or completeness cannot be guaranteed. Trading in financial markets involves risks, including the potential loss of principal. Each individual should conduct their own research and consult with professional financial advisors before making any investment decisions. The author or publisher of this content bears no responsibility for any actions taken based on the information provided or for any resultant financial or other losses.

#Heromoto 4th time tested 4950, above 4955 fatega kya?Heromoto since Feb'24 4th time has tested the fib resistance of 4954.A day close above 4954 can take this stock towards 1) 510 2)5177 3)5329 4)5473, below 4632 will be exit for me. Since my indicator is also not giving any negative signs, I have high hopes from this setup. Only thing is weakness in overall market can affect it. Lets see

Utilities SurgeRead the chart for the lesson. This is very valuable and is not just used for the macro

$TSLA 190c 06/07 above 180NASDAQ:TSLA
IHNS
Bounced off the Plat zone(.88-.786) on the Daily
Bounced on Silver zone (.5-.382)
At a Volume Shelf
Retracement Targets are 184.70; 198.88; 213.06
Extension Targets are 197.79; 204.87
Volume Shelf Targets 192.5; 195; 200.55
2hr Time Frame

Options Blueprint Series: Secure Interest Rates with Box SpreadsIntroduction
The E-mini S&P 500 Futures is a popular and widely traded derivative product. These futures are used by traders and investors to hedge their portfolios, gain market exposure, and manage risk.
The Options Box Strategy is an advanced options trading technique that involves creating a synthetic long position and a synthetic short position simultaneously. This strategy is designed to lock in interest rates and profit from price discrepancies, essentially securing a risk-free return through arbitrage. By using Box Spreads, traders can secure interest rates and achieve a potential arbitrage opportunity in a controlled and predictable manner.
An interesting application of the Box Spread strategy is using unutilized capital in a trading account. Traders can earn a risk-free return on idle cash by deploying it in Box Spreads. This approach maximizes the utility of available capital, providing an additional revenue stream without increasing market risk exposure, thus enhancing overall portfolio performance.
E-mini S&P 500 Futures Contract Specifications:
Contract Size: $50 times the S&P 500 Index
Minimum Tick Size: 0.25 index points, equal to $12.50 per contract
Trading Hours: Nearly 24 hours a day, five days a week
Margin Requirement: $11,800 at the time of publishing this article
Micro E-minis: 10 times smaller than the E-minis
Understanding Box Spreads
A Box Spread is a sophisticated options strategy that involves simultaneously entering a long call and short put at one strike price and a long put and short call at another strike price.
Components of a Box Spread:
Long Call: Buying a call option at a specific strike price.
Short Put: Selling a put option at the same strike price as the long call.
Long Put: Buying a put option at a different strike price.
Short Call: Selling a call option at the same strike price as the long put.
How Box Spreads Secure Interest Rates: Box Spreads are designed to exploit mispricings between the synthetic long and short positions. By locking in these positions, traders can secure interest rates as the net result of the Box Spread should theoretically yield a risk-free return. This strategy is particularly useful in stable market conditions where interest rate fluctuations can impact the profitability of other trading strategies.
Advantages of Using Box Spreads:
Arbitrage Opportunities: Box Spreads allow traders to capitalize on discrepancies in the pricing of options, securing a risk-free profit.
Predictable Returns: The strategy locks in a fixed rate of return, providing certainty and stability.
Risk Management: By simultaneously holding synthetic long and short positions, the risk is minimized, making it an effective strategy for conservative traders.
Applying Box Spreads on E-mini S&P 500 Futures
To apply the Box Spread strategy on E-mini S&P 500 Futures, follow the following step-by-step approach.
Step-by-Step:
1. Identify Strike Prices:
Choose two strike prices for the options. For instance, select a lower strike price (LK) and a higher strike price (HK).
2. Enter Long Call and Short Put:
Buy a call option at the lower strike price (K1).
Sell a put option at the same lower strike price (K1).
3. Enter Long Put and Short Call:
Buy a put option at the higher strike price (K2).
Sell a call option at the same higher strike price (K2).
Potential Outcomes and Rate Security: The Box Spread locks in a risk-free return by exploiting price discrepancies. The profit is determined by the difference between the strike prices minus the net premium paid. In stable market conditions, this strategy provides a predictable and secure return, effectively locking in interest rates.
Advantages of Applying Box Spreads:
Risk-Free Arbitrage: The primary benefit is securing a risk-free profit through arbitrage.
Predictable Returns: Provides a fixed return, beneficial for conservative traders.
Minimal Risk: By holding both synthetic long and short positions, market risk is mitigated.
Considerations:
Ensure precise execution to avoid slippage and maximize the arbitrage opportunity.
Account for transaction costs, as they can impact the overall profitability.
Monitor market conditions to ensure the strategy remains effective.
Example Trade Setup:
Let's consider a practical example of setting up a Box Spread on the E-mini S&P 500 Futures while its current trading price is 5,531. We'll use the following strike prices:
Lower Strike Price (K1): 5450
Higher Strike Price (K2): 5650
Transactions:
Sell Call at 5650: Premium = 240.01
Buy Put at 5650: Premium = 352.85
Sell Put at 5450: Premium = 270.59
Buy Call at 5450: Premium = 347.39
Note: We are using the CME Group Options Calculator in order to generate fair value prices and Greeks for any options on futures contracts.
Net Premium Calculation:
Net premium paid = 347.39 - 240.01 + 352.85 - 270.59 = 189.64
Potential Profit Calculation:
Profit = (Higher Strike Price - Lower Strike Price) - Net Premium Paid
Profit = 5650 – 5450 – 189.64 = 10.36 points = $518 ($50 per point)
Rate Of Return (ROR) Calculation:
Margin Requirement = (Higher Strike Price - Lower Strike Price) × Contract Multiplier = 200 x 50 = $10,000
ROR = 518 / 10000 = 5.18%
Annualized ROR = 518 / 10000 x 365.25 / 383 = 4.94% (based on the screenshots, expiration will take place in 383.03 days while a year is made of 365.25 days)
Interesting Application: Utilizing Box Spreads with Unutilized Capital
An intriguing application of the Box Spread strategy is the use of unutilized capital in a trading account. Traders often have idle cash in their accounts that isn't actively engaged in trading. By deploying this capital in Box Spreads, traders can earn a risk-free return on otherwise dormant funds. This approach not only maximizes the utility of available capital but also provides an additional revenue stream without increasing market risk exposure. Utilizing Box Spreads in this manner can enhance overall portfolio performance, making efficient use of all available resources.
Importance of Risk Management
Risk management is a critical aspect of any trading strategy, including the implementation of Box Spreads on E-mini S&P 500 Futures. Effective risk management ensures that traders can mitigate potential losses and protect their capital, leading to more consistent and sustainable trading performance.
Conclusion
Implementing the Options Box Strategy on E-mini S&P 500 Futures may allow traders to secure interest rates and potentially achieve risk-free arbitrage opportunities. By understanding the mechanics of Box Spreads and applying them effectively, traders can capitalize on price discrepancies in the options market to lock in predictable returns.
Key points to remember include:
E-mini S&P 500 Futures offer accessible and efficient trading opportunities for both hedging and speculative purposes.
Box Spreads combine synthetic long and short positions, providing a powerful tool for securing interest rates through arbitrage.
By following the outlined steps and leveraging classical technical indicators, traders can enhance their ability to set up and analyze Box Spreads, making the most of this advanced options strategy.
Utilizing Box Spreads on E-mini S&P 500 Futures not only can secure interest rates but can also provide a structured and disciplined approach to trading, leading to more consistent and sustainable trading performance.
When charting futures, the data provided could be delayed. Traders working with the ticker symbols discussed in this idea may prefer to use CME Group real-time data plan on TradingView: www.tradingview.com This consideration is particularly important for shorter-term traders, whereas it may be less critical for those focused on longer-term trading strategies.
General Disclaimer:
The trade ideas presented herein are solely for illustrative purposes forming a part of a case study intended to demonstrate key principles in risk management within the context of the specific market scenarios discussed. These ideas are not to be interpreted as investment recommendations or financial advice. They do not endorse or promote any specific trading strategies, financial products, or services. The information provided is based on data believed to be reliable; however, its accuracy or completeness cannot be guaranteed. Trading in financial markets involves risks, including the potential loss of principal. Each individual should conduct their own research and consult with professional financial advisors before making any investment decisions. The author or publisher of this content bears no responsibility for any actions taken based on the information provided or for any resultant financial or other losses.

SPY WEEKLY 3rd June 2024Welcome to SPY Weekly. I have discussed the levels where to go long. If you have any doubts or questions please feel free to DM here on X.
NOTE: DO NOT BUY CALLS

New Product Launch: How to Use TradingView OptionsWe’ve rolled out our newest product and we’re eager to brag about it! It’s an options platform — TradingView Options. More precisely, it’s a powerful set of tools for options traders who want to keep a close eye on every little detail and fine-tune their strategy to perfection.
What Are Options?
Options are financial derivatives that give the buyer the right, but not the obligation, to buy or sell the underlying asset at a set price within a set period.
TradingView Options
TradingView Options is designed to illuminate your options trading strategy from the first step to the last one. Get razor-sharp options strategies on gold futures ( COMEX-GC1! ), oil futures ( NYMEX-CL1! ), and many more.
Let’s break it down and discuss what it's about. For starters, you’ve got three key components — Strategy Builder, Options Chain, and Volatility Analysis.
1. Strategy Builder
Create, test and visualize options strategies with real-time data.
Use pre-built strategies filtered by bullish, bearish, or neutral outlooks.
Customize strategies with adjustable parameters like expiration dates and strike prices.
Get estimates for max profit, max loss, win rate, and more.
Compare multiple strategies on a single chart for performance analysis.
2. Options Chain
Options chains are broken down into two sections — calls and puts.
Strike price is displayed in the center column — it’s where the put or call can be exercised.
Next to Strike is IV, %, which stands for Implied Volatility in percentages.
Measure options risk with the Greeks: Delta, Gamma, Theta, Vega, and Rho.
Easily switch underlying assets with a simple symbol search at the top left.
3. Volatility
Analyze market volatility to understand potential price movements and risks.
Market Coverage
Currently, TradingView Options supports options contracts from major exchanges including CME and its subsidiaries NYMEX, COMEX, and CBOT, alongside NSE , and BSE .
Conclusion
The new options trading tools by TradingView empower traders with the data and analytical capabilities needed to whip up high-probability strategies and explore new opportunities for profit in global markets.
Are you an options trader? What’s your trading style? Let us know in the comments!

NIFTY 320+ Points Gain - SHORT PositionLoving the momentum in the market these days.
Only if you know how to catch the big moves.
I believe bigger moves are coming from Monday onwards.
Within NIFTY and BankNifty, I feel BankNifty trades will make the bigger money.
Are you prepared? Whats your strategy for the recent volatility? Share your thoughts.

Structure Lesson This is a mini analysis of AMEX:XLK structure. I point out structure, momentum, liquidations, and what to look for when entering longs/reversals. Follow along with the notes on the chart and back test!
