[𝟬𝟱/𝟭𝟮] 𝗪𝗲𝗲𝗸𝗹𝘆 𝗦𝗣𝗫 𝗚𝗘𝗫 𝗣𝗹𝗮𝘆𝗯𝗼𝗼𝗸🔍 IF/THEN QUICK GAMMA PLAYBOOK
IF > 5825 THEN path to 5900 → stall/profit-taking likely
IF > 5900 THEN path to first 5950, then 6000 → gamma squeeze extension zone
IF < 5825 THEN path to 5700 → test of transition zone support
Chop Zone: — re-entry = short-term balance/testing zone
IF < 5700 THEN path to 5500 → gamma flush / dealer unwind risk
🧭 𝗘𝗫𝗧𝗘𝗡𝗗𝗘𝗗 𝗭𝗢𝗡𝗘 𝗠𝗔𝗣/b]
✅ Gamma Flip Level
5700 → This is the confirmed Gamma Flip level = High Volatility Zone = HVL. We are comfortably above it, confirming positive gamma environment.
🧱 Major Call Walls / Resistance to upside from here
5900 → Significant call resistance zone (highlighted across GEX, profile, and /matrix command). 5825–5900 = Current rally zone → expected stall at 5900 (Profit-taking zone)5950 → Next mid-large positive gamma wall to the upside, mid-station between mounts. Dealers short gamma, adding fuel to breakout.6000 → Positive Gamma squeeze continuation target. Gamma squeeze intensifies → likely extends to 6000.🟦 Transition / Chop Zone
5700–5825 → Previous chop range. Retrace could test this before renewed upside.Currently outside and breaking up from this zone, indicating trend initiation.
Balance zone from prior structure.
Expect fade setups if price dips back in.
Needs catalyst or strong sell flow to re-enter meaningfully.
🛡️ Major Put Supports to the downside
5700 → = HVL, also aligned with pTrans and Put support.Dealer unwind risk, downside opens.5500 → Key level if the 5700 zone fails — “total denial zone” of current FOMO.
-----------------------------
This week’s SPX setup remains decisively bullish from a gamma perspective. The GEX profile shows strong positive gamma, with institutional and dealer hedging flows firmly positioned to support continued upside—especially into Friday’s OPEX. The environment is ideal for a controlled melt-up: volatility is softening, implied volatility is trending lower, and there’s no sign of panic in the options market.
Put pricing skew is also declining, which suggests reduced fear and a shift toward more aggressive call buying—another sign of bullish sentiment. Dealer positioning implies that any upward momentum is likely to be chased and hedged into, reinforcing the trend.
However, traders should stay alert: if SPX slips back below 5825, we may see a pause or retracement back into the 5700–5825 transition zone. Only a decisive break below 5700 would flip the gamma regime back to negative and open the door to real downside volatility.
Optionstrading

A 12/19 call option I have executed on $XYZNYSE:XYZ __NFA__ this will be fundamentally fueled by an upside move in bitcoin and US markets. They have $7.77B in cash. Jack Dorsey is doing it right in the bitcoin space.

$TTD Breakout After Earnings | Gapped Up w/ Volume Surge📊 Summary for TradingView Post:
NASDAQ:TTD exploded +11% post-earnings, gapping above key resistance and closing strong with massive volume.
Price cleared multiple supply zones with conviction, now sitting above $79 with eyes on $82.74 and $86.43.
Buyers showed up heavy. This is no random push—structure confirms strength.
Still bullish unless it fills the gap below. Watching for continuation or controlled retest.

05/05 SPX Weekly Playbook - GEX Zone Outlook🔮 What-If Scenarios for This Week – Based on GEX Structure until Firday
Last week’s market momentum pushed the S&P 500 up by almost 3%, effectively erasing the price gap left behind on Liberation Day. The index also strung together nine straight days of gains—something we haven’t seen since late 2004.
Meanwhile, implied volatility dropped significantly, with the VIX touching its lowest level since the holiday, falling to around 22.5.
Several factors seem to have fueled this bullish tone, including a more measured approach from Trump on trade policies and strong quarterly results from major tech names like Microsoft and Meta.
Still, the nature of the buying raises questions—was this a thoughtful rotation, or just a broad sweep of optimism?
~~~~~~~~~~~~~~~~~~~~~~~~~~~~~~~~~~~~~~~~~~
🔄 Chop Zone: 5650 – 5670 (wide transition zone)
🔹 Gamma Flip: 5615
🔺 Key Call Wall: 5725 (5800 potential shift)
🔻 Key Put Wall: 5500 (5400 major support below)
🔼 Upside Path
IF > 5670 → transition cleared →
➡️ 5700 stall / reaction
IF > 5725 → call wall breached →
➡️ Path to 5750 / 5775 → stall at 5800 (largest net call OI)
IF > 5800 → gamma resistance breaks down →
➡️ 5825/5850 zone opens up
🔽 Downside Path
IF < 5615 → gamma flip triggered →
➡️ 5500 = battle zone (massive put wall + high negative GEX)
IF < 5500 → negative gamma squeeze likely →
➡️ Stall zone: 5450 → flush to 5400
IF < 5400 → high-volatility regime →
➡️ Possible acceleration to 5375 / 5340 depending on IV spike
⚖️ Neutral Setup
IF 5650–5670 holds → dealer hedging = balanced →
➡️ Ideal for non-directional spreads / theta plays
➡️ Wait for breakout confirmation above 5670 or below 5615
~~~~~~~~~~~~~~~~~~~~~~~~~~~~~~~~~~~~~~~~
🔍 Final Thoughts
We’ve seen a sharp rally since the Trump trade war scare, with barely any meaningful pullback. The market appears to be looking for one—as a breath. Based on current GEX positioning, there’s significantly more downside hedging than upside, especially in the mid-term May expirations.
That doesn’t necessarily mean we crash—but it does mean that moves lower can accelerate faster, while upward breakouts may require more energy or time. In this environment, consider:
Bearish or neutral spreads (put debit spreads, call credit spreads)
Volatility-based strategies
Avoiding naked upside trades unless we see a strong reclaim of 5725+
Stay safe and adapt—GEX doesn’t tell direction, but it does tell where the fire might start, beacuse of reflexting to hedging activity.

COFORGE 8100 CE – 29 MAY EXPIntraday to Short-Term Trade Setup (15min/1H)
🟢 Bullish Breakout | Volume Surge Confirmed
🛒 Entry Zone (Buy Above): ₹258–260
🔑 Confirmation on 15min candle close above ₹260 with volume
🎯 Targets:
T1: ₹276
T2: ₹306.50
T3: ₹353.90 (if momentum continues into next session)
🛑 Stop Loss:
SL: ₹230 (on candle close basis for 15min TF)
Conservative SL: ₹240 (if tighter risk appetite)
📊 Indicators Signal:
✅ 9 EMA crossed 26 EMA (momentum confirmation)
✅ RSI at 76.79 – strong, but watch for pullback
✅ BB %B at 0.89 – breakout zone
✅ Clean breakout above resistance (~₹230) with volume spike
✅ Pivot & resistance flip visible on both 15min & 1H TF
For Education Purposes Only

SPY WEEKLY 12 MAY 2025Welcome to Spy weekly. I have tried my best to explain the price action here. If you have any doubts, feel free to leave a comment or DM me.
NOTESTAY AWAY FROM OPTIONS

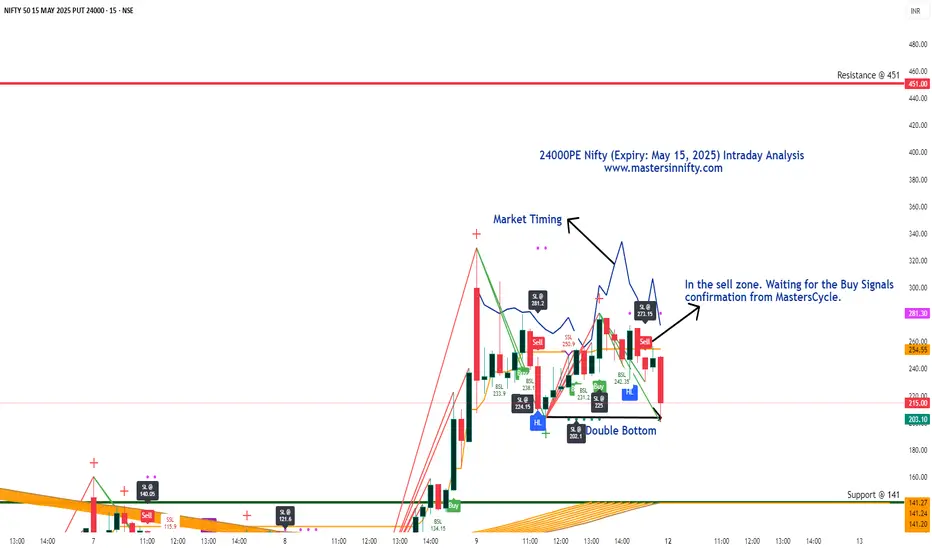
24000PE Nifty Intraday Analysis for May 12, 202524000PE Outlook:
The 24000PE is currently in the sell zone. As I maintain a bearish view on Nifty for tomorrow, I will wait for a buy confirmation on the 24000PE before considering any entry.
Based on my analysis (excluding gap considerations), I estimate the support zone around 141 and resistance near 451. However, please note that these zones may shift if price action begins to factor in gap areas on either side.
Disclaimer: This is my personal view and not a trading recommendation. All traders are advised to conduct their own technical analysis and trade with strict stop-loss and risk management.
BTCUSD Technical Analysis – Is a Pullback Coming Soon?BITSTAMP:BTCUSD is currently trading within a clearly defined ascending channel, with price action now testing the upper boundary. This level may act as a dynamic resistance, and rejection here could trigger a corrective move towards the $98,000 support zone.
If buyers defend this support level, the bullish structure remains intact, with potential to move back toward higher levels. However, if price breaks below this zone, there will be little to stop it from falling further.
Monitoring candlestick patterns and volume at this key area is essential to identify potential buying opportunities. Risk should be managed properly—always confirm your setups and trade with solid risk management.
If you have any thoughts on this setup or additional insights, feel free to share them in the comments!

SPY (S&P500 ETF) - Testing Key Resistance Levels - Weekly ChartSPY (S&P500 ETF) is currently attempting an uptrend rally, bouncing up from the April 7th 2025 support level ($488) and weekly support trendline.
The current resistance price level is $569 above, and the support price level below is $555.
SPY price needs to remain and close above $522 in May 2025 to maintain the current uptrend rally.
Resistance price targets above: $569, $578, $600, $610.
Support price targets below: $555, $542, $533, $512.
Tariff and trade deal news, corporate earnings, government law changes, and consumer sentiment will continue to affect the stock price action of SPY.
Support price levels need to hold for an uptrend to continue in 2025.

Tag ‘n Turn → Bear Mode EngagedV-Shape Reversal Confirms Short Bias
You ever see a setup pull a fakeout, tease a breakout, then pivot perfectly back into your system?
That was yesterday.
The Tag ‘n Turn gave us another clean swing exit off the upper Bollinger Band, and while I was ready to defer the next entry, a tidy little V-shaped reversal handed us the confirmation we needed. We’re back bearish. Levels are set. Now we let the market do its thing.
---
SPX Market View
Let’s unpack the sequence.
Price ran up into the upper Bollinger Band and triggered the final legs of our overnight swings. That was the cash-out point – system clean, profits booked.
But I wasn’t diving into the next setup just yet.
Why?
Because it looked like the start of a Bollinger breakout – the kind that breaks the pinch and rips higher. So I paused. Waited.
Then came the V-shaped reversal – clear as day within 2 hours.
Entry happened late in the day, around the same level the mechanical Tag ‘n Turn would have fired. No edge lost. Just added confirmation.
Now? The system is officially bearish again, with a firm rejection at highs and a sharp drive lower that flipped the tone of the day and the bias on the chart.
Today’s key levels:
5620 = GEX flip zone
Also where we bounced up post-FOMC
5680 = resistance zone – could mark today’s top
We’re back in the pre-FOMC chop zone.
The plan:
Bearish until price tells us otherwise
Hedge levels marked
No chase
Wait for price to hit our zone
Let the system print
Expert Insights:
Jumping the gun on reversals – wait for structure, not assumptions.
Chasing breakouts too early – pinch points often fake before they break.
Skipping levels – 5620 and 5680 matter. Mark them or risk regret.
Overmanaging overnight trades – exits were planned. Trust the system.
Forcing direction changes – confirmation > prediction. The system knows.
Satirical cartoon showing confirmation over prediction.
Rumour Has It…
Word is the SPX reversal was caused by a rogue intern at the Fed who mistook the breakout chart for a bowl of ramen and tried to stir it with a mouse. After rebooting TradingView, they accidentally submitted a bearish policy note to Bloomberg. The market reversed out of pure confusion.
This is entirely made-up satire. Probably!
Breaking scoops courtesy of the Financial Nuts Newswire-because who needs sanity?
---
Fun Fact
The term “V-shaped reversal” originated in early floor trading days when chalkboard analysts would literally sketch a V on the board as a real-time note to floor brokers. That visual shorthand became one of the most recognized intraday patterns in trading – a pattern that still works in a world of tickers, bots, and zero-DTE.

BANKNIFTY 52700 PE (29 May 2025 Expiry) – Intraday Options Type: Intraday | Put Option (PE)
Strike: 52700
CMP: ₹635.00Recommended Buy Range: ₹626.00 – ₹631.00
Target Achieved: ₹730.00 ✅
Stop Loss: ₹570.00
Profit Booked: ₹94.35 / +18.45% 🟢
⏱️ Timeframes: 15min & 1H
This was a quick momentum scalp based on:
🔻 Weakness in BankNifty index with rejection near key resistances
📉 Bearish candles on 15min + volume confirmation
🔄 Entry near VWAP zone, breakout of structure support
For Education Purposes Only

WULF TeraWulf Options Ahead of EarningsIf you haven`t bought WULF before the rally:
Now analyzing the options chain and the chart patterns of WULF TeraWulf prior to the earnings report this week,
I would consider purchasing the 2usd strike price Puts with
an expiration date of 2026-1-16,
for a premium of approximately $0.43.
If these options prove to be profitable prior to the earnings release, I would sell at least half of them.

04/28 Weekly GEX AnalysisDETAILED IMAGE:
Here’s what the charts and indicators are showing right now until Friday.
We are approaching a key breakout zone.
🐂 🟢 IF the market breaks above the white bearish daily trendline, the next bullish target could be between 5515–5680.
🟦 ⚖️ The chop area is between 5435–5515.
Expect more back-and-forth moves here if the breakout fails.
🐻🔴 Watch out: if the price drops below 5435 or 5425, there’s little support left.
This could trigger a sharp sell-off ("Bearish Armageddon" scenario).
GEX profiles remain positive 🟢 across all near expirations — for now — suggesting that underlying support still exists, but we need to monitor any changes closely.
IVRank is still relatively high (30.9), meaning options are priced with a decent amount of implied volatility.
🟢Short-term sentiment is currently bullish, with some speculative activity picking up.
This suggests that traders are expecting less volatility over the next month compared to what we saw in the past week.
However, if we look at institutional positions focused on longer-term expirations (especially beyond 30 days on SPX/AM maturities), the picture remains bearish 🔴 or at least highly volatile.
These players are still strongly hedging against downside risks.
This confirms the broader point:
Even though price action managed to recover to pre-tariff-announcement levels — with very low trading volume — we’re not out of the woods yet.
Until we can break and hold above the key resistance bearish trend with HIGH BUY VOLUME (aka. momentum), we shouldn't expect a strong, stable GEX profile across all expirations like we had in the past.

Can Uber pool its way to a new all-time high?Unbelievable strength the past two weeks. Once we see some strength above 75.4, it should pick up a little bit of momentum. Long bias. Not financial advice.

AMZN Amazon Options Ahead of EarningsIf you haven`t bought AMZN before the previous rally:
Now analyzing the options chain and the chart patterns of AMZN Amazon prior to the earnings report this week,
I would consider purchasing the 210usd strike price Calls with
an expiration date of 2025-6-20,
for a premium of approximately $3.75.
If these options prove to be profitable prior to the earnings release, I would sell at least half of them.
Disclosure: I am part of Trade Nation's Influencer program and receive a monthly fee for using their TradingView charts in my analysis.

XAUUSD Downtrend Continues- Is 3,175 the Next Stop?OANDA:XAUUSD is currently trading within a well-defined descending channel, with price action consistently forming lower highs and lower lows. This structure reflects sustained bearish momentum, and sellers continue to dominate the overall direction.
The recent upward move appears to be a technical rebound, with price approaching a potential resistance zone near the upper boundary of the channel. This area may now serve as a supply zone after acting as previous support, making it an important region for potential rejection.
If the resistance holds, a rejection here could lead to the continuation of the bearish trend, with a potential move targeting the support area around 3,175, aligning with the lower boundary of the descending channel.
However, failure to hold below this level could invalidate the bearish scenario and increase the likelihood of a retest toward the upper boundary of the channel.
Traders should monitor for clear rejection signals at resistance, such as bearish engulfing candles or strong rejection wicks, or alternatively, wait for breakout confirmation before considering a trend shift. As always, proper risk management remains essential.

$XYZ pullback would be a gift for longsNYSE:XYZ back in bull trend here since tapping the 50 psych level. The 100WMA showing some confluence here with bull flag + trendline break from last month's disaster.
Fibs also coincide with some of the idea here with us currently in the golden zone
Short term, I'd take a stop here below 52.50 as it can get ugly back to 50, and would consider taking another long there at 50.
For now, 53-54 range looks good for long pullback. 54.60 is the 333SMA on the 1HR chart here. Looks like a great spot for starter entries. If the pullback does not come, a break above 57 (pm highs TODAY, 4/23) should see a nice push towards 60 psych level which could see some strong resistance. Targeting 62 if we break 60.
Leaps look great here with all this confluence. Easy stop below that 50 psych.
Targets on chart are assuming we do not get a pullback tomorrow. If we do, the r/r becomes much better to the long side. This chart does not look good for bears. Options flow
Thoughts on XYZ?

CHTR Charter Communications Options Ahead of EarningsAnalyzing the options chain and the chart patterns of CHTR Charter Communications prior to the earnings report this week,
I would consider purchasing the 360usd strike price Calls with
an expiration date of 2025-9-19,
for a premium of approximately $22.35.
If these options prove to be profitable prior to the earnings release, I would sell at least half of them.

US30 – Descending Channel intact after False BreakoutFX:US30 is currently trading within a clearly defined descending channel, with price action continuously being restricted by the upper trendline. The recent decline indicates that sellers are in control, suggesting the possibility of continuation.
Price has recently broken through a key support area and may come back to retest it. If this level holds as support, it will reinforce the bearish structure and increase the likelihood of a move toward the 34,100 target, which aligns with the boundary of the channel.
As long as price remains below this support area, the bearish outlook remains intact. A false breakout may occur to "trap" buyers, so it is necessary to wait for clear reversal candle confirmation before entering a trade.
Remember, always confirm your setup and use appropriate risk management.

21 April Nifty50 trading zone
#Nifty50 #option trading
99% working trading plan
👉Gap up open 23918 above & 15m hold after positive trade target 24032, 24212
👉Gap up open 23918 below 15 m not break upside after nigetive trade target 23760, 23680
👉Gap down open 23760 above 15m hold after positive trade target 23912, 24032
👉Gap down open 23760 below 15 m not break upside after nigetive trade target 23684, 23460
💫big gapdown open 23680 above hold 1st positive trade view
💫big Gapup opening 24032 below nigetive trade view
📌 Trade plan for education purpose I'm not responsible your trade
More education follow & support me

Scalping with ATM Options Using Candle + OI Confirmation!Hello Traders!
If you love quick entries and fast exits with defined logic, then ATM Option Scalping is your game. But scalping without confirmation often leads to stop-loss hits. That’s why combining candlestick structure with live Open Interest (OI) data gives you a serious edge. Let’s break down the exact setup I use to scalp with ATM options in Nifty & BankNifty .
Why ATM Options for Scalping?
Better Liquidity: ATM strikes have tight spreads and high volumes, making execution quick and efficient.
Quick Premium Movement: Even small index moves reflect fast in ATM premiums.
Less Theta Decay (Intraday): Within first half of day, theta doesn’t hurt much. Scalping avoids time decay traps.
Scalping Strategy: Candle + OI Confirmation
Step 1 – Watch 5-Min Candle Setup:
Look for strong breakout candles, bullish/bearish engulfing, or reversal candles at key zones like VWAP/PDH/PDL.
Step 2 – Confirm with OI Shift:
Check ATM strikes on option chain.
Put OI rising + Price sustaining = bullish confirmation.
Call OI rising + Price rejecting = bearish confirmation.
Step 3 – Take Trade in ATM Option:
Enter CE or PE near breakout candle close with proper SL below/above that candle.
Step 4 – Exit Fast (Scalp Mode):
Book partial profits at 30–40% or when next resistance/support is hit. Avoid overholding!
Bonus Risk Management Tips
Avoid Trading Near News or Events: OI gives false signals in high volatility zones.
1 Trade = 1 Risk Unit Only: Do not revenge trade. Scalping is about accuracy, not frequency.
Trade only when both candle + OI align: No confirmation = no entry.
Rahul’s Tip
Let the chart speak, but let the OI validate. When both agree — that’s where scalpers win big.
Conclusion
Scalping with ATM options using candle structure + OI shift is a powerful setup if executed with discipline. It’s fast, clean, and logical. Focus on 1–2 setups a day — and make them count.
Do you scalp ATM options? Share your entry rules or struggles in the comments below!

GBPUSD. Weekly trading levels 14 - 18.04.2025During the week you can trade from these price levels. Finding the entry point into a transaction and its support is up to you, depending on your trading style and the development of the situation. Zones show preferred price ranges WHERE to look for an entry point into a trade.
If you expect any medium-term price movements, then most likely they will start from one of the zones.
Levels are valid for a week, the date is in the title. Next week I will adjust the levels based on new data and publish a new post.
! Please note that brokers have a difference in quotes, take this into account when trading.
The history of level development can be seen in my previous posts. They cannot be edited or deleted. Everything is fair. :)
----------------------------------------------
I don’t play guess the direction (that’s why there are no directional arrows), but zones (levels) are used for trading. We wait for the zone to approach, watch the reaction, and enter the trade.
Levels are drawn based on volumes and data from the CME. They are used as areas of interest for trading. Traded as classic support/resistance levels. We see the reaction to the rebound, we trade the rebound. We see a breakout and continue to trade on a rollback to the level. The worst option is if we revolve around the zone in a flat.
Do not reverse the market at every level; if there is a trend movement, consider it as an opportunity to continue the movement. Until the price has drawn a reversal pattern.
More information in my RU profile.
Don't forget to like Rocket and Subscribe!!! Feedback is very important to me!

GEX Analysis & Options “Game Plan”🔶 Short- and longer-term perspective in a high IV, negative GEX environment
🔶 KEY LEVELS & RANGES
Spot: 221
Gamma Flip / Transition: around 250 (the turquoise zone on the chart)
– This zone typically marks a “power shift.” If price decisively breaks above 250 and holds, market makers’ gamma positioning could flip from neutral/negative to positive.
Put Support: 200
– A large negative gamma position has accumulated here, making 200 a strong support level. If it breaks, the downside may accelerate.
Call Resistance: 400
– A major long-term “call wall” where a significant amount of OTM calls are concentrated. It’s more relevant to LEAPS; currently far from spot, so not a realistic short-term target.
Call Resistance #2: 300
– A medium-term bullish objective, still above the 200-day MA. You’d need to be strongly bullish to aim for ~300 by May (e.g., going for a 16-delta OTM call).
Short-Term / Intermediate GEX Levels:
– There are gamma clusters around 220–230 and 250–260 . These areas often see higher volatility, possible bounces, or stalls (chop) due to hedging flows.
🔶 WHATEVER SCENARIO – SHORT TERM (0–30 DAYS)
A) Upside Continuation / Rebound
– If TSLA closes above 225–230 , the next target is 240–250 (transition / gamma flip).
– If it breaks above 250 and holds (e.g., successful retest), market makers may shift to “long gamma,” fueling a quicker move to 260–270 .
– Resistance: 250, 300, with an extreme LEAPS-level at 400.
B) Downside Move / Bearish Break
– If price dips below ~220 and sustains, the next targets are 210–200 (major put wall / negative gamma).
– If 200 fails, negative gamma may magnify the sell-off. It’s an extreme scenario but still on the table given high IV and macro/geopolitical risks.
– Support: 210, 200 — likely stronger buying interest near 200, possibly a short-term bounce.
– The options chain suggests near-term hedging via puts for this scenario.
C) Chop / Sideways
– If TSLA stays in 210–230 , market makers (short options) might benefit from high IV/time decay.
– Negative GEX, however, can trigger sudden moves in either direction; caution is advised.
🔶 LONGER-TERM FOCUS (6–12 MONTHS, LEAPS)
NET GEX = -61.97M (negative territory) suggests longer-dated positioning is also put-heavy or carries notable negative gamma.
HVL / pTrans = 250 is a key pivot; cTrans+ = 400 is distant call resistance. Between these levels, there’s a mix of put/call dominance.
If Tesla undergoes a fresh growth phase (AI, robotaxi, energy storage, etc.) and clears 250/300 , 400 could become the next significant call wall — but that’s more of a multi-month horizon.
🔶 STRATEGY IDEAS (High IV Environment)
1. Short-Term Bearish
– If you’re bearish and expecting TSLA to test 220–210, consider a bear put spread or net credit put butterfly (lower debit) to leverage high IV.
– Targeting 200, but keep in mind negative gamma may accelerate downside movement.
2. Medium-Term “Contra” Bullish (bounce to 250)
– If GEX suggests a bounce off 210–220, consider a bull call spread (e.g., 220/240) or a net debit call butterfly (220/240/250).
– Be mindful of sudden swings, as we remain in negative gamma territory.
3. Longer-Term Bullish (>3–6 months)
– A call butterfly with upper strikes around 300–350 offers capped debit and higher potential payoff if a bigger rally materializes.
– A diagonal spread (selling nearer-dated calls, buying further-out calls) exploits elevated front-end IV.
4. Neutral / Range-Bound
– If TSLA stays in 200–250 , you could use Iron Condors (e.g., 200/260) to benefit from time decay and any IV collapse.
– Exercise caution: negative gamma can generate abrupt, directional moves, making a neutral stance riskier than usual.
🔶 ADDITIONAL NOTES & “BIG PICTURE”
High IV & Negative GEX: TSLA has a track record of large swings. Negative GEX can intensify sell-offs, while forced hedging might trigger rapid rebounds.
Preferred Structures: With expensive premiums, spreads (vertical, diagonal) and butterfly configurations generally fare better than plain long options (less vulnerable to time decay).
Potential Catalysts: AI announcements, Autopilot breakthroughs, new product lines, and macro changes can swiftly alter market dynamics. Keep tracking GEX updates and news flow; TSLA tends to respond dramatically to fresh developments.
🔶 Bottom line: From 221 spot, watch 210–200 on the downside and 240–250 on the upside short term. Medium-term bullish target = 300 , while 400 remains a far LEAPS scenario. High IV + negative gamma = fast, potentially volatile moves — so risk management and spread-based approaches are crucial.
