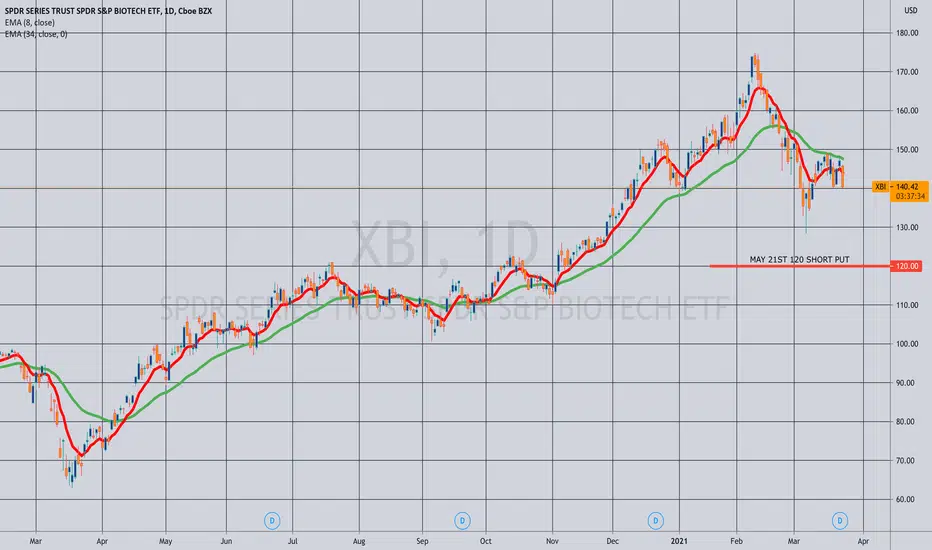
Opening (IRA): XBI May 21st 120 Short Put... for a 2.17/contract credit.
Notes: 30-day at >35% at 40.1%. Selling the 16 delta here. 1.84% ROC at max as a function of notional risk. As usual, will take profit on approaching worthless or, if in the money at expiry, take assignment and sell call against.
Optionstrategies
Rolling (IRA): SPY May 21st 331 Short Put to May 21st 360... for a 1.87 credit.
Notes: Here, a continuation of a longer term play I established at the beginning of the year. (See Post Below). With the 331 at >50% max and >45 days to go, rolling up to the 360 strike (17 delta) for both a realized gain and a credit. Total credits collected of 8.08 versus current short put value of 3.60; total realized gain: 8.08 - 3.60 = 4.48 ($448).

Closing (IRA): EWZ March 31st 30 Short Put... for an .08/contract debit.
Notes: In for .60/contract (See Post Below); out for .08 with 8 days to go. .52 ($52)/contract profit.

RUSSEL ETF 20% profit play during correction with Iron Condor
One of the most highest probability of trades are: neutral Iron Condors with high Implied Volatility on large indices. (SPX, DJI, RUT)
The more an indice is overbougth, than better this strategy works, as the correction also results more movement into downside.
Unlike other overvalued stocks, however: the indices are not collapsing. (except for 1-2 extreme cases where immediate intervention is required, eg March 2020)
I'm always trading the alternative ETFs of these indices:
SPY = S&P500 = ES mini futures IWM = Russel 2000 = RT mini futures DIA = DJI = YM mini futures .etc...
On Friday I've opened an IWM Iron Condor, so here are my reasons:
(1) RTY1! Futures Analysis
The Russel mini futures at local top hit the 3 year trendline, bluffy upside trendline permanently broke.
(2) Divergence with breakdown
Hard daily divergence in the last few months, my smooth RSI trendline breeaks.
(3) Relative high IVR
Relative Implied Volatility Rank (IVR) increases.
This value, if high enough (e.g., above 45), favors neutral credit strategies like Iron Condor.
In the case of indices, this is particularly rare, occurring every few months. At these times you can safely open neutral strategies (wide wings), for example: Iron Condor, Strangle.
(4) My Iron Condor hunter script signal
My Iron Condor Hunter indicator give me an automatic signal with safe ranges.
As you see: in the past almost every time indicated the safe range successfully. (I'm not counting the 2020 Marc, every regular strategy failed in that crash).
(5) Safe levels are well defined in my range
I'm always defining safe price levels (based on the nearest short term high/low points).
In my case these levels are well defined inside the Iron Condor Hunter range:
CONCLUSION: I've opened an Iron Condor on IWM (Russel ETF)
Profit target: 20% Max profit: 68$ Max loss: 332$ Tasty IVR: 13 POP: 69% Expiry: 42 days
Strategy: Neutral IC
Buy 1 IWM April16' 185 Put Sell 1 IWM April16' 189 Put Sell 1 IWM April16' 244 Call Buy 1 IWM April16' 248 Call
Stop: Closing immediately if daily candle is closing below put strikes or above call strikes. Safe levels (190,205,229) are defending my borders.
Take profit strategy: I'm taking at the 55% of max.profit in this case. Inside the curve I'm usually in profit.
If you liked this article, check my other ideas.
Anyway: HIT THE LIKE BUTTON BELOW, and follow my fresh ideas ( @mrAnonymCrypto on tradingview ).

Old Nuggets: Defined Risk Skew AccommodationSkew. It can be a pain in the butt if you want to trade both delta neutral and probability neutral.
In QQQ, a delta neutral setup at the moment would be: selling a spread on the put side with the short put leg at the 275 (17 delta) and on the call side with the short call leg at the 344 (17 delta). However, this results in a short put strike 38 strikes away from current price and a short call strike 31 strikes away. It's delta neutral, but the probability of profit on the put side is 83% and on the call side 78%, so it isn't both delta neutral and probability neutral. Ugh.
Fortunately, there is a solution to obtain both a delta neutral and a probability neutral setup, and it's with a variation on the iron condor: a "double double" -- double the contracts on the call side, with the put side being double the width of the call side spread. Because the risk associated with the put side spread -- that attributable to a five wide -- is greater than the risk associated with the call side (2 x 2 or the equivalent of a four wide), the maximum risk of the setup is that of a five wide -- the widest wing of the setup. In other words, doubling up the number of contracts on the call side doesn't increase buying power effect, because it's attributable to the widest wing (i.e., 5 > 2 x 2, so buying power effect is that attributable to the five wide).
Here, you can't quite go exactly double due to strike availability at the moment on the put side (there's only five wides there), but you can go five wide on the put side, and 2 times a two wide on the call (the functional equivalent of a four wide) to get both a net delta and probability neutral setup:
Put Side Short Put Leg: 17 delta
Put Side Probability of Profit: 83%
Call Side Short Call Leg: 2 x 12 delta
Call Side Probability of Profit: 82%
Resulting Setup Delta: .07
Naturally, skew isn't always to the put side; it's sometimes on the call side, where we'd do the opposite to accommodate skew: double up the number of contracts on the put side (but at half the spread width of the call).

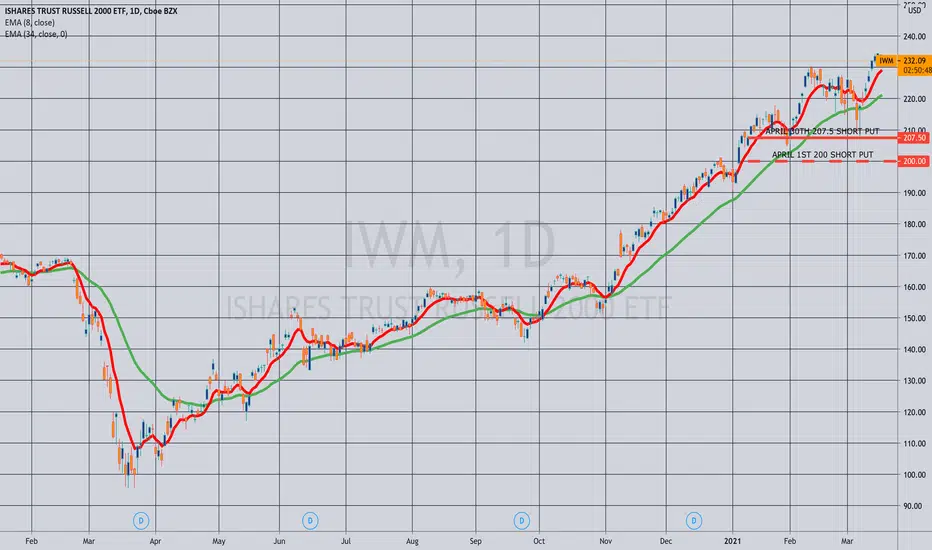
Rolling (IRA): IWM April 1st 200 Short Put to April 30th 207.5... for a 2.28 credit.
Notes: With only .40 of extrinsic left and 16 days to go, rolling this out to around the 16 delta strike in the contract nearest 45 days until expiry for a realized gain of 2.40 ($240) (See Post Below) and a 2.29 credit. Total credits collected of 4.57.
Rolling (IRA): SPY July 16th 250 to July 16th 306 Short Put... for a 1.89 credit.
Notes: As with my June short put roll, a continuation of a longer-dated setup. Rolling up at 50% max to lock in the realized gain to the strike paying at least 1%. Total credits collected of 4.44.

Using VXX as VIX alternative with good P/L
Yesterday I've played an alternative VIX instrument.
I've tired to searching good ROI or P/L rates at VIX $20 VIX support, so I've searched some alternative, but VIX related instrument.
Lets see what can give us this BARCLAYS BANK VIX Short ETN (=VXX)
(1) Yearly support + incoming buy volume
The lowerst value of the previous year was $13.
In the past month significant buy volume arrieved.
Combined this two reason could lead into sidewalking or bounceback from this level.
VXX is a Trust, so we see volume displayed (unlinke in the case of the VIX)
(2) VIX play ROI vs VXX ROI
You could see VXX like an ETN alternatative of the VIX.
Same dates for big edges, and melting down between the big edges.
Compared this two instument's ROI: the conclusion is obvious.
VXX ROI at support $13 for April with vertical spread: 37/63 = 58%
VIX ROI at support $20 for April with vertical spread: 20/80 = 25%
CONCLUSION
I'm buying a few call spreads for April, because the IVR not so high.
I think this is a very good P/L rate with a very high probability of profit!
Target: ............. 52% Max profit: ...... $111 Max loss: ......... $189 IVR: ................... 20 POP: .................. 65% Expiry: .............. 44days
Strategy: long call vertical spread (average IVR)
Sell 3 VXX April 16' $13 call Buy 3 VXX April 16' $12 call
Stop: Closing immediately if daily candle is closing below $13.
Take profit strategy: I'm taking at the 65% of max.profit in this case.
If you liked this article, check my other ideas.
Anyway: HIT THE LIKE BUTTON BELOW, and follow my fresh ideas ( @mrAnonymCrypto on tradingview ).

Rolling (IRA): TLT May 21st 148 to June 21st 145 Covered Calls... for a .92/contract credit.
Notes: A continuation of my TLT covered calls. (See Post Below). With the May 21st 148's at greater than 50% max, rolled out to the June 145's. Total credits collected of 6.42/contract with the June 21st 145's currently valued at around 1.60/contract, so I've realized gains of around 4.82/contract on the call side so far this year. With a cost basis of sub-110 (the last time I acquired), I remain fine with either being called away or continuing to work covered calls.
My natural preference would be for the underlying to settle so that I wasn't constantly chasing calls down the ladder, but you can't have everything.

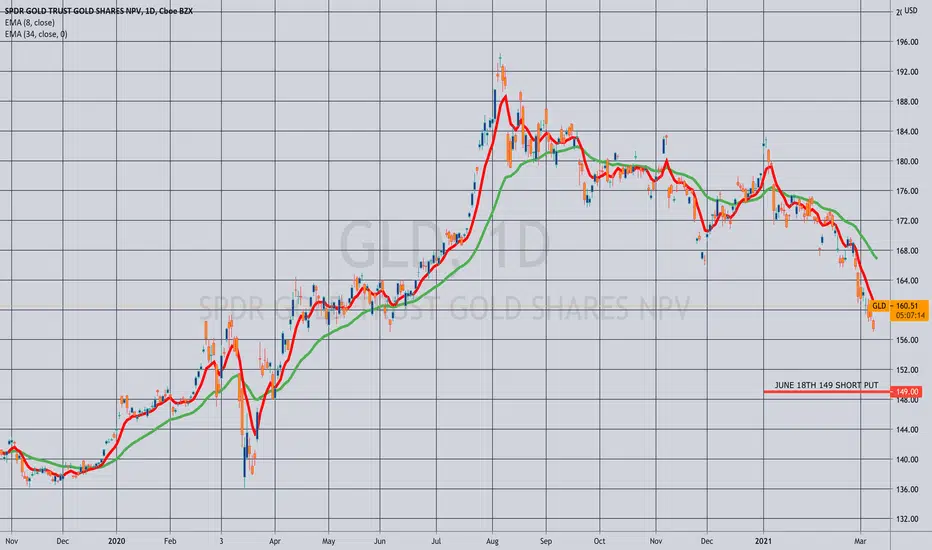
Opening (IRA): GLD June 18th 149 Short Put... for a 1.88/contract credit.
Notes: Adding a third "rung" to my GLD position out in June on this weakness. 1.28% ROC as a function of notional risk.
[ X ] United States Steel Corp short call vertical spreadLazy day, lazy trade.
My Iron Condor Hunter script indicated a potential iron condor for this instrument for the 12 - 23 range.
Let's check for the best setup for this signal.
(1) Basic TA to background check
After a quick TA I judged it too risky, because it limiting the downside potential correction.
The script indicated good ranges in the past 4 years, but now I'm a little bit hesitating about the downside move limit.
The script shows me 12$ as secury bottom target in the next 30 days, but the lowest low may be ~10$, based the green trendline
(2) Murrey Math levels
-1/8 and +1/8 are used for some kind of attempt to catch a trend reversal. -1/8 is an extreme support level during a bearish trend , while +1/8 is an extreme resistance during a bullish tendency.
A test of these lines indicates that the current trend is weakening. As a rule, the price doesn’t revers here and starts corrections towards 0/8 and 8/8. After that, the previous trend resumes.
On the weekly perfectly fit to my Murrey Math Lines Auto +1/8 script.
(3) Daily divergence
Divergence on daily chart , without any more comment..... Indicated local correction.
Breaked down my custom oscillator => correction validated.
CONCLUSION :
Modifying the strategy from the originally planned Iron Condor to Vertical Spread.
Sell 1 X Apr16' 21 call
Buy 1 X Apr16' 23 call
Max profit: ...... $80
Max loss: ......... $120
IVR: ................... 18.3
Probability of Profit: 73%
Expiry: .............. 45days
Strategy: Short call vertical
Risk management: I'm closing the trade immediately - if the daily bar closing outside my strikes - and I'm cutting my loss. (no matter what I'm believing)- usually I'm losing mutch less than my max profit in this case. Danger zone starts at 20.28$
Profit management: I'm sending an order at the 50% of max profit, immediately after my position opened - as usually.

INSG earnings over reaction UPSIDE potentialEarnings came out forced a negative overreaction. Possible drop to around 9$ - 9.5$ before retesting 14-15$

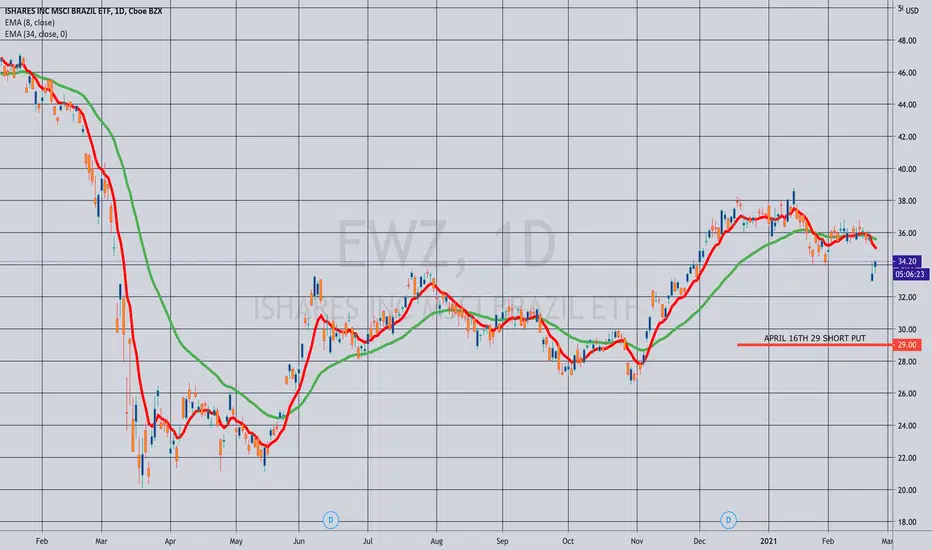
Opening (IRA): EWZ April 16th 29 Short Put... for a .57/contract credit.
Notes: Still have some March on, but adding some in April at the 16 delta strike with 30-day at 49.9% and expiry-specific at 45.7%. 2.00% ROC at max as a function of notional risk.
Opening (IRA): ICLN April 16th 21 Short Put... for a .43/contract credit.
Notes: In the top ten exchange-traded funds ranked by 30-day implied: 30-day at 55.9%, expiry-specific at 53.4%. 2.09% ROC at max.

OPENING (IRA): SLV MARCH 19TH 20.5 SHORT PUT... for a .34/contract credit.
Notes: With 30-day at 40.8% and expiry-specific at 42.4%, layering in some SLV, this time in the March cycle (I already have some February on). 1.69% ROC at max as a function of notional risk.

OPENING (IRA): MJ MARCH 19TH 16 SHORT PUT (LATE POST)... for a .71/contract credit.
Notes: With 30-day at 75%, and expiry-specific at 73.9%, opened a 20 delta short put in the weed ETF using my phone app. 4.65% ROC at max as a function of notional risk. As usual, will take off on approaching worthless or -- if in the money -- look at rolling out for a credit or taking assignment of shares and selling call against (whichever pays more).

OPENING (IRA): XLU FEBRUARY 19TH 56 SHORT PUT... for a .56/contract credit.
Notes: Selling premium in XLU, which for some reason has popped to the top of my screener, with 30-day is at 44.3%. This one's a modest yielder (2.942%), so, as usual, fine with taking assignment, getting paid to wait, and selling call against if that happens. 1.0% ROC on capital at max; 8.1% annualized.

OPENING (IRA): SPY JULY 16TH 250 SHORT PUT... for a 2.55/contract credit.
Notes: Targeting the strike paying around 1% of the strike price in credit as part of a longer-term strategy. (See Post Below). Generally, roll up with >45 days until expiry for realized gain and additional credit.

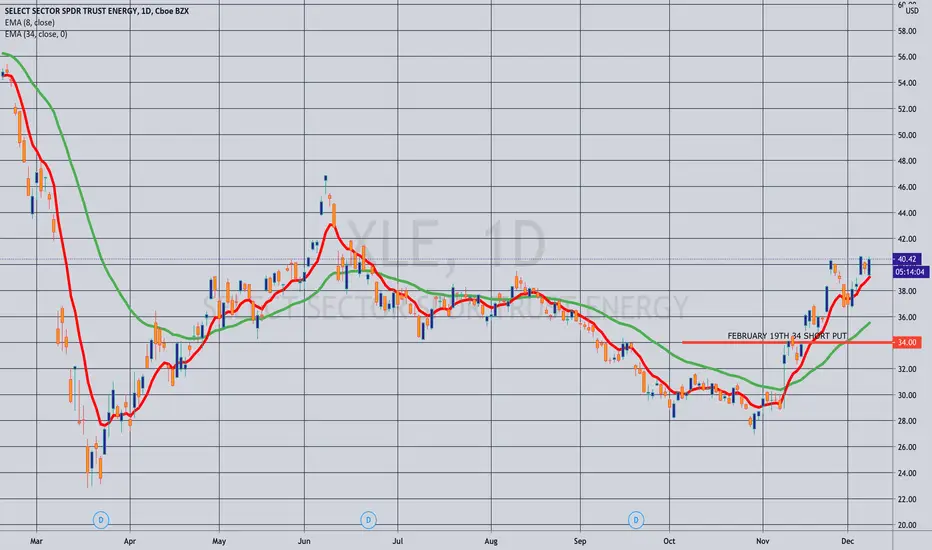
OPENING (IRA): XLE FEBRUARY 19TH 34 SHORT PUT... for a .71/contract credit.
Notes: Highest background implied on my exchange-traded fund board with 30-day at 40.2%, expiry-specific at 41.6%. I've already got some January stuck out there, so am basically laddering out a smidge by selling the 16 delta out in the February monthly. ROC: 2.13% as a function of notional risk at max; 10.65% annualized at max.
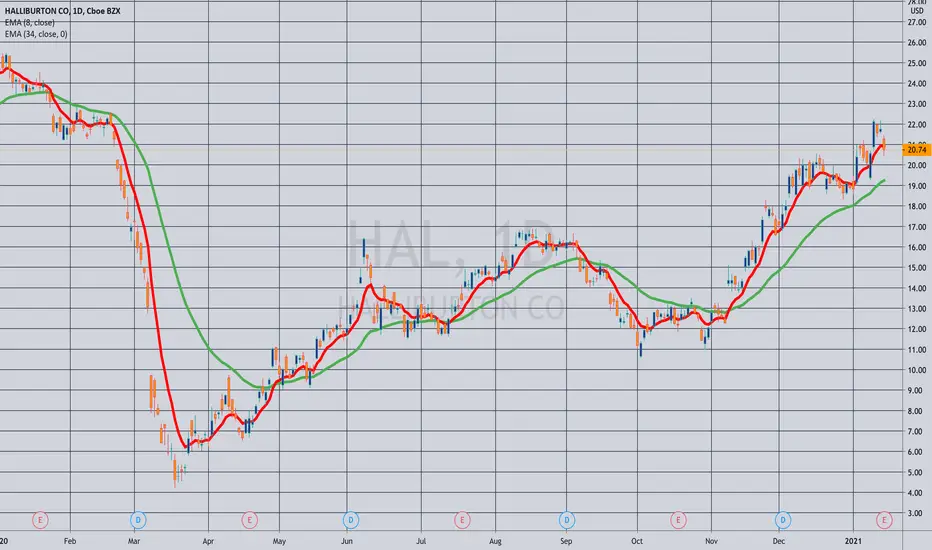
THE WEEK AHEAD: HAL, NFLX, AA, UAL EARNINGS; EWZ, XLE, SLV, IWMHIGHLY LIQUID OPTIONS SINGLE NAME EARNINGS (LISTED CHRONOLOGICALLY IN ORDER OF ANNOUNCEMENT AND SCREENED FOR >50% 30-DAY IMPLIED):
HAL (13/61/13.9%),* Tuesday, before market open
NFLX (25/50/11.3%), Tuesday, after market close
AA (18/69/15.9%), Wednesday, after market close
UAL (13/64/14.8%), Wednesday, after market close
From a bang for your buck perspective: AA ranks first, UAL, second, followed by NFLX, and HAL.
I already have a covered strangle on in UAL and don't anticipate putting on more single name risk in the IRA (which is my primary focus running into retirement), but will naturally post a play should I get into one.
EXCHANGE-TRADED FUNDS WITH >35% 30-DAY AND RANKED BY THE PERCENTAGE THE FEBRUARY AT-THE-MONEY SHORT STRADDLE IS PAYING AS A FUNCTION OF STOCK PRICE:
EWZ (18/45/10.3%)
XLE (23/42/9.7%)
SLV (25/42/9.4%)
GDX (12/38/9.2%)
XBI (18/37/8.7%)
KRE (16/36/8.7%)
EWW (15/36/7.5%)
I'm already in everything here but for KRE and EWW (the lowest bangs for your buck on the list) and the February monthly is a bit short in duration here for me (34 days) and March a tad long (62 days), so I may not do much this week in these, although going out to March with another rung in my GDX, SLV, and XBI positions isn't out of the question.
BROAD MARKET RANKED BY 30-DAY IMPLIED:
IWM (24/32/6.8%)
QQQ (22/30/6.4%)
SPY (16/24/4.8%)
DIA (13/23/4.6%)
EFA (14/20/3.8%)
In spite of the fact that IWM and/or RUT have the higher 30-day, I may look at adding a July (181 days) rung to the SPY short put ladder I have on in the IRA, targeting the strike paying at least 1% of the strike price in credit (which would currently be something like the 240), and do the kind of "opportunistic rolling" I've been doing with shorter duration rungs. (See Post Below). Although most frown upon going out this far in time, it's a way to deploy otherwise underutilized buying power that will earn something >0% while I work shorter duration setups or wait for a higher implied volatility environment and/or greater weakness. Additionally, my goals for the IRA are somewhat modest from a return on capital standpoint: I'm not looking to hit homers or be an incredibly attentive investor, opting for a once a week or even a once a month schedule of looking at things, making adjustments as appropriate, and/or taking off stuff approaching worthless that doesn't merit hanging onto due to the amount of time left in the contract.
* -- The first metric is the implied volatility rank or percentile (i.e., where the 30-day is relative to where it's been over the last 52 weeks); the second, thirty day implied; and the third, the percentage the at-the-money short straddle in the February monthly is paying as a function of stock price.
OPENING (IRA): INTC FEBRUARY 19TH 42.5 SHORT PUT... for a .70/contract credit.
Notes: As with my BA trade (See Post Below), targeting some options highly liquid single name for premium selling. Here, it's the beaten-down Intel, with the short put lining up nicely below support. 30-day at 44.8%, expiry-specific at 41.6%. I generally like to sell premium in single name at >50% implied, but occasionally settle for less when there's nothing better "at the top of the board," so to speak.
One of my New Year's resolutions is to not be so lazy with these plays, so compared monied covered call setups with delta metrics similar to those of going naked short put, the advantages and/or disadvantages of going with a particular expiry over just defaulting to the monthly, and whether something like a long call vertical or long call diagonal would make any sense here. I used to do these comparison and contrasts much more often, but it takes some additional time, but thought I'd set out the basic process of deciding what setup to go with here, even though I'm probably not going to do that with each and every trade I take.
COVERED CALL VERSUS NAKED SHORT
The February 19th 42.5 covered call would have a max profit of .60 currently with a break even of 41.90; the 45 monied, 1.14, with a break even of 43.84. For contrast, the 42.5 naked has a 41.80 break even, so you get a smidge (.10) more out of going naked versus going with the 42.5 monied. The 45 monied, with a 2.6% ROC at max, has a better return, but a break even that is nearly $2 higher than both the 42.5 monied and the 42.5 short put, so the trade-off there is less room to be wrong and therefore a higher return on capital. Both of these types of plays, however, have high buying power requirements, particularly in a cash secured environment, with the cash secured naked short put costing 41.80 to put on, with its primary advantage being ease of trade of management.
CHOICE OF EXPIRY
The other thing I've tended to be lazy with is choice of expiry. Here, there may be an advantage to "shopping" for the highest implied expiry, which -- in this case -- isn't the February 19th monthly; it's the expiry nearest Intel's earnings announcement, which is the January 22nd weekly with an expiry-specific implied of 47.1%. To get any short put to line up nicely with that support around 44, you're going to have to sell something like the 17 delta 44, which is paying around .52 right now for 23 days' of "work." On an annualized basis, you're probably going to get more bang for your buck out of going with the January 22nd versus going with the February monthly, which is more than twice as long in duration. The January 22nd 44's ROC%-age is 1.12% at max; 17.8% annualized while the February 19th 42.5 is 1.67% ROC at max, 12.0% annualized. Again, however, the trade-off is less room to be wrong versus getting in and out of these plays rather quickly to maximize annualized return on capital.
LONG CALL VERTICAL/LONG CALL DIAGONAL
When working with smaller accounts, long call diagonals have been one of my favorite plays to go with when I can't or don't want to afford a covered call or a naked short put, but want to do something synthetically that mimics a covered call. Given where Intel is at currently, I think it would set up nicely for either a one-off long call vertical or diagonal. Here's a couple plays with similar delta metrics to going with a naked short put with a delta value of between 16 (2 x the expected move) and something more aggressive, like a 30 delta.
The first example is the February 19th 37.5/45 long call vertical with a delta metric of around 20. A 7 1/2 wide, it would cost around 6.55 to put on, with a max profit metric of .95 and a 44.05 break even with a 14.50% ROC at max -- a whopping 103.8% annualized. What's not to like? The primary disadvantage is that one generally doesn't "manage" one-off debit spreads -- they either work fantastically or you take them off for a loss (e.g., 2 x max profit). Naturally, you can go with something far less aggressive than a monied, but one of your goals here should be taking profits relatively quickly, churning in and out of plays to maximize return on capital, rather than sitting out endlessly in an underlying without locking realized gains in on a regular basis.
The second, a diagonal, where you buy a high delta, longer-dated back month call and sell a shorter duration call, working it like a covered call. My general preference is to go at least "skip month" in duration for the back month, so I'd probably buy the April 16th 37.5 (90 delta) and sell the February 19th 74 delta 45, yielding a net delta metric of around 18. As with the static long call vertical, it's a 7.5 wide, but going longer duration with the back month costs a little more. Here, the whole setup costs 6.78 to put on, with max profit being the difference between the width of the diagonal (7.5) and what it cost to put on (6.78) or .72, an ROC%-age of 10.6% at max, 75.9% annualized. The advantage here is that you have opportunities to roll the short call to reduce cost basis further and therefore increase your ROC, but have a timer of sorts when you will have to exit the play, win or lose, at April expiry.
Here, I'm taking the "ease of trade management" route,* but will consider doing more monied short call verticals and/or diagonals going forward, particularly in some of the smaller accounts I'm working.
* -- To be completely honest, I hit click and send and got a fill before doing this post, but may do a separate play in one of the smaller accounts I'm working.

OPENING (IRA): KRE MARCH 19TH 42 SHORT PUT... for a 1.08/contract credit.
Notes: I already have some January on, and there is no February currently, so going out to March with 30-day still >35% at 36.5% and expiry specific at 38.4%. As with my other IRA short put trades, I'm fine with getting assigned, selling call against, particularly since it has a small dividend to pay you while you wait to exit any covered call profitably. ROC: 2.64% at max as a function of notional risk; 9.6% annualized at max.

$ENG PT 7.50-8 and higher$ENG PT 7.50-8 and higher
looking for better entry
Multi-leg:
1) Calls 7.50 Jan 15th 2021
Return +167%
2) Calls 7.50 Feb 19th 2021
Return +185%
