OPENING (IRA): IWM JANUARY 22ND 170 SHORT PUT... for a 2.10 credit.
Notes: Opening a short put nearest the 16 delta in the broad market instrument having the highest 30-day implied on the board. Here, it's IWM with 30-day at 27.5% and expiry-specific at 29.5%. ROC: 1.25% as a function of notional risk at max; 10.14% annualized at max.
For smaller accounts, consider going spread with the short leg camped out at the 16 delta, the long out from there to generate at least 10% of the width of the spread in credit or a similar spread in RUT (e.g., January 22nd 1645/1695, paying 5.20 as of the writing of this post).
Optionstrategies

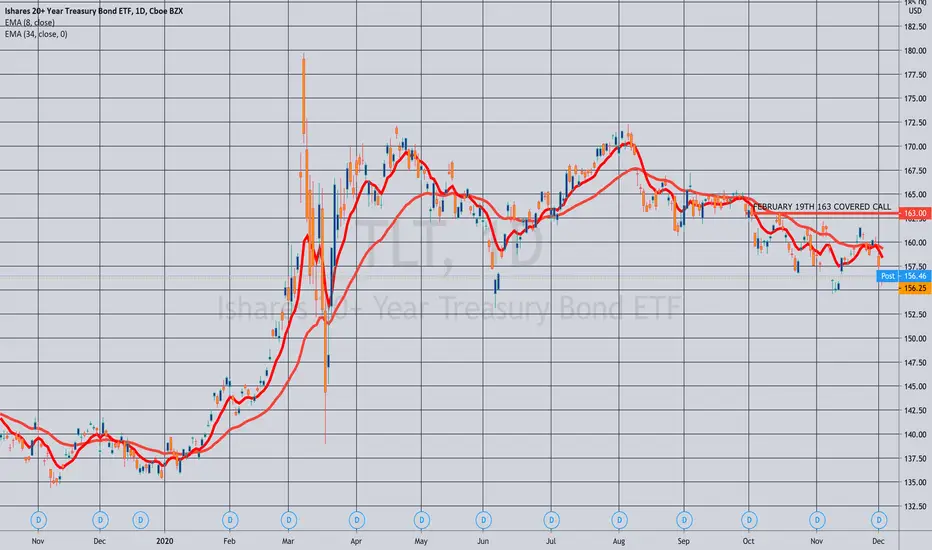
ROLLING (IRA): TLT JAN 15TH 165 COVERED CALLS TO FEB 19TH 163... for a 1.00/contract credit.
Notes: A continuation of my TLT covered calls. (See Post Below). Rolling out at >50% max to the strike paying around 1% of the strike price, which is the 163 in February, currently valued at 1.66. I'm fine with being called away, since my last acquisition was around 110, and I think the buying power could be better utilized in something with higher implied volatility (30 day is currently 14.9% here). By the same token, that 1.66 for the 163 short call is 7.67 annualized or 4.9% as a function of stock price. That isn't hugely sexy, but when you add that to TLT's current yield of 1.56%, I could think of worse places to park my money for a little bit while I ramp up other positions in the new year.
OPENING: IWM JANUARY 15TH 163 SHORT PUT... for a 1.93/contract credit.
Notes: Selling premium in the broad market exchange-traded fund with the highest 30-day implied, which is IWM/RUT. ROC: 1.2% at max; 9.7% annualized. Will take profit on approaching worthless or roll for duration/sell call against if in the money at expiry.

OPENING (IRA): SPX JANUARY 29TH 3290/3340 SHORT PUT VERTICAL... for a 5.10 credit.
Metrics:
Max Profit: $510
Max Loss: $4490
Break Even: 3334.90
Delta/Theta: 2.6/6.75
ROC: 11.4% at max; 5.7 at 50% max; 83.22% annualized at max; 41.61 at 50% max.
Probability of Profit: 87%
Notes: A 10%-er in the expiry nearest 45 days in duration, opened late in the session. For smaller accounts, consider selling a short put vertical in SPY where the credit received is at least 10% of the width of the spread.

OPENING (IRA): SPY SEPTEMBER 19TH 205 SHORT PUT... for a 2.19 credit.
Notes: Targeting the short put strike in September paying at least 1% of the strike price in credit. Roll up intraexpiry at 50% max with > 45 days until expiry; pull off on approaching worthless and/or sell call against if assigned.

THE WEEK AHEAD: SLV, GDX, XLE, IWM/RUTWith two shortened market weeks in a row for Christmas and New Year's, I probably won't be doing a ton here, but figured I'd do a post for how exchange-traded funds are looking in the waning weeks of 2020 ... .
EXCHANGE-TRADED FUNDS ORDERED BY PERCENTAGE THE AT-THE-MONEY SHORT STRADDLE NEAREST 45 DAYS IS PAYING AS A FUNCTION OF STOCK PRICE:
SLV (32/46/11.9%)
GDX (18/43/11.0%)
XLE (25/42/10.7%)
EWZ (14/40/10.0%)
XBI (21/36/9.1%)
KRE (18/36/9.3%)
I'm currently in small XLE, EWZ, KRE, and GLD positions, but will consider adding on weakness if any comes my way and the implied volatility sticks in there. One thing I don't want to do is to constantly follow high implied volatility, only to find myself grossly overweighted in energy, Brazil, and regional banks, however, so don't want to go too crazy adding in sectors that have been high in the list week in and week out over the past several months.
BROAD MARKET:
IWM (22/29/6.9%)
QQQ (19/26/6.5%)
SPY (13/22/4.9%)
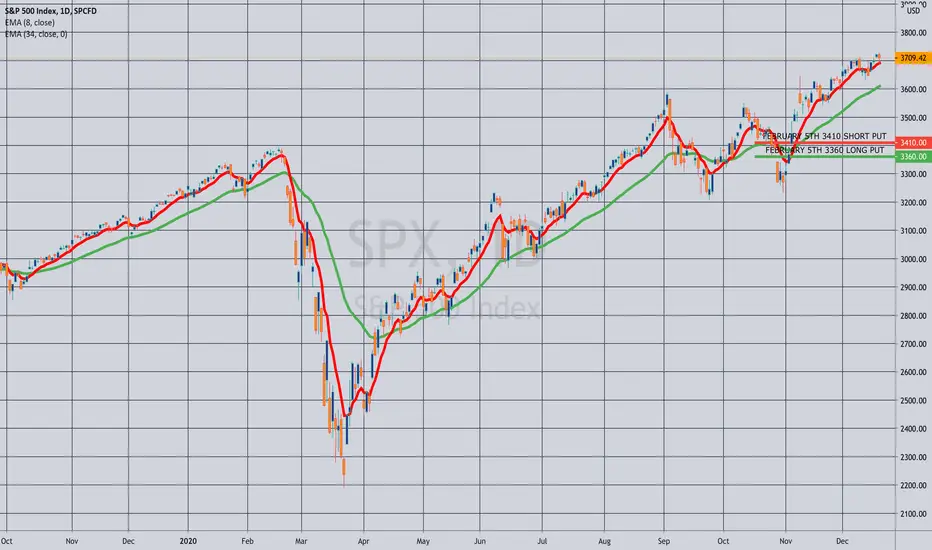
Pictured here is an SPX 50 wide set up to pay at least 10% of the width of the spread, or around 5.00/contract in the expiry nearest 45 days, which would be the February 5th weekly (currently 47 days until expiry). I would ordinarily opt for a higher implied volatility RUT setup, but there currently isn't a February 5th expiry available. You can certainly go with the January 29th (40 days) or the February 19th (59 days), with the preference being to put these on in a down day or days. Smaller account should consider going with SPY or QQQ spreads* with the appropriate combination of of contracts and spread widths commensurate with your account size.
BOND FUNDS:
TLT (1/15/3.5%) (1.609% Yield)
EMB (11/8/2.6%) (4.024% Yield)
HYG (7/10/2.1%) (4.917% Yield)
AGG (29/9/1.9%) (2.252% Yield)
In the IRA, I've been selling HYG short put here of 30 days' duration or so for a credit that is around the monthly dividend. With the December 18th short put having expired worthless, I'll look at adding some in the January 22nd cycle, where the 85 is paying .41 at the mid. As I've pointed out before, the premium in bond funds generally stinks, but I've been using this strategy as a way to deploy buying power that would otherwise be sitting there earning virtually nothing while I await down days or a higher volatility environment.
* -- Unfortunately, NDX isn't as liquid as either SPX or RUT, so I virtually never trade NDX spreads, opting instead for equivalent sizing in the QQQ's (e.g., 5 10-wides).
$WMT #WMT looks like a good SwingWalmart is bouncing off the 50 MA, if it holds, this be a good entry for debit spread. 147-153 call debit spread be a good play on this idea. Follow my free trades on our fb group www.facebook.com

THE WEEK AHEAD: GDXJ/GDX, XLE, KRE, SLV, IWM/RUTEARNINGS:
No options liquid underlyings announcing earnings this week that meet my criteria for a volatility contraction play, although ORCL (24/31) and WORK (2/33) both announce and could be played in some other way.
EXCHANGE-TRADED FUNDS RANKED BY THE PERCENTAGE THE JANUARY AT-THE-MONEY SHORT STRADDLE IS PAYING AS A FUNCTION OF STOCK PRICE:
GDXJ (14/41/12.1%)
XLE (25/41/10.4%)
KRE (23/40/10.6%)
SLV (28/41/10.2%)
GDX (15/38/10.2%)
EWZ (15/39/10.0%)
BROAD MARKET EXCHANGE-TRADED FUNDS RANKED BY THE PERCENTAGE THE JANUARY AT-THE-MONEY SHORT STRADDLE IS PAYING AS A FUNCTION OF STOCK PRICE:
IWM (23/28/7.1%)
QQQ (20/27/6.3%)
DIA (15/21/5.2%)
SPY (12/20/4.8%)
EFA (17/24/4.4%)
Pictured here is a RUT January 22nd 1655/1705 short put vertical with the short option leg camped out at the 16 delta. Markets are showing wide in the off hours, but look to get at least 10% of the width of the spread out of any play, with the preference being to put something on in a down day with the accompanying rise in volatility and expansion of the "probability cone." A smaller alternative would naturally be in IWM, where I'd look to get at least .50 out of January 22nd 162.5/167.5 5-wide.
For those who like to swim naked, the IWM January 22nd 162.5 (15 delta) and was paying 1.91 as of Friday close (1.15% ROC at max as a function of notional risk; 8.93% annualized).
* * *
On the IRA/retirement account front, I'll be looking to programmatically deploy buying power in broad market over medium to long-term time frames over the next several weeks and then turn to focusing on shorter term plays, so you're likely to see some apparently oddball things in my ideas feed that won't make a ton of sense looked at in isolation and won't be for everybody not only due to buying power effect, but due to duration. I'm using SPY here, but one can certainly do something similar in another of the cheaper (a relative term) exchange-traded funds with high liquidity that will allow you to ladder out in time without giving up too much to lack of liquidity in longer duration.
Essentially, it will look like a short put ladder, but with the rungs put on over time in increasing duration in similarly delta'd strikes or in strikes which pay a certain ROC %-age relative to the strike price (e.g., the SPY February 19th 321 short put, paying 3.27; the March 19th 300 short put, paying 3.02; the April 16th 283, paying 2.87, etc.), after which the individual rungs will be separately managed.
Although this isn't particularly buying power efficient relative to defined risk spreads, I'm shooting for a setup that is relatively set and forget running into retirement where I don't necessarily have to pop my portfolio open on a daily (or even weekly) basis to manage trades, but can go for fairly lengthy periods of time without having to touch or manage rungs and with modest expectations as to ROC %-age.
As a "quasi-cash" option, I'll also continue to deploy idle buying power in things like HYG puts (See Post Below) just that I'm not earning 0% of 0 and where I'm comfortable taking on shares and selling call against. Point in fact, that is probably not a bad stand-alone setup for an extremely conservative investor who isn't keen on taking broad market bullish assumption positions at all-time-highs where a number of people are calling "bubble" week after week. That being said, even this type of setup isn't riskless, as we saw in the March "sell everything" dip. At some point, you will potentially have to take on shares ... .

TRADE IDEA: /6E JANUARY 8TH 1.195/1.2 LONG PUT VERTICALMetrics:
Max Profit: 337.50
Max Loss: 287.50
Break Even: 1.1977
Notes: A bearish assumption directional shot at resistance. Alternatively, FXE January 15th 111/113 long put vertical, 1.05 max profit, .95 debit/max loss, break even 112.05 vs. 112.13 spot (although it's trading above that pre-market).

OPENING (IRA): RUT DECEMBER 24TH 1450/1500 SHORT PUT VERTICAL... for a 5.00 credit.
Notes: Selling 45 days 'til expiry premium in the broad market instrument with highest 30-day implied. Manage at 50% max, 2 x credit received.

OPENING: SPY DECEMBER 18TH 291/296 SHORT PUT VERTICAL... for a .52/contract credit.
Notes: The scaled down version of the 10%-er in SPX (See Post Below).
Manage winners via close or roll at 50% max; losers at two times credit received.

OPENING: SPX DECEMBER 11TH 2900/2950 SHORT PUT VERTICAL... for a 5.00 credit.
Notes: A ten-percenter on this weakness in the weekly nearest 45 days until expiry. 30 day at 29.4%; expiry-specific at 27.9%. Will manage at 50% max; 2 x credit received. To a certain extent, betting on post-election volatility crush.

OPENING (IRA): QQQ NOVEMBER 20TH 244 SHORT PUT... for a 3.70 credit.
Notes: My weekly 16 delta, 2 x expected move short put in the broad market exchange-traded fund with the highest 30-day implied, which is QQQ at 35.5%. Take off at approaching worthless and, if assigned, sell call against. Break even at 240.30. 1.54% ROC at max; 12.51% annualized.

THE WEEK AHEAD: AAL, TSLA, SNAP, NFLX EARNINGS; XOP, GDXJ, SLVEARNINGS:
Got a bunch of potentially worthwhile, earnings announcement volatility contraction plays on tap this coming week. Here there are, ordered by "bang for your buck":
AAL (29/99/19.7%), announcing Thursday before market open: Due to its size, I would probably go short straddle or iron fly, with the November 20th 12 short straddle paying 2.46 (19.7% as a function of stock price), and the November 20th 8/12/12/16 four-wide iron fly, paying 2.00 even.
TSLA (29/79/19.1%), announcing on Wednesday after market close. Pictured here is a 10-wide iron condor, with the short option legs set up at the 20 delta. Markets are showing wide in the after hours, but would adjust strikes as necessary to get at least one-third the width of your wings in credit (i.e., 3.33 for a 10 wide, 1.67 for a five, etc.).
SNAP (35/97/17.2%), announcing Tuesday after market close. The November 20th 19 delta 24/35 short strangle was paying 1.35 at the mid price, with the defined risk 22/25/33/36 iron condor paying 1.11.
NFLX (43/62/14.3%), announcing on Tuesday after market close. The November 20th 455/465/635/645 was paying 3.91 at the mid price as of Friday close. As with the TSLA defined risk play, look to adjust strikes as necessary to get at least one-third the width of your wings in credit.
EXCHANGE-TRADED FUNDS, RANKED BY PERCENTAGE OF STOCK PRICE THE NOVEMBER AT-THE-MONEY SHORT STRADDLE IS PAYING AND SCREENED FOR THOSE PAYING GREATER THAN 10%:
XOP (14/55/13.1%)
GDXJ (18/49/12.6%)
SLV (39/50/11.2%)
XLE (26/45/10.2%)
EWZ (15/42/10.0%)
BROAD MARKET:
QQQ (33/35/8.0%)
IWM (29/33/7.2%)
SPY (23/27/5.8%)
EFA (18/22/4.6%)
IRA DIVIDEND EARNERS, RANKED BY PERCENTAGE OF STOCK PRICE THE NOVEMBER AT-THE-MONEY SHORT STRADDLE IS PAYING AND SCREENED FOR THOSE PAYING GREATER THAN 10%:
SLV (39/40/11.2%)*
XLE (26/45/10.2%)
KRE (24/43/10.1%)
EWZ (15/42/10.1%)
MUSINGS:
16 days left until the general election. Out of an abundance of caution, I'm not adding anything here, but may do some "window dressing" rolls of my IWM and QQQ shorts puts I have on in the November 20th expiry just to lock in realized profit, and I'll do an educational post as to what that would entail. Handsitting, thumb twiddling while the markets do their thing is the hardest part ... .
* -- Neither SLV nor GLD pay a dividend.

THE WEEK AHEAD: UAL, DAL, SLB, WBA EARNINGS; XOP, SLV, QQQEARNINGS:
There are four options highly liquid underlyings that pop up on my screener for next week with 30-day implied of >50%: UAL (23/88/22.6%)* (on Wednesday after market close); DAL (13/74/19.1%) (Tuesday before market open); SLV (18/59/16.4%) (Friday, before market open), and WBA (43/54/12.2%) (Thursday, before market open).
Pictured here is a directionally neutral 29/50 short strangle in the November monthly with the options camped out at the 16 delta, yielding a 2 x expected move break even on the put side and > 2 x expected move on the call. Delta/theta -.41/6.00; paying 1.87 at the mid price as of Friday close (.94 at 50% max).
The DAL November 20th, 16 delta 27/42 short strangle was paying 1.83 at the mid price as of Friday close; delta/theta 1.48/4.39.
SLB is small enough to short straddle, but would go "skinny," as the November only has 2.5 wides to play with. The November 20th 15/17.5 was paying 1.48 as of Friday close, but treating it as a short straddle and taking profit at 25% max (.37) isn't particularly compelling, so would probably pass on the play and deploy buying power elsewhere.
WBA suffers from a similar affliction (2.5 wides out in November), but the 32.5/40 is paying 1.54 there, albeit with break evens greater than the expected move, but not quite 2 x.
EXCHANGE-TRADED FUNDS RANKED BY PERCENTAGE OF STOCK PRICE THE NOVEMBER AT-THE-MONEY SHORT STRADDLE IS PAYING AND SCREENED FOR THOSE PAYING >10%:
XOP (15/56/14.5%)
SLV (45/51/13.1%)
GDXJ (15/49/12.9%)
EWA (15/42/11.6%)
XLE (27/43/11.2%)
GDX (15/40/10.7%)
XBI (29/43/10.3%)
USO (4/43/10.1%)
BROAD MARKET RANKED BY PERCENTAGE OF STOCK PRICE THE NOVEMBER AT-THE-MONEY SHORT STRADDLE IS PAYING:
QQQ (28/33/8.2%)
IWM (25/32/7.6%)
SPY (19/25/5.9%)
EFA (13/20/4.8%)
DIVIDEND PAYERS RANKED BY PERCENTAGE OF STOCK PRICE THE NOVEMBER AT-THE-MONEY SHORT STRADDLE IS PAYING AND SCREENED FOR THOSE PAYING >10%:
KRE (25/44/11.7%)
EWZ (15/42/11.6%)
XLE (27/43/11.2%)
GENERAL MUSINGS:
I already have a UAL covered call on, so am unlikely to partake in that underlying further here. Moreover, in the IRA/retirement account, I'm already deployed in everything at the top of the heap from an implied volatility standpoint, although I may carry on with my standard weekly 16-delta short put in the broad market instrument with the highest implied volatility, which would be QQQ. Alternatively, I'll do a QQQ 10-percenter (See Post Below) instead, as NDX isn't fantastically liquid, and a November 27th (currently, 48 days until expiry) will be available. To emulate a 50-wide, however, in NDX, I'll have to go 10-wide with 5 contracts or 5 wide with 10, etc. For example, the November 27th 240/245 is paying .50, and I'd have to sell 10 of those to emulate the NDX November 27th 9925/9975, paying 5.04. I would naturally prefer just selling one NDX spread, since it means fewer fees, but if the bid/ask is grotesque, I'll just have to go with QQQ or a RUT 50 wide. (The RUT November 27th 1385/1435 was paying 5.04 at the mid as of Friday close).
* -- The first metric is the implied volatility rank (where implied volatility is currently relative to where it's been over the last 52 weeks); the second, 30-day implied volatility; and the third, what the November at-the-money short straddle is paying as a percentage of stock price.

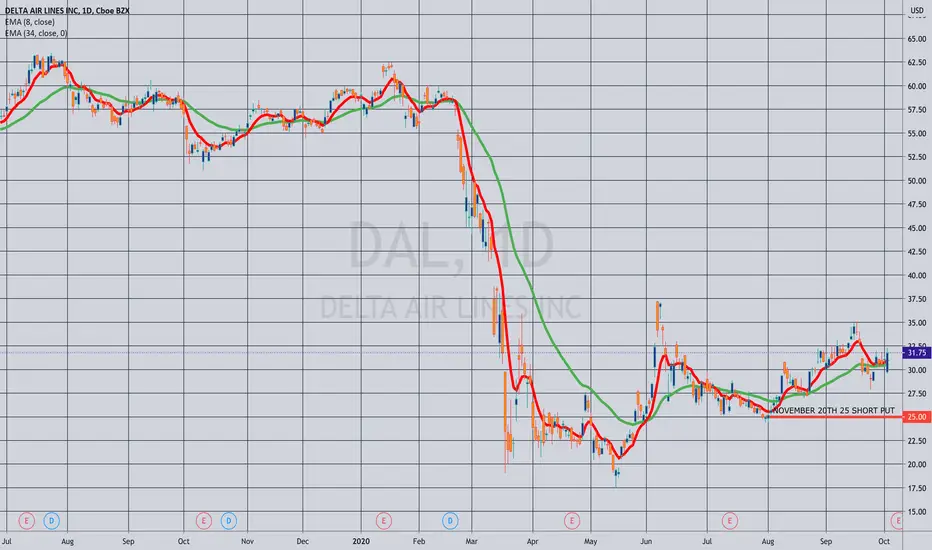
THE WEEK AHEAD: DAL, CCL EARNINGS; GDXJ/GDX, SLV, KREEARNINGS:
CCL (28/88/25.9%) and DAL (18/77/22.1%)* announce earnings on Thursday.
The DAL November 20th 21 delta, 2 x expected move 26/41 short strangle is paying 2.41 or 7.6% as a function of stock price (1.20 at 50% max; 3.8% as a function of stock price). I've pictured a short put here as the simplest play to get in on a sector that has been hammered by the pandemic, assuming you don't mind potentially being assigned at that price to work a longer-term play (i.e., covered calls).
CCL is small enough to play via short straddle, with the November 20th 15 short straddle paying 3.92 or 25.9% as a function of stock price (.98 at 25% max; 6.5% as a function of stock price). Alternatively, the > 2 x expected move 10/20 short strangle is paying .93 (.46 at 50% max; 3.0% as a function of stock price).
EXCHANGE-TRADED FUNDS WITH >35% 30-DAY IMPLIED RANKED BY PERCENTAGE THE NOVEMBER AT-THE-MONEY SHORT STRADDLE IS PAYING AS A FUNCTION OF STOCK PRICE:
TQQQ (41/103/30.2%)
XOP (19/60/17.3%)
USO (10/55/146%)
GDXJ (20/50/15.1%)
SLV (39/48/13.5%)
EWZ (21/46/14.1%)
XLE (30/44/131%)
XBI (36/45/13.0%)
GDX (19/42/12.7%)
SMH (27/47/11.2%)
QQQ (35/35/10.5%)
BROAD MARKET:
QQQ (35/35/10.5%)
IWM (32/34/9.8%)
EFA (25/22/9.0%)
SPY (21/26/8.0%)
IRA DIVIDEND EARNERS/PREMIUM SELLING:
KRE (28/47/13.6%) (Current Yield: 3.83%)
SLV (39/48/13.5%) (No Yield; Precious Metals Position)
EWZ (21/46/14.1%) (Current Yield: 3.80%)
XLE (30/44/13.1%) (Current Yield: 7.52%)
XBI (36/45/13.0%) (Current Yield: .35%; Premium Selling Play)
SMH (27/47/11.2%) (Current Yield: 0.00%; Premium Selling Play)
QQQ (35/35/10.5%) (0.60% Yield; Premium Selling Play)
MUSINGS:
With the general elections now 29 days away, I'm not doing much here in terms of adding new positions. With the margin account in particular, I'm looking at going completely flat at or near October opex and then watching the show from the sidelines.
On the IRA/retirement account front, I'm already in most of the underlyings at the top of the implied volatility ladder, so don't anticipate doing much here anyway. I will naturally look at delta on a portfolio-wide basis to see whether I need additional delta one way or the other to make myself less directional running into the elections. We could, after all, conceivably see one of a variety of things depending on how things play out (i.e., relief rally, sell-off, "sideways nothing burger").
With Friday's sell-off, however, I'm tempted to add a smidge more of QQQ in the November cycle for my weekly 16 delta, 45 days 'til expiry broad market short put (the November 20th 16 delta 237 short put was paying 3.73 at the mid as of Friday close; 1.60% ROC as a function of notional risk).
* -- The first metric is where 30-day implied volatility is relative to where it's been over the past 52 weeks; the second, 30-day implied volatility; and the third, the percentage the November at-the-money short straddle is paying as a function of stock price.
EDUCATION: THE OPTIONS HIGHLY LIQUID SINGLE NAME LISTAnd now, for the current single name list:
AAL (American Airlines)
AAPL (Apple)
ABBV (AbbVie)
ACB (Aurora Cannabis)
AEO (American Eagle Outfitters)
AGNC (AGNC Investment)
AMC (AMC Entertainment)
AMD (Advanced Micro Devices)
AXP (American Express)
AZN (AstraZeneca)
BA (Boeing)
BABA (Alibaba Group Holdings)
BAC (Bank of America)
BB (Blackberry)
BBBY (Bed Bath and Beyond)
BMY (Bristol-Myers Squibb)
BP (British Petroleum)
BYND (Beyond Meat)
C (Citigroup)
CCL (Carnival Group)
CGC (Canopy Growth)
CHWY (Chewy)
CLDR (Cloudera)
CMCSA (Comcast)
CNX (CNX Resources)
COST (Costco)
CRM (Salesforce.com)
CRON (Cronos Group)
CRWD (Crowdstrike Holdings)
CSCO (Cisco Systems)
CVS (CVS Health)
CVX (Chevron)
DAL (Delta Airlines)
DDOG (Datadog)
DELL (Dell Technologies)
DIS (Walt Disney)
DKNG (DraftKings)
DOCU (Docusign)
EBAY (EBay
ET (Energy Transfer)
F (Ford)
FB (Facebook)
FCX (Freeport-McMoran)
FDX (FedEx)
FISV (Fiserv)
FLIR (Flir Systems)
GE (General Electric)
GILD (Gilead Sciences)
GM (General Motors)
GOLD (Barrick Gold)
GPS (Gap)
GS (Goldman Sachs Group)
HAL (Haliburton)
HD (Home Depot)
IBM (International Business Machines)
INTC (Intel)
IQ (Iquiyi)
JD (JD.com)
JNJ (Johnson & Johnson)
JPM (JP Morgan Chase)
KO (Coca-Cola)
KR (Kroger)
LUV (Southwest Airlines)
LVS (Las Vegas Sands)
LYFT (Lyft)
MDT (Medtronic)
MGM (MGM Resorts)
MPC (Marathon Petroleum)
MRK (Merck)
MRNA (Moderna)
MRO (Marathon Oil)
MS (Morgan Stanley)
MSFT (Microsoft)
MU (Micron Technologies)
NCLH (Norwegian Cruise Lines)
NFLX (Netflix)
NIO (Nio)
NKE (Nike)
NKLA (Nikola)
NVDA (Nvidia)
ORCL (Oracle)
OXY (Occidental Petroleum)
PBR (Petrobras)
PDD (Pinduoduo)
PENN (Penn National Gaming)
PFE (Pfizer)
PINS (Pinterest)
PLAY (Dave & Buster's Entertainment)
PLUG (Plug Power)
PTON (Peloton)
PYPL (Paypal)
QCOM (Qualcomm)
RAD (Rite Aid)
RCL (Royal Caribbean Group)
ROKU (Roku)
RTX (Raytheon Technologies)
SAVE (Spirit Airlines)
SBUX (Starbucks)
SLB (Schlumberger)
SNAP (Snap)
SONO (Sonos)
SPCE (Virgin Galactic)
SPG (Simon Property Group)
SQ (Square)
T (AT&T)
TGT (Target)
TMUS (T-Mobile U.S.)
TRIP (Tripadvisor)
TSLA (Tesla)
TWTR (Twitter)
UAL (United Airlines)
UBER (Uber)
UPS (United Parcel Service)
V (Visa)
VALE (Vale)
VIAC (Viacom CBS)
VZ (Verizon Communications)
WFC (Wells Fargo)
WKHS (Workhorse Group)
WMT (Walmart)
WORK (Slack Technologies)
WYNN (Wynn Resorts)
XOM (Exxon Mobil)

EDUCATION: THE OPTIONS LIQUID EXCHANGE-TRADED-FUND LISTLiquidity. Liquidity. Liquidity. Whether you're short strangling, iron condoring, laddering out short puts, or doing covered calls, having excellent options liquidity is the cornerstone of any options trade, and the universe of highly liquid options instruments is actually quite small relative to the smorgasbord of underlyings out there. I've posted my list of highly liquid exchange-traded-funds at various times in chat rooms, but thought I'd set it out here for easy reference. Here they are, in alphabetical order, along with a brief description of what they are:
BKLN (Leveraged Loan Index)
DIA (Dow Jones)
EEM (Emerging Market Equities)
EFA (MSCI ex. Canada/U.S.)
EMB (Emerging Market Bonds)
EWA (Australian Equities)
EWW (Mexican Equities)
EWZ (Brazilian Equities)
FEZ (Euro Stoxx 50)
FXI (Chinese Equities)
GDX (Gold Miners)
GDXJ (Junior Gold Miners)
GLD (Gold)
HYG (High Yield Corporate Bonds)
IWM (Russell 2000)
IYR (REIT)
KRE (Regional Banks)
LQD (Investment Grade Corporate Bonds)
MUB (Municipal Bonds)
QQQ (Nasdaq 100)
SLV (Silver)
SMH (Semiconductor)
SPXL (3 x Leveraged Bullish S&P 500)
SPY (S&P 500)
TLT (20-Year + Average Maturity Treasuries)
TQQQ (3 x Leveraged Bullish QQQ)
UNG (Natural Gas)
USO (Crude)
UVXY (1.5 x Leveraged Volatility)
VIX (Volatility)
VXX (Volatility)
XBI (Biotech)
XLE (Energy)
XLF (Financials)
XLI (Industrials)
XLP (Consumer Staples)
XLRE (REIT)
XLU (Utilities)
XME (Metals and Mining)
XOP (Oil and Gas Exploration and Production)
XRT (Retail)
UUP (Dollar Index)
And sorted by type:
BROAD MARKET EQUITY:
DIA (Dow Jones)
EEM (Emerging Market)
EFA (MSCI ex. U.S./Canada)
EWA (Australia)
EWZ (Brazil)
EWW (Mexico)
FEZ (Euro Stoxx 50)
FXI (China)
IWM (Russell 2000)
QQQ (Nasdaq 100)
SPXL (3 x Leveraged Bullish S&P 500)
SPY (S&P 500)
TQQQ (3 x Leveraged Bullish QQQ)
BONDS/FINANCIAL INSTRUMENTS:
BKLN (Leveraged Loan Index)
EMB (Emerging Market Bonds)
HYG (High Yield Corporate Bonds)
LQD (Investment Grade Corporate Bonds)
MUB (Muncipal Bonds)
TLT (20-Year + Average Maturity Treasuries)
SECTORS:
GDX (Gold Miners)
GDXJ (Junior Gold Miners)
KRE (Regional Banks)
SMH (Semiconductors)
XBI (Biotech)
XLE (Energy)
XLF (Financials)
XLI (Industrials)
XLP (Consumer Staples)
XLRE (REIT)
XLU (Utilities)
XME (Metals and Mining)
XOP (Oil and Gas Exploration and Production)
XRT (Retail)
REITs:
IYR
XLRE
COMMODITIES/CURRENCY:
GLD (Gold)
SLV (Silver)
UNG (Natural Gas)
USO (WTI Crude Oil)
UUP (Dollar Index)
VOLATILITY:
VIX
VXX
UVXY

THE WEEK AHEAD: MU, BBBY EARNINGS; XOP, GDXJ, SLV, EWZ, KRE, XLEEARNINGS ANNOUNCEMENT VOLATILITY CONTRACTION PLAYS:
MU (27/57/10.8%)*, announces Tuesday after market close.
BBBY (32/105/20.2%), announcement Thursday before market open.
Pictured here is an MU October 16th 44/55 short strangle, paying 1.52 as of Friday's close (.76 at 50% max).
For those of a defined risk bent: the MU October 16th 40/45/52.5/57.5 iron condor was paying 1.74 at the mid as of Friday's close, (.87 at 50% max).
For BBBY, I'd probably go short straddle, skinny short strangle, or skinny iron condor with the October 16th 14/15 skinny short strangle paying 2.46 as of Friday's close (.62 at 25% max), and the October 16th 10/14/15/19 4-wide paying 2.02 (.51 at 25% max) with risk one to make one metrics.
OPTIONS LIQUID EXCHANGE-TRADED FUNDS SCREENED FOR >35% 30-DAY IMPLIED AND RANKED BY PERCENTAGE THE NOVEMBER (56 DAY'S) AT-THE-MONEY SHORT STRADDLE IS PAYING AS A FUNCTION OF STOCK PRICE:
XOP (16/54/17.8%)
GDX (22/54/17.0%)
SLV (39/48/14.4%)
EWZ (19/44/14.1%)
GDX (21/43/14.1%)
XLE (26/41/13.5%)
SMH (24/40/11.3%)
BROAD MARKET:
QQQ (33/34/10.9%)
IWM (31/34/10.6%)
SPY (21/26/8.3%)
EFA (22/24/7.1%)
DIVIDEND GENERATORS FOR THE IRA SCREENED FOR THOSE WHERE THE NOVEMBER AT-THE-MONEY SHORT STRADDLE IS PAYING >10% OF STOCK PRICE:
SLV (39/48/14.4%)**
EWZ (19/44/14.1%)
KRE (27/44/14.2%)
XLE (26/41/13.5%)
MUSINGS:
With the major binary event of the year approaching (U.S. general elections), I'll be attempting to resist the urge to trade in the margin account and will flatten that completely running into the October monthly expiry. The intent was to wind that account up prior to year end, so now is as good a time as any.
With retirement approaching, my medium to long-term focus will be turning to IRA trades in a cash secured environment, with the focus on exchange-traded-funds with dividends and the general go-to strategy being short put, acquisition, and covering, resorting to highly liquid single name only in the event that sector and broad market volatility totally dry up. I'll continue to grind on those broad market/exchange-traded fund trades through the election as long as volatility hangs in there, naturally keeping some powder dry in the event that a high volatility event presents itself. This basic approach has worked well over the years, and I see no particular reason to change it now, even though it has zero sexiness and can be slow going, particularly if you're not the patient type.
My current stock positions are in SPY (covered call), TLT (covered call), IYR (covered call), and EFA (covered call). In addition, I've got short puts or short put ladders deployed in QQQ, IWM, SPY, SLV, EWZ, KRE, XLE, GLD, and HYG.
Previously, I was hesitant to dump my stock positions or allow them to be called away due to their paying dividends, but may change my tune, particularly with SPY, where the dividend is a paltry 1.76% relative to what the 30-day 2 x expected move short put is paying currently. Naturally, what a given option will pay will depend on where the implied volatility is at the given moment, but here the 2 x expected move short put nearest 30 days is the October 26th 305, paying 2.60 or .86% ROC at max (10.32% annualized).
The basic question is whether it's generally worth it to hang out in shares when you don't have to, even if you're getting a little extra something something if you've covered.*** Short puts, after all, make money regardless of whether the stock goes up or sideways and can even make money if the market goes down, assuming that your break even isn't broken; stock only makes money if it goes up. Short puts can be rolled to reduce cost basis further; once you're in stock, you're married to the position.
I guess I'm trying to talk myself into allowing my shares to be called away ... . :-)
* -- The first metric is the implied volatility rank (i.e., where 30-day implied is relative to where it's been over the past 52 weeks); the second, 30-day implied volatility; and the third, the percentage the October at-the-money short straddle is paying as a function of stock price.
** -- Neither SLV nor GLD pay a dividend.
*** -- The 2 x expected move short call nearest 30 days is the October 26th 346, paying 1.56 or 18.72 annualized, which also far exceeds what you'll receive in SPY dividends on an annual basis (currently 5.681/share or $568.10 per year for a one lot).

OPENING: SPY SEPTEMBER 25TH 308 SHORT PUT... for a 3.00 credit.
Notes: My weekly 16 delta short put in SPY. Expiry-specific implied at 23% ... .

THE WEEK AHEAD: M, CLDR, CRWD EARNINGS; GDXJ/GDX, SLV, QQQTHE WEEK AHEAD:
EARNINGS ANNOUNCEMENT VOLATILITY CONTRACTION PLAYS:
M (41/103/September 18.7%): Announces Wednesday before market open.
Potential Plays:
September 18th 13 short straddle, paying 1.30 as of Friday close, .33 at 25% max.
September 18th 5/7/7/9 iron fly, paying 1.07 as of Friday close, .27 at 25% max.
Look to take profit at 25% max.
CLDR (68/116/September 20.1%): Announces Wednesday after market close.
Potential Plays:
September 18th 13 short straddle, paying 2.60 as of Friday close, .65 at 25% max.
September 18th 9/13/13/17 iron fly, paying 2.13 as of Friday close, .53 at 25% max.
Look to take profit at 25% max.
CRWD (32/74/September 15.0%): Announces Wednesday after market close.
Potential Plays:
September 18th 101/145 short strangle, paying 4.03 as of Friday close, 2.01 at 50% max.
September 18th 100/105/140/145. Markets are showing wide in the off hours, but look to put on a setup that pays at least one-third the width of the wings in credit.
Comments: Not a ton is shaking next week for options liquid underlyings, but here are what appear to me to be the best candidates for volatility contraction plays. Naturally, I'm just preliminarily pricing these out to see whether they're potentially worthwhile, and actual strikes are likely to change somewhat running into earnings as price moves.
EXCHANGE-TRADED FUNDS SCREENED FOR >35% 30-DAY IMPLIED/OCTOBER AT-THE-MONEY SHORT STRADDLE PAYING >10% OF STOCK PRICE:
SLV (45/56/15.2%)
XLE (24/39/11.2%)
GDX (22/47/13.3%)
GDXJ (21/58/15.7%)
EWZ (17/44/12.3%)
XOP (13/50/14.1%)
GDXJ is paying the most as a function of stock price (15.7%), followed by SLV (15.2%), XOP (14.1%), and GDX (13.3%).
WHAT THE SHORT STRANGLES NEAREST 16 DELTA ARE PAYING:
The GDXJ October 16th 15/75 short strangle: 2.15, 3.6% as a function of stock price,
The SLV October 16th 22/32 short strangle: .97, 3.6% as a function of stock price.
The XOP October 16th 45/63 short strangle: 1.84, 3.5% as a function of stock price.
The GDX October 16th 38/47 short strangle: .84, 2.0% as a function of stock price.
Comments: I've already got a miners play on, so am likely to avoid getting into another closely correlated underlying here.
BROAD MARKET:
QQQ (29/32/8.8%)
IWM (22/28/7.6%)
EFA (17/20/5.6%)
SPY (12/22/5.3%)
WHAT THE SHORT STRANGLES NEAREST 16 DELTA ARE PAYING:
The QQQ October 16th 257/320 short strangle is paying 6.51, 2.2% as a function of stock price.
The IWM October 16th 140/170 short strangle, 2.93, 1.9%.
The EFA October 16th 60/69 short strangle, .93, 1.4%.
The SPY October 16th 317/391 short strangle, 4.95, 1.4%.
Comments: In the IRA, I've been mechanically selling 45 days 'til expiry puts at the two times expected move strike (basically, the 16 delta) and will pretty much continue to do so until 30-day drops below 20%. There's always hesitancy to continue to do this at successive all-time-highs, and, yes, it is likely I will be assigned shares at some point in a >2 times expected move sell-off, after which I'll proceed to cover. That being said, I've got an inordinate amount of undeployed buying power after all the acquisitional short put ladders I put on in the sell-off have come off; I'd rather take some risk here to earn "something," all while keeping a reasonable amount of dry powder free to take advantage if we get another one of those bodice rippers we had in mid-March. This week, I'll follow the implied volatility, and as of Friday close, that was in the QQQ's.
DIVIDEND EARNERS:
XLU (21/23/7.1%)
EWA (20/24/7.0%)
TLT (18/19/4.8%)
EFA (17/20/5.6%)
EWZ (17/44/12.3%)
IYR (17/24/6.5%)
HYG (17/14/2.8%)
SPY (16/22/5.3%)
EMB (11/11/2.7%)
The Brazilian exchange-traded fund leads the pack for the umpteenth week in a row, with XLU and EWA in distant second and third places. I'm fine with continuing to hit EWZ via acquisitional short put over and over again if that's where the implied volatility leads, but, yes, it's kind of getting old.
For what it's worth: The 2 times expected move EWZ October 16th 28 short put is paying .36 per contract as of Friday close (1.2% as a function of stock price).
Key: The first number in parentheses is the implied volatility rank or percentile (i.e., where implied volatility is relative to where it's been over the past 52 weeks); the second, 30-day implied volatility; and the third, the percentage of stock price that the specified monthly expiry at-the-money short straddle is paying.

UPDATE: EWZ SEPTEMBER 18TH 33 CC/OCTOBER 16TH 27 COVERED STRAD... with a cost basis of 31.93.
Notes: Another broken trade in which I took on shares. (See Post Below). Some work needs to be done on improving the 27 short call ... .

OPENING AMD AUGUST 21ST 60/78 SHORT STRANGLE... for a 2.90/contract credit.
Notes: Earnings play with high 30-day implied at 65.9%. Will look to take profit at 50% max or manage on side approaching worthless/side test ... .
