Nifty Index Levels for 23/08/2022Dear traders, I have identified chart levels based on my analysis, major support and resistance levels. Please note that I am not a SEBI registered member. Information shared for educational purpose. Please do take trade based on your own analysis and risk-taking abilities. Never ever worked with fixed mindset. Any news/result data may change the direction of the trend instantly. Focus on learning so you can take correct/better decision based on your analytical skills. PLEASE NOTE THAT NO ONE CAN BE 100% CORRECT. OVERALL, WE SHOULD CONTINUE TO LEARN & BE ABLE TO CLOSE IN PROFIT EVEN IF WE ARE 50% CORRECT WITH RISK REWARD RATIO 1:2
Indix VIX further jumped up by 4.12% from 18.29 to 19.04. Dow Jones is down 494 points and Nasdaq is down by 287 points at this point of time. Please do check closing data for tomorrow's trading reference. US DOLLAR INDEX has up beyond 108 level and continuous weakness in Rupee is certainly not a good sign for Indian market.
Nifty closed below 20 EMA and VWAP level. We had a highly volatile day. PCR shifted down to 0.6 which is clearly in bearish zone now. Today also selling was quite sharp .
Highest open interest on call side at 18000.
Highest open interest on put side at 17000.
FIIs, DIIs & OTHER PARTICIPANTS DERIVATIVE DATA ANALYSIS:
FIIs ( Bearish ):
FII sold in cash market for -454 crores and bought in derivative market contract for 3319 crores (please do continue to read about whether they bought calls to add new long positions or bought puts to add more short positions in the system). FIIs significantly reduced their long as well as short contract in Index future and added short stock future contracts. FIIs took long positions in calls. FIIs significantly added two times PUT long positions in Index compare to short positions. FIIs are heavily short in stock futures and hedged their positions using call & put options.
DIIs (Mild Bullish ):
DII sold in cash for -85 Crores. DIIs have reduced their positions in Index & future contracts.
PRO ( Bearish ):
Pro traders have reduced their long index & stock future contracts and heavily wrote call options in index & stocks.
CLIENT ( Bullish ):
Retail traders significantly reduced their long future contract positions in index & stocks. Heavily wrote call options in index, bought puts & calls hedge their position
Overall, shall we continue to expect high volatility for next few days?
Shall we look for sell on rise opportunities based negative cues? or
Is market is taking few steps back for bigger move towards all time high?
We are getting close to important support level . Please do watch it carefully to avoid getting into bears trap at lower levels & bulls trap on bounces.
PLEASE DO SHARE YOUR FEEDBACKS AS WELL AND TRADE SAFELY & CAREFULLY WITH STRICT SL (STOP LOSS) & MAXIMISE YOUR PROFIT USING TRAILING SL.
Have a happy, healthy & profitable day ahead!
Optiontrading

Bank Nifty Index Levels for 23/08/2022Dear traders, I have identified chart levels based on my analysis, major support and resistance levels. Please note that I am not a SEBI registered member. Information shared for educational purpose. Please do take trade based on your own analysis and risk-taking abilities. Never ever worked with fixed mindset. Any news/result data may change the direction of the trend instantly. Focus on learning so you can take correct/better decision based on your analytical skills. PLEASE NOTE THAT NO ONE CAN BE 100% CORRECT. OVERALL, WE SHOULD CONTINUE TO LEARN & BE ABLE TO CLOSE IN PROFIT EVEN IF WE ARE 50% CORRECT WITH RISK REWARD RATIO 1:2
Indix VIX further jumped up by 4.12% from 18.29 to 19.04. Dow Jones is down 494 points and Nasdaq is down by 287 points at this point of time. Please do check closing data for tomorrow's trading reference. US DOLLAR INDEX has up beyond 108 level and continuous weakness in Rupee is certainly not a good sign for Banking sector as a whole.
Bank Nifty closed below 20 EMA and VWAP level. We had a highly volatile day. PCR shifted down from 0.67 to 0.61 which is clearly in bearish zone now. Today also selling was quite sharp .
Highest open interest on call side at 39500.
Highest open interest on put side at 37000.
FIIs, DIIs & OTHER PARTICIPANTS DERIVATIVE DATA ANALYSIS:
FIIs (Bearish):
FII sold in cash market for -454 crores and bought in derivative market contract for 3319 crores (please do continue to read about whether they bought calls to add new long positions or bought puts to add more short positions in the system). FIIs significantly reduced their long as well as short contract in Index future and added short stock future contracts. FIIs took long positions in calls. FIIs significantly added two times PUT long positions in Index compare to short positions. FIIs are heavily short in stock futures and hedged their positions using call & put options.
DIIs (Mild Bullish):
DII sold in cash for -85 Crores. DIIs have reduced their positions in Index & future contracts.
PRO (Bearish):
Pro traders have reduced their long index & stock future contracts and heavily wrote call options in index & stocks.
CLIENT (Bullish):
Retail traders significantly reduced their long future contract positions in index & stocks. Heavily wrote call options in index, bought puts & calls hedge their position
Overall, shall we continue expect high volatility in coming week?
Shall we look for sell on rise opportunities based negative cues? or
Is market is taking few steps back for bigger move towards all time high?
We are getting close to important support level. Please do watch it carefully to avoid getting into bears trap & bulls trap in bounces.
PLEASE DO SHARE YOUR FEEDBACKS AS WELL AND TRADE SAFELY & CAREFULLY WITH STRICT SL (STOP LOSS) & MAXIMISE YOUR PROFIT USING TRAILING SL.
Have a happy, healthy & profitable day ahead!

AMD Advanced Micro Devices Options Ahead Of EarningsLooking at the AMD Advanced Micro Devices options chain, i would buy the $110 calls with
2022-9-16 expiration date for about
$1.54 premium.
Looking forward to read your opinion about it.

Nifty 50, 15th July 2022. Analysis for tomorrow. Updated levels for tomorrow in 15 mins time frame. Nifty has formed a Channel Pattern on 15 minutes chart and 1 hour chart also.

Banknifty 15th July 2022. Analysis For Tomorrow.Banknifty, 15th July 2022 updated chart levels for tomorrow in 15 min timeframe.

NIFTY Options 13 July 2022Entered after formation of Evening Star at resistance in 5min timeframe. Exited at support zone.
50 points captured in Nifty 16100 PE from 75 to 125.

Important Nifty LevelsImportant Nifty Levels for 14th July 2022 expiry
Looking at the charts and OI data, the expiry seems to be in range of 15900-16500, with 16K and 16.5K acting as key support and resistance levels respectively.

SPY Calls Looking for spy to break 407 resistance, once this occurs I believe we will see a move towards 409-412.

Iron Condor IBM 13 May 2022IBM 13 May 2022
The current implied volatility is at 32.77%/year
So that converted into daily is 2.06%
Since we are in need of the open price for the highest accuracy, I am going to take the current price
which is 133.7 (you can also wait for the opening price and take +- 2.75 points from the open candle value)
So based on that our channel for today is going to be compressed with a probability chance of 90% within
TOP 136.5
BOT 131
From fundamental point, today we have no big volatility news that can impact our asset.
At the same time the current values are expected to be sidemarket/bullish.

Iron Condor DIA 13 May 2022DIA 13 May 2022
The current implied volatility is at 24.22%/year
So that converted into daily is 1.52%
Since we are in need of the open price for the highest accuracy, I am going to take the current price
which is 320.6(you can also wait for the opening price and take +- 5 points from the open candle value)
So based on that our channel for today is going to be compressed with a probability chance of 85% within
TOP 325.5
BOT 315.5
From fundamental point, today we have no big volatility news that can impact our asset.
At the same time the current values are expected to be sidemarket/bullish.
At the same the weekly expected channel top and bot values for DIA were
TOP 335
BOT 314

Iron Condor SPY 13 May 2022SPY 13 May 2022
The current implied volatility is at 33%/year
So that converted into daily is 2.08%
Since we are in need of the open price for the highest accuracy, I am going to take the current price
which is 398(you can also wait for the opening price and take +- 8.1 points from the open candle value)
So based on that our channel for today is going to be compressed with a probability chance of 85% within
TOP 406
BOT 390
From fundamental point, today we have no big volatility news that can impact our asset.
At the same time the current values are expected to be sidemarket/bullish.
At the same the weekly expected channel top and bot values for SPY were
TOP 423
BOT 386

Key points Iron Condor ES/SPX 09 May 2022Current expected movement from IV = 2.08%
At the same tim we estimate with a 80.2% confidence that the volatility for today is going to be below 1.97% for this the market will stay within
TOP 4167
BOT 4006
All of this being calculated with the opening value candle of today
From the fundamental point of view we have not big volatility news today
With all of this in mind, we can try a scalp entry for today with the next setup
Iron Condor for 0 DTE ES
Call Sell 4160
Call Buy 4185
Put Sell 4010
Put Buy 3985
This would give us an expectency of 0.41$ per each 1$ lost
At the same time we have a 80.2% probability so 80.2% * 0.41$ - 20%*1$ = 12.88$ ROI after 100 trades

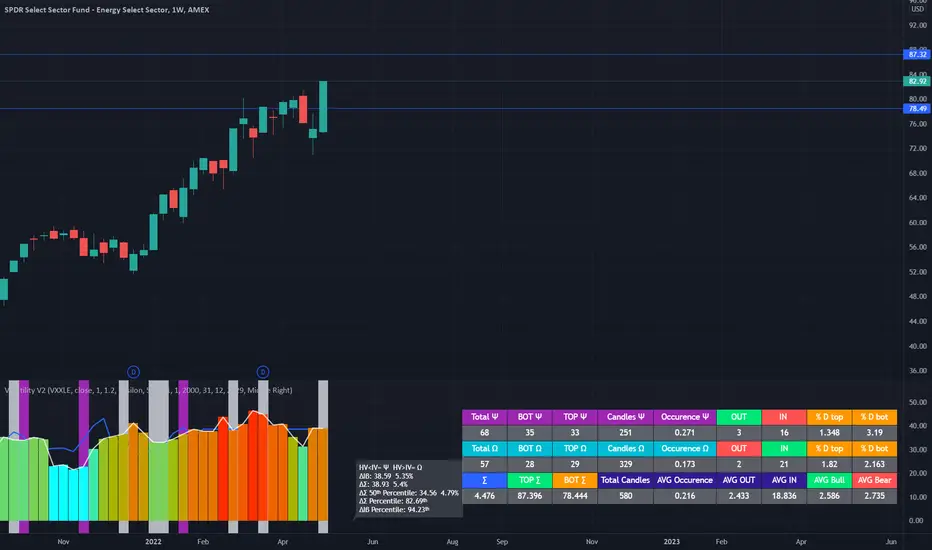
Weekly Prediction 9-13 May XLEXLE Energy Sector
9 - 13 May
The weekly VXXLE> Volatility Index for XLE Energy Sector
Implied = 38.6
In this we have to standard it for weekly session
38.6 / sqrt(52-> 52 weeks in a year) = 5.35%
My historical product is telling me with 1.2x coficient that the expected movement for this week
E Volatility = 38.93 / sqrt(52) = 5.4%
With this data, from my calculations, when EV > VIX, there were a 82.7% chance that the market
stay within the bottom and top created with the ranged from the E Vol
So for next week this range for us is going to be
TOP - 87.4
BOT - 78.5
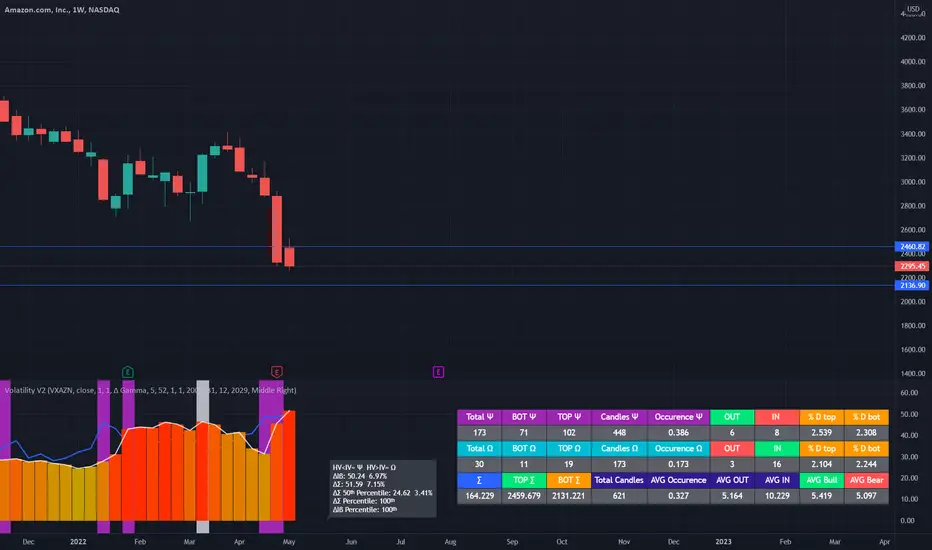
Weekly Prediction 9-13 May Amazon AMAZON
9 - 13 May
The weekly VXAZN-> Volatility Index for AMAZON
Implied = 50.24
In this we have to standard it for weekly session
39.02 / sqrt(52-> 52 weeks in a year) = 6.97%
My historical product is telling me with 1x coficient that the expected movement for this week
E Volatility = 51.59 / sqrt(52) = 7.15%
With this data, from my calculations, when EV > VIX, there were a 83% chance that the market
stay within the bottom and top created with the ranged from the E Vol
So for next week this range for us is going to be
TOP - 2460
BOT - 2131
Short Iron Condor QQQ 06 May 2022We can estimate with a 81% confidence that the volatility for today is going to be above 0.64%
For this the market will stay above TOP 315 or below BOT 311
From the fundamental point of view for today we have 2 big volatility news:
NFP
Unemployment
Both of them are expected to be lower values than last month -> bearish .
With this in mind, I suggest a SHORT IRON CONDOR
BUY CALL 315
SELL CALL 318 or other value(higher than 315)
BUY PUT 311
SHORT PUT 308or other value(lower than 311)

Short Iron Condor SPY 06 May 2022We can estimate with a 81% confidence that the volatility for today is going to be above 0.46%
For this the market will stay above TOP 415 or below BOT 412
From the fundamental point of view for today we have 2 big volatility news:
NFP
Unemployment
Both of them are expected to be lower values than last month -> bearish .
With this in mind, I suggest a SHORT IRON CONDOR
BUY CALL 416
SELL CALL 419 or other value(higher than 416)
BUY PUT 412
SHORT PUT 409 or other value(lower than 412)

Short and Long Iron Condor QQQ 05 May 2022We can estimate with a 79% confidence that the volatility for today is going to be below 2.24%
For this the market will stay within
TOP 337
BOT 322
At the same time We can estimate with a 86% confidence that the volatility for today is going move more than
0.41%
For this the market will stay above the
TOP 331
BOT 328
From the fundamental point of view, yesterday we had the release of the interest rates, so I believe currently we are in a short relief moment, where we can have for some days/weeks a small bull trend
For today we have no big volatility news, so we cant expect big surprises.
Having said that we have 2 different ways of trading for today
IRON CONDOR for the first option, with the 337sell 340buy Call / 322sell 319buy Put
Reverse IRON CONDOR for the second option with 330buy 333sell Call/ 328buy 325sell Put

Short and Long Iron Condor SPY 05 May 2022We can estimate with a 86.4% confidence that the volatility for today is going to be below 1.75%
For this the market will stay within
TOP 436.6
BOT 421.5
At the same time We can estimate with a 86% confidence that the volatility for today is going move more than
0.33%
For this the market will stay above the
TOP 430.4
BOT 427.6
From the fundamental point of view, yesterday we had the release of the interest rates, so I believe currently
we are in a short relief moment, where we can have for some days/weeks a small bull trend
For today we have no big volatility news, so we cant expect big surprises.
Having said that we have 2 different ways of trading for today
IRON CONDOR for the first option, with the 436sell 439buy Call / 421sell 418buy Put
Reverse IRON CONDOR for the second option wiht 430buy 433sell Call/ 427buy 424sell PUT

$CPB Long IdeaCPB had some sweeps and block call flows yesterday and the cart looks good IMO with a nice gap above, strength and volume uptick.
Trader went 5/6 48 calls 300K premium and 5/20 call sweeps 48/49 strike.
I like more time, so I'm long 5/20 49 calls, swinging and singing baby
Target would be gap close 48.78 but will start trimming calls on the way .
Cheers

Call Option Setup *ATER*Speculating that ATER will break 5.20 resistance and move up towards $6 a share. Im looking to buy a $5 call option expiring 4/29. A perfect wedge is being set up, good buy oppurtunity in my eyes.

Nifty Setup for 11th March 2022Bullish Flag formed.
However, major resistance near 16750 zone.
Good Breakout is possible if market sustain over 16500, otherwise expect sideways to bearish movement.

#Banknifty By @ayushsaini123#We make Only Profit...
# level is to important in Banknifty .
#i will tell all level in my Friday Video.

AAPL Weekly Option Swing TradeTECHNICAL:
- Symmetrical Triangle Formation
- Wait for breakout or enter now ( higher risk )
- Double Bottom Formation
- Bullish
- MACD Cross
- RSI low
- More room for volatility
NEWS RELATED:
- Ukraine & Russia will be having a discussion (positive)
- Market may relax w/ panic selling
- War may calm down soon
THE PLAY:
- March 04 Calls
- Monthly Long Calls
- im new to charting so please critique me :)
