Optimism Op price analysis - be careful After the listing of #OP on the Korean exchange, known for its "pump events", we observe a surge in volume along with a breakout from the downtrend.
🐻 The current 6-hour candle on OKX:OPUSDT is attempting to form a pin bar — a potential reversal signal.
⚠️ High volumes often indicate the final phase of a move. Such pumps are usually short-lived — proceed with caution.
👌 Our previously published medium-term forecast for #Optimism remains relevant
________________
📚 Follow us ❤️ for daily crypto insights & updates!
🚀 Don’t miss out on important market moves!
OPUSD

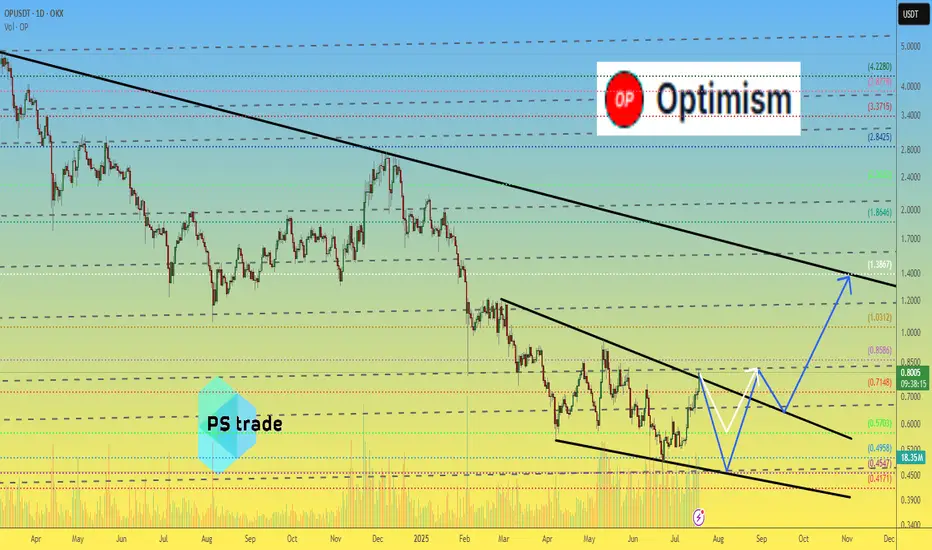
Optimism OP price analysisCurrently, the price of #OP does not look very optimistic (a little pun to start with )))
🟢 An optimistic forecast would be for the price of OKX:OPUSDT to rise to $1.40
🟡 But it looks like this growth will not happen now, but after a correction.
🔴 Correction: only to $0.57 or again to $0.45 — this is also an open question.
👌 Patience to holders and fans of the #Optimism project, the “microclimate” in the crypto market is improving — the time will come, and this coin will also be pumping...
_____________________
Did you like our analysis? Leave a comment, like, and follow to get more
OP/USDT Weekly Reversal Zone: Strong Bounce ExpectedThe OP/USDT pair is currently showing strong signs of a potential trend reversal from a major long-term demand zone.
📊 Timeframe: 1W (Weekly)
🟨 Key Support Zone: 0.396 – 0.542 USDT
The price has revisited a historically strong support area that previously served as an accumulation zone since mid-2022. The recent bounce from this level reinforces the likelihood of a bullish reversal.
📈 Upside Targets (Resistance Levels):
1. Minor Resistances:
0.699
0.844
2. Mid-Term Target:
1.190 (key breakout confirmation level)
3. Long-Term Bullish Targets:
2.168
2.400
2.700
2.991
3.725
4.020
4.538
4.865 (Previous major high)
🛡️ Critical Demand Zone:
As long as price holds above the 0.396–0.542 range, bullish structure remains intact. A breakdown below this range could invalidate the setup.
🔄 Outlook:
The chart pattern suggests the formation of a higher low and a potential breakout in stages, supported by volume and positive sentiment. Watch the 0.699 and 0.844 levels for initial confirmation of buyer strength.
📌 Note:
This setup offers an attractive risk-reward ratio for mid to long-term traders watching for a trend reversal.

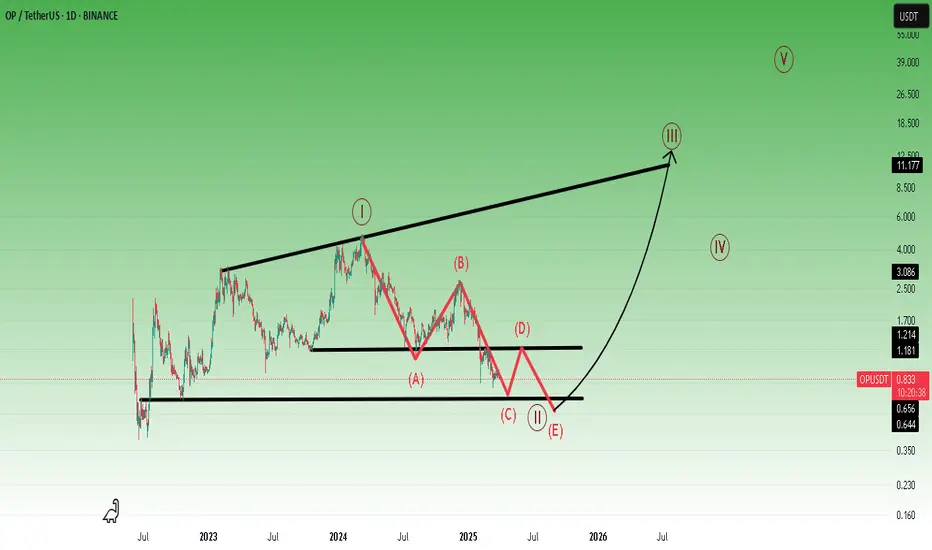
OP Roadmap (3D)The OP token has entered a bearish phase after completing a triangle pattern. We are currently in this bearish phase.
Such large bearish phases typically require a sweep of liquidity from key levels before ending. It appears that OP, after sweeping the liquidity below support levels, may reverse and enter a bullish phase.
The targets have been marked on the chart.
A daily candle close below the invalidation level will invalidate this analysis.
For risk management, please don't forget stop loss and capital management
Comment if you have any questions
Thank You

OPUSDT 1W AnalysisOP ~ 1W Analysis
#OP Buy back gradually from here, this is the lowest support block for now with a short term target of at least 20%+ from here.

Don't miss today's signal.Hello friends
Based on the extensive and comprehensive analysis we conducted, we were able to obtain the buying points and targets for this currency for you so that you can buy in stages with risk and capital management.
*Trade safely with us*

OPUSDT 1D AnalysisOP ~ 1D Analysis
#OP Buy in stages from here with a short term target of at least 15%+ and a long term target of $2.7

#OP/USDT#OP
The price is moving within a descending channel on the 1-hour frame and is expected to continue upward.
We have a trend to stabilize above the 100 moving average once again.
We have a downtrend on the RSI indicator, which supports the upward move by breaking it upward.
We have a support area at the lower limit of the channel at 0.817.
Entry price: 0.860
First target: 0.891
Second target: 0.916
Third target: 0.950

OPUSDT 1D AnalysisOP ~ 1D Analysis
#OP Buy after successfully penetrating this resistant line with a short -term target of at least 15%+ from here.

OPUSDT 3D AnalysisOP ~ 3D Analysis
#OP Buy gradually from here if you still have a Conviction on this coin with a short -term target of at least 15%+ from here.

OP Secondary trend. Wedge. Reversal zones. 17 04 2025From the wedge breakout, the price reached the level of 2.857 (81%) and from it the trend reversal under the general trend of altcoins, breaking through the "neck" zone of the head and shoulders, thereby realizing this pattern on a large scale and reaching the reversal zone of the minimums of the level of 0.509. We went down to the range below along the fan. Consolidation above the dynamic support opens up the potential for movement to its resistance, I specifically put another meridian, as from it with a high degree of probability, even with the implementation of the bullish potential, there will be a significant pump / dump rollback. It just intersects with the previous consolidation of support, which in this case acts as resistance (those who previously bought in this zone will sell, thereby going into breakeven and stimulating the stop of the impulse and a rollback (logical probability).
Locally, again having formed on the fall, as before, a descending wedge in the secondary trend. It has not yet been fully formed, the price is not clamped. But, conditionally, the price is at the minimum zone. You can start gaining from the average price, or work on a breakthrough of the formation, observing risk and money management. If you are scared (it is always like this at the minimum zone) - then everyone is the same, and most refuse to buy, but willingly buy when the price is already expensive.
A breakthrough of this wedge is a corrective upward movement to the mirror resistance zone of the previous consolidation (highlighted in gray), if in general, a "revival of faith" is observed in alts.
Also after breakout of the wedge, if the market as a whole is bearish on alts, then they will make a cut (in this case, a repeated set) at the zone of minimums in a wide range of price slippage and the complete death of faith in the candy wrapper of "crypto whales", highlighted in green.

OP/USDT Major trend. 07 2024Logarithm. Time Frame 1 week. After the listing there were 3 cyclical pumping of the “participation” phase. PR, hype, connection of the majority in mass media. The reversal occurred with a typical breakout in the secondary trend of a triangle (first pumping) or a wedge (second pumping). Now the third wedge is forming, the price is near the dynamic Gann support (reaction from it), but still in the range of the descending wedge pattern.
On a line chart (liquidity, no slippage) the declines are cyclical at -63% each time according to the algorithm. Each successive top +55% of the previous secondary trend.
It is quite possible that something similar will happen again this time (not necessarily), but only ideally after holding dynamic fan support and breaking wedge resistance. I have purposely shown only medium-term targets after a trend break.
Gann's trend fan is plotted on the chart, i.e. dynamic support/resistance areas for the future.
Optimism customization - L2's blockchain scaling solution ETH Crypto funds have invested a total of $267 million.
Secondary trend Time frame 3 days

OP/USDT Secondary trend. Wedge. Pivot zones. 27 07 2024OP/USDT Secondary trend. Wedge. Pivot zones. 27 07 2024
Logarithm. Time frame 3 days. A descending wedge is forming. The price is near the dynamic Gann support (reaction from it), but still in the range of the descending wedge pattern. The reaction in this resistance zone will determine the trend for the near future.
On the chart, I have specifically shown the minimum percentages of the two key reversal zones for the trend to local resistance levels, for the potential of option A and B.
Major trend.
OP/USDT Major trend. 07 2024 Time frame 1 week.

I am very optimistic about Optimisim in the long term.But first, let's go a little deeper.
* What i share here is not an investment advice. Please do your own research before investing in any asset.
* Never take my personal opinions as investment advice, you may lose all your money.
OPUSDT 4DOP ~ 4D Analysis
#OP Place two purchases at this support level, with a short -term target of at least 20%+.
This is a key support that needs attention.

OP Low Resistance liquidity run ! First of all We have low resistance liquidity . we are expecting price to reach our mid term liquidity
In other hand if we run through that sibi that means we have strong bullish trend
Keep it simple just like that

OP/USD. It's time to RETURN! Technical analysis from 27.01.25Hello everyone, dear friends!
While bitcoin is holding in the phase of uncertainty, I suggest to consider the Op/Usd pair.
The price has been trading in a wedge structure for a long time, having formed a divergence. The spring is compressed for a long time and at the current moment I expect a breakdown on volume of the upper boundary of the triangle. Targets, entry point and stop loss are indicated on the chart.
From the recent:
Ldo from January 19:
Current picture:
Want more and, most importantly, for free, write in private messages, I will give access because here is forbidden advertising of third-party links.
Happy bidding!

Can #OP Bulls Defend this Key Levels or Not? Key Levels to WatchYello, Paradisers! Will #OPUSDT finally break free or are we about to see a deeper pullback? Let’s analyze the current #Optimism setup:
💎#OP is currently forming an ascending broadening wedge pattern, which often signals indecision but can result in a strong breakout or breakdown. The price is approaching a key resistance zone at $2.191, a level it must break decisively for bullish momentum to continue.
💎A confirmed daily close above this resistance would open the door for a rally toward the major resistance area between $2.800 and $3.000, where significant selling pressure could emerge. For this move to sustain, watch for strong volume and momentum to validate the breakout.
💎On the downside, #OPUSD is leaning heavily on the ascending support near $1.791, with a broader support zone sitting between $1.584 and $1.300. This area has proven to be a reliable base during recent declines, providing the liquidity needed for buyers to defend the trend.
💎However, if NASDAQ:OP closes a daily candle below $1.300, the bullish structure will break down, likely leading to a deeper retracement toward $1.000 or lower levels, signaling a shift in market sentiment.
Stay focused, patient, and disciplined, Paradisers🥂
MyCryptoParadise
iFeel the success🌴

OPUSDT 5DOP ~ 5D
#OP If you still have Conviction on the coin,. Buy gradually within this support block,. with a minimum target of 20++

op idea"🌟 Welcome to Golden Candle! 🌟
We're a team of 📈 passionate traders 📉 who love sharing our 🔍 technical analysis insights 🔎 with the TradingView community. 🌎
Our goal is to provide 💡 valuable perspectives 💡 on market trends and patterns, but 🚫 please note that our analyses are not intended as buy or sell recommendations. 🚫
Instead, they reflect our own 💭 personal attitudes and thoughts. 💭
Follow along and 📚 learn 📚 from our analyses! 📊💡"

Optimism OP price analysis#OP price has stopped before a strong mirror level of $2.85-3
📊 For confident growth to continue, the OKX:OPUSDT needs to consolidate above this mirror level.
1️⃣ Local target - $3.30
2️⃣ Medium-term - $4.20-4.30
_____________________
Did you like our analysis? Leave a comment, like, and follow to get more

OPUSDT - potential project ... Great targetsWeekly chart displays :
- Consolidation a massive Ascending channel since 870days
-breakout the double bottom pattern
- breakout , retest of the 0.5 fibo level
OP has strong project 8$ is my midterm target
Best regards Ceciliones 🎯

OP is bullish (1D)On the chart, we have both a bullish iCH and a bullish QM.
If the price returns to the bottom, we are looking for buy/long in the specified range of ENTRY.
Closing a daily candle below the invalidation level will violate this analysis
Do not enter the position without capital management and stop setting
Comment if you have any questions
thank you
