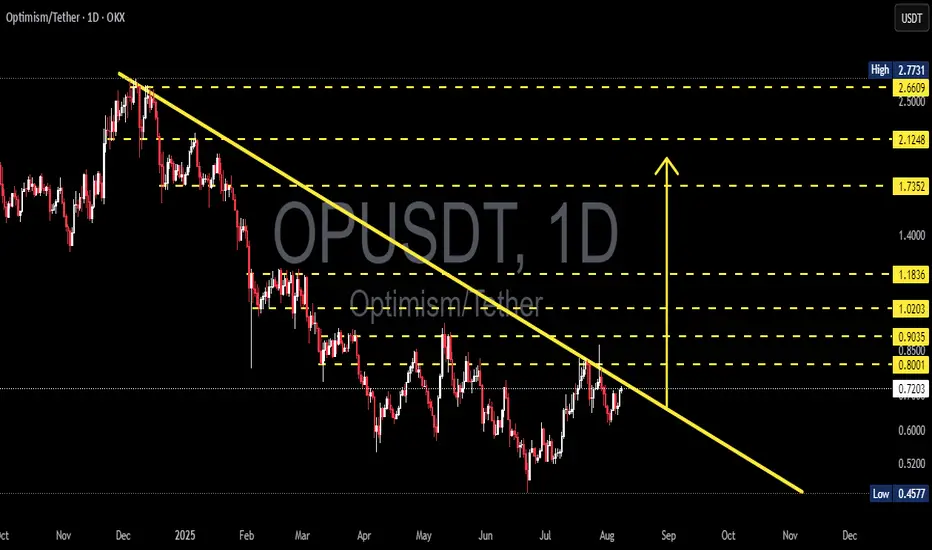
OP/USDT Technical Analysis – Approaching a Major Breakout Zone!Chart Overview: The OP/USDT pair on the 1D (Daily) timeframe is currently moving within a long-term descending trendline, forming a descending triangle or falling resistance channel since November 2024. The price is now approaching a critical point near the long-term resistance trendline (yellow line), which has been tested multiple times.
---
🟢 Bullish Scenario: Breakout Potential
If the price manages to break and close above the descending trendline resistance (currently near the $0.80–$0.85 zone), it would signal a strong bullish breakout. The next key resistance levels to watch (based on yellow dotted horizontal lines) are:
1. $0.9035 – minor resistance
2. $1.0203 – psychological level
3. $1.1836 – mid-term strong resistance
4. $1.7352 and $2.1248 – extended bullish targets
A confirmed breakout would ideally be supported by increasing volume and RSI momentum above 50.
---
🔴 Bearish Scenario: Rejection at Resistance
If the price fails to break the trendline and gets rejected, a downside move is likely to follow. Key support levels to watch are:
1. $0.7200 – current support
2. $0.6000 – minor support
3. $0.4577 – strong historical support (lowest level)
This would suggest continued bearish control and could extend the downtrend that has lasted over 8 months.
---
📊 Pattern Breakdown: Descending Trendline
Consistent lower highs since the peak near $2.77
The descending trendline is the main battle zone between bulls and bears
This pattern often leads to a breakout if buyers gain momentum
---
🎯 Conclusion & Strategy:
This is a critical zone for OP/USDT.
Traders should wait for breakout confirmation before entering long positions.
For breakout traders: consider a buy-the-breakout strategy with stop-loss below the trendline.
For short sellers: look for a rejection at resistance with targets at the nearest support levels.
#OPUSDT #CryptoAnalysis #Altcoins #TechnicalAnalysis #BreakoutTrade #Optimism #CryptoSetup #BullishScenario #BearishScenario #ChartPatterns
Opusdlong
OPUSDT 1D AnalysisOP ~ 1D Analysis
#OP Buy after successfully penetrating this resistant line with a short -term target of at least 15%+ from here.

OPUSDT 3D AnalysisOP ~ 3D Analysis
#OP Buy gradually from here if you still have a Conviction on this coin with a short -term target of at least 15%+ from here.

OPUSDT 4DOP ~ 4D Analysis
#OP Place two purchases at this support level, with a short -term target of at least 20%+.
This is a key support that needs attention.

OPUSDTOP ~ 2D
#OP Buy after breaking the resistance of this descending pattern or buy at the demand zone. Target 20%++

OPUSDTOP ~ 1D
#OP Make purchases gradually after breaking through the resistance line of this descending pattern.

OP potentially increase by 50%1D time frame
-
OP created a resistance structure before.
There is also the target to close long.
Target: 2
SL: 1.25

OPUSDT +50% moveI predicted OPUSDT coin an a 80% market move for not more than a two months I trade futures so guess what i earned a lot from this coin.
* This coin follows the market conditions and It's one of the top coins that i like to trade!
!!! TRADE IT ON YOUR OWN RISK!!!

OP at least a minor move up (Scalp LONG)After a strong comeback from a key area, I expect a correction validating the change of character and a move up from there!
NFA

OP Long Entry Setup (High Probability)I expect OP to get to the highlighted demand zone area in order for a reversal.
NFA

OPUSDT - Buy Setup!!OPUSDT (1D Chart) Technical analysis
OPUSDT (1D Chart) Currently trading at $2.56
Buy level: Above $2.55
Stop loss: Below $2.15
TP1: $2.9
TP2: $3.25
TP3: $ 4
TP4: $ 5
Max Leverage 2x
Always keep Stop loss
Follow Our Tradingview Account for More Technical Analysis Updates, | Like, Share and Comment Your thoughts

OP ready to fly!After quite some downtrend and getting stuck in a triangle I expect the triangle to break downward which will most probably be a false breakout since it's an area of liquidity and start flying from the area that I highlighted which happens to be the entry price for the breakout signal!
NFA

OP BullishOP leading L2! Buy only on spot! I expect big pump on this coin! Check my other analysis and if you agree with me give me like !

OPUSDT - Buy Setup!!OPUSDT (4h Chart) Technical analysis
OPUSDT (4h Chart) Currently trading at $0.95
Buy level: Above $0.95
Stop loss: Below $0.88
TP1: $0.98
TP2: $1
TP3: $1.12
TP4: $1.2
Max Leverage 3x
Always keep Stop loss
Follow Our Tradingview Account for More Technical Analysis Updates, | Like, Share and Comment Your thoughts

OPUSDT OP USDT
As for us op, we notice that we have a right shoulder, a head, and a left shoulder, so I see BINANCE:OPUSDT that all goals have been achieved.
Greetings

OP ready to fly!!!After a very deep pullback and a bullish reversal, I expect a strong move up from here! (High-Quality Trade)
NFA

OP Getting ready to start a move up againAfter some correction looks like OP is done with the correction after getting to its strong support area (1.32- 1.37) and most likely this will be a MTR from here!
NFA

OP looking bullish again (Long)After some time inside a pullback looks like the pullback is acting as a bull flag and based on the increase in buy pressure as well as a wedge and another nested wedge inside a triangle I expect the price to rally from here!
NFA
