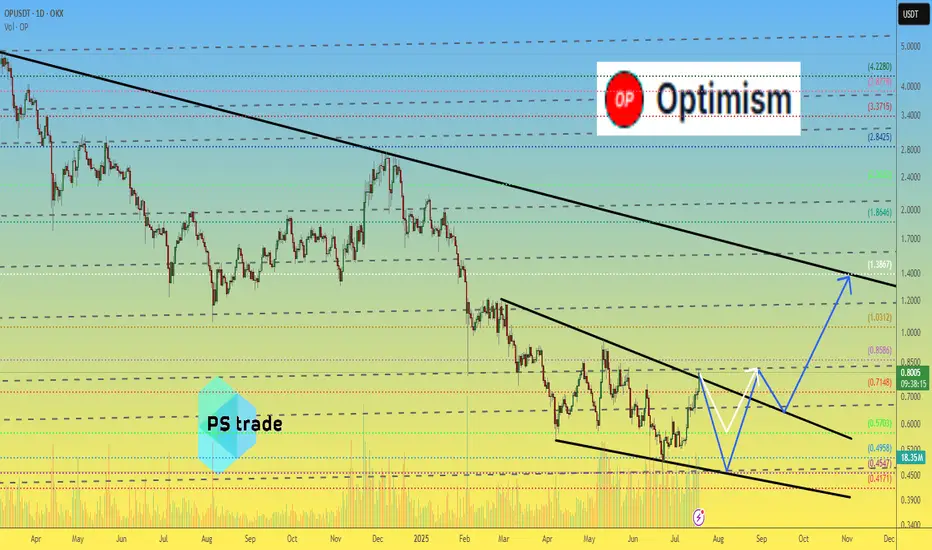
Optimism OP price analysisCurrently, the price of #OP does not look very optimistic (a little pun to start with )))
🟢 An optimistic forecast would be for the price of OKX:OPUSDT to rise to $1.40
🟡 But it looks like this growth will not happen now, but after a correction.
🔴 Correction: only to $0.57 or again to $0.45 — this is also an open question.
👌 Patience to holders and fans of the #Optimism project, the “microclimate” in the crypto market is improving — the time will come, and this coin will also be pumping...
_____________________
Did you like our analysis? Leave a comment, like, and follow to get more
OPUSDT
OPUSDT Update
Symbol: OP/USDT
Timeframe: Daily
Chart Analysis:
The price is currently approaching a key resistance zone at around 0.673, as seen in the chart. A descending trendline from May to June has been acting as resistance. The price has recently made a strong move towards this resistance zone, showing a potential breakout pattern.
If the price successfully breaks above the 0.673 resistance, we could see a bullish continuation towards the next resistance levels, potentially up to 0.700 or higher. The breakout would suggest a reversal of the prior downtrend.
Key Levels:
* Resistance: 0.673 (current resistance zone)
* Support: 0.600 (lower support area)
Trade Strategy:
1. Long Entry: Consider entering a long position if the price breaks above the 0.673 resistance with strong volume.
2. Target: A reasonable target could be the 0.700 region. Keep an eye on price action as it approaches this level.
3. Stop Loss: Place a stop loss below the 0.600 support to manage risk in case of a failed breakout.
Risk-Reward: A potential reward-to-risk ratio of 2:1 or better, depending on entry and exit points.
Conclusion:
Monitor the price closely for a breakout above the 0.673 level. If it breaks and sustains, a bullish move could follow. Watch for volume confirmation and market momentum to gauge the strength of the breakout.

OPUSDT Forming Falling ChannelOPUSDT is currently exhibiting a promising setup that could lead to a significant bullish move. The chart shows that the price has broken out of a well-defined falling channel pattern, which often signals the end of a correction phase and the beginning of a potential uptrend. With the breakout confirmed and good volume supporting this move, there is a strong possibility of a 90% to 100% gain in the coming sessions, drawing the attention of traders looking for breakout plays.
Optimism (OP) has been a hot topic within the crypto community due to its role in scaling Ethereum through its layer 2 solution. The consistent development and growing adoption of the Optimism network have sparked investor interest, providing a fundamental backdrop that complements the bullish technical signals. Many traders see this breakout as an opportunity to get in early on a potential recovery rally.
The current price action suggests that OPUSDT may continue its upward trajectory if buying pressure remains strong and key resistance levels are cleared convincingly. Traders should watch for sustained volume spikes and possible retests of the breakout level, which can offer more confidence in the continuation of the bullish momentum. As always, risk management is essential when navigating such moves.
✅ Show your support by hitting the like button and
✅ Leaving a comment below! (What is You opinion about this Coin)
Your feedback and engagement keep me inspired to share more insightful market analysis with you!

Optimism Extreme BUY: Easy 1277% Profits Potential—Can Go HigherOptimism is now moving within a "extreme BUY" zone. This is a price zone that was active only once between June and July 2022, one month only and then OPUSDT went on a massive rally. Total growth amounting to more than 1,111% from bottom to top.
This zone has been activated again for a little over one month and I believe it won't remain valid much longer. There is room for a new wave of growth but this time much more than 1,111%.
The target shown on the chart is a good one but I believe this trading pair/Cryptocurrency project can go higher when all is said and done.
Technical analysis —Bullish based on price action
On the 16-June week, 22-June specifically, Optimism (OPUSDT) hit its lowest price yet. 0.457. This is just a bit higher compared to the all-time low June 2022 at 0.396. We can easily say the bottom is in as this week the action is back above its 7-April 2025 low.
Higher targets
The next high target sits at $12, giving us a 2,078% potential for profits from current price. 0.551 at the time of writing.
Previous cycle vs current cycle
Optimism's first bullish cycle lasted 630 days. The next cycle, the one that is about to start now, can last an entire year, eight months... We are entering uncharted territory so it is hard to say.
One thing I can say based on TA is that this new wave will be much more steep compared to the last one. The climb will be really fast, it will be hard to adapt.
How to trade to maximize profits
The best way to approach this pair for sure success is by buying when prices are low, now. This would secure a smooth ride and happy profits on the way up.
If you are reading this now, your timing is awesome because we are looking at a bottom catch, this type of opportunity is only seen once every several years. For example, the last time OPUSDT traded this low was in mid-2022, three years ago. Once the bullish wave takes off, there is no going back. Once the bulls are in, low prices will be forever gone.
Thanks a lot for your continued support.
Namaste.

OPUSDT: Buyers try to regain control inside the rangeHi traders and investors!
On the daily timeframe, OPUSDT is trading in a sideways range. The price has repeatedly dipped below the lower boundary at 0.545, but each time, buyers managed to bring it back.
Now, we’re seeing another attempt to return into the consolidation zone — a possible sign of renewed buyer initiative.
If the price secures above 0.545, the path opens toward the next targets at 0.844 and 0.954. However, a short-term dip below 0.52 may occur within this bullish scenario.
Therefore, buying becomes a priority once the price is firmly back above 0.545.
This analysis is based on the Initiative Analysis concept (IA).
Wishing you profitable trades!

OPUSDT Forming Descending ChannelOPUSDT is showing an impressive technical setup that has caught the attention of many crypto traders recently. The chart reflects a well-formed descending channel, which is a classic bullish reversal pattern when broken to the upside. Currently, the price action is testing the upper boundary of this channel with increasing buying pressure, signaling that a potential breakout could be on the horizon. A successful breakout here, supported by good volume, could trigger a strong rally in the coming sessions.
The volume profile for OPUSDT is encouraging, as it suggests that more investors are accumulating positions in anticipation of this move. This aligns with the optimistic sentiment in the broader crypto market, where traders are actively seeking altcoins with high potential upside. With an expected gain of around 80% to 90%+, OPUSDT offers an attractive risk-to-reward ratio, especially for those who prefer swing trades and short-term position trades in trending altcoins.
One key factor to watch is whether OPUSDT can sustain momentum above the descending channel’s resistance line. If volume remains strong and the breakout confirms on higher timeframes like the daily or weekly chart, this could attract further interest from both retail and institutional traders. Such a move often sparks a chain reaction of buying, as traders look to ride the trend to its projected target zone.
Overall, the combination of a textbook pattern, healthy volume, and increasing investor interest makes OPUSDT one to watch closely. Keep it on your radar for a possible breakout play with significant upside potential. As always, manage your risk properly and wait for a confirmed breakout before entering any position.
✅ Show your support by hitting the like button and
✅ Leaving a comment below! (What is You opinion about this Coin)
Your feedback and engagement keep me inspired to share more insightful market analysis with you!


OP/USDT Weekly Reversal Zone: Strong Bounce ExpectedThe OP/USDT pair is currently showing strong signs of a potential trend reversal from a major long-term demand zone.
📊 Timeframe: 1W (Weekly)
🟨 Key Support Zone: 0.396 – 0.542 USDT
The price has revisited a historically strong support area that previously served as an accumulation zone since mid-2022. The recent bounce from this level reinforces the likelihood of a bullish reversal.
📈 Upside Targets (Resistance Levels):
1. Minor Resistances:
0.699
0.844
2. Mid-Term Target:
1.190 (key breakout confirmation level)
3. Long-Term Bullish Targets:
2.168
2.400
2.700
2.991
3.725
4.020
4.538
4.865 (Previous major high)
🛡️ Critical Demand Zone:
As long as price holds above the 0.396–0.542 range, bullish structure remains intact. A breakdown below this range could invalidate the setup.
🔄 Outlook:
The chart pattern suggests the formation of a higher low and a potential breakout in stages, supported by volume and positive sentiment. Watch the 0.699 and 0.844 levels for initial confirmation of buyer strength.
📌 Note:
This setup offers an attractive risk-reward ratio for mid to long-term traders watching for a trend reversal.

OP Roadmap (3D)The OP token has entered a bearish phase after completing a triangle pattern. We are currently in this bearish phase.
Such large bearish phases typically require a sweep of liquidity from key levels before ending. It appears that OP, after sweeping the liquidity below support levels, may reverse and enter a bullish phase.
The targets have been marked on the chart.
A daily candle close below the invalidation level will invalidate this analysis.
For risk management, please don't forget stop loss and capital management
Comment if you have any questions
Thank You

OP / USDT 4hr PUMP INCOMING? OP/USDT – 4H Chart Summary
Market Structure:
4H Timeframe:
- Price consolidating within a descending triangle/wedge pattern, indicating potential buildup before a breakout.
- Lower Timeframes (1H and below): Bearish trend structure with lower highs and lows.
- OBV (On-Balance Volume): Forming a wedge—suggesting accumulation or distribution phase nearing a breakout.
Key Zones:
Demand Zone (Support):
- 0.5483 – 0.6351
This area has provided strong support historically. A clean break below could signal continuation of the larger downtrend.
Supply Zone (Resistance):
- 0.9068 – 1.0414
-Historically rejected price; high probability of reversal or consolidation if revisited.
Fair Value Gaps (FVG):
- FVG 1: 0.6659 – 0.6838
- FVG 2: 0.7024 – 0.7308
These inefficiency zones are likely to attract price if bullish momentum builds. Watch for potential short-term rejection or continuation setups here.
Volume Profile:
Strongest volume node (high liquidity zone) sits between 0.7470 – 0.8000
Suggests this area has been heavily traded and may act as magnet/resistance if approached again.
Fibonacci Confluence:
Previous swing high at 0.8232 aligns with the 0.618–0.65 golden pocket
A critical zone for potential take-profit or trend reversal on a breakout.
Scenarios:
Bullish Case:
If price holds above 0.6351 and bounces, look for:
- Retest of FVG 1, followed by FVG 2.
- Breakthrough of 0.7308 could target the golden pocket and swing high at 0.8232.
- Sustained bullish move may reach the supply zone above 0.9068.
Bearish Case:
- Breakdown below 0.6351 and especially below 0.5483 would:
- Invalidate the wedge support.
- Confirm continuation of the macro downtrend.
-Open room for new lows and bearish expansion.
Conclusion:
Price is at a key decision point inside a wedge.
Reaction at 0.6351 is critical—support bounce targets higher inefficiencies; breakdown signals deeper bearish continuation.
OBV and volume structure suggest an imminent volatility spike—prepare for a breakout.

#OP/USDT#OP
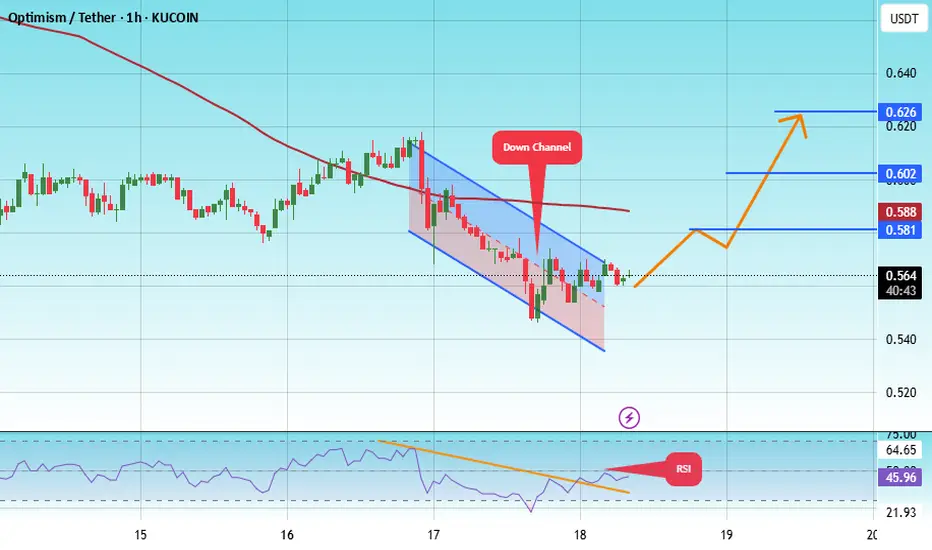
The price is moving within a descending channel on the 1-hour frame, adhering well to it, and is heading toward a strong breakout and retest.
We are experiencing a rebound from the lower boundary of the descending channel. This support is at 0.544.
We have a downtrend on the RSI indicator that is about to be broken and retested, supporting the upward trend.
We are heading toward stability above the 100 moving average.
Entry price: 0.564
First target: 0.581
Second target: 0.602
Third target: 0.626
Everyone saw the drop. I saw the gapPrice nuked — but it didn’t break structure. It filled imbalance, paused, and now it's reloading beneath a stack of untouched FVGs. This isn't capitulation. It's orchestration.
The setup:
We’ve got layered 60-minute FVGs stacked from 0.61 to 0.66. That’s the destination — not the mystery. What matters is the origin. The rejection block around 0.58–0.59 has held clean, and we now have two bullish rejection wicks off that base.
Volume surged during the sweep — and fell on the retrace. That’s not distribution. That’s Smart Money filling.
Two entries — one outcome:
Entry 1: Tap into the red demand zone, wick the 0.58–0.579 region
Entry 2: Break and retest above minor FVG (0.60 reclaim confirmation)
Either way, the draw is the inefficiency stack above.
Execution Map:
Long from 0.579–0.583
SL: Below the base at 0.574
TP1: 0.615 (lower FVG)
TP2: 0.645 (full sweep)
Final: 0.660 liquidity run
Don’t fear the compression. That’s where the trap is set.
Final thought:
“Most traders fear price going sideways. I see it as silence before the algorithm speaks.”


#OP/USDT#OP
The price is moving within a descending channel on the 1-hour frame and is expected to break and continue upward.
We have a trend to stabilize above the 100 moving average once again.
We have a downtrend on the RSI indicator that supports the upward move with a breakout.
We have a support area at the lower limit of the channel at 0.600, acting as strong support from which the price can rebound.
Entry price: 0.616
First target: 0.630
Second target: 0.641
Third target: 0.658

OPUSDT 1W AnalysisOP ~ 1W Analysis
#OP Buy back gradually from here, this is the lowest support block for now with a short term target of at least 20%+ from here.

The 2025 Bull Market: Do Not Sell Unless You See A New All-Time How long have you been in this market? You are about to embark on a journey; you are about to experience/enjoy the most sought after phase of the cryptocurrency market, the bull market.
If you've been around for less than four years, you've seen nothing like it. It will blow your mind.
You can see the numbers on the charts, past action and there you have your proof, but nothing can prepare you for the actual experience. Even if you've experienced previous bull markets, the actual event is mind-blowing. We are dying for you to try it. We cannot wait anymore... We just want you to earn, make money, share, have fun and enjoy. We, the Cryptocurrency family, deeply love you and wish for you amazing results.
Don't be shy. Do not be afraid. Buy everything up like it is the end of the world. Once bought, hold. Do not sell. I repeat, do not sell until prices are high, really high up. For example, looking at Optimism, OPUSDT, wait for a new all-time high before taking profits.
Thanks a lot for your continued support.
Leave a comment if you enjoyed the article, it will only take ten seconds.
Namaste.

Don't miss today's signal.Hello friends
Based on the extensive and comprehensive analysis we conducted, we were able to obtain the buying points and targets for this currency for you so that you can buy in stages with risk and capital management.
*Trade safely with us*

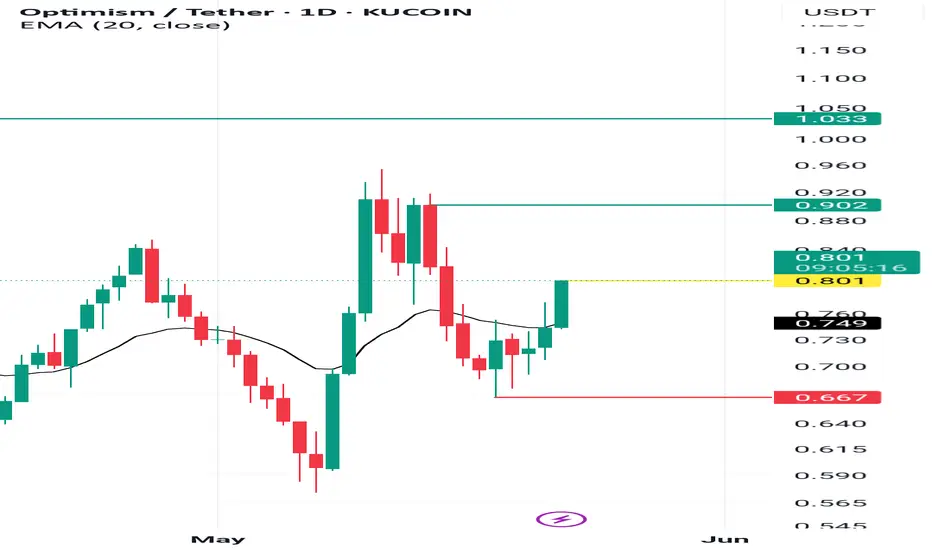
OPUSDT 1D AnalysisOP ~ 1D Analysis
#OP Buy in stages from here with a short term target of at least 15%+ and a long term target of $2.7

#OP/USDT#OP
The price is moving within a descending channel on the 1-hour frame and is expected to continue upward.
We have a trend to stabilize above the 100 moving average once again.
We have a downtrend on the RSI indicator, which supports the upward move by breaking it upward.
We have a support area at the lower limit of the channel at 0.817.
Entry price: 0.860
First target: 0.891
Second target: 0.916
Third target: 0.950

OP/USDT Breakout Alert!!🚀 OP Breakout Alert – 100% Potential Incoming?! 👀🔥
Hey Traders! If you're all about high-conviction plays and real alpha, smash that 👍 and tap Follow for more setups that actually deliver! 💹💯
OP has successfully broken out from the falling wedge pattern on the daily timeframe, which historically signals a strong trend reversal. After retesting the breakout zone, price action looks ready for a fresh upside move!
🔹 Entry: CMP and add more up to $0.76
🎯 Targets:
→ $0.98
→ $1.21
→ $1.43
→ Final Target: $1.64
🛑 SL: $0.688
⚙️ Leverage: Low leverage (Max 5x)
📊 Structure:
Falling wedge breakout ✅
Retest holding strong ✅
Volume starting to pick up 📈
We’re watching closely—this setup has the potential to mimic the last 114% rally. Let's see how it unfolds! 🚀
💬 What’s your take on OP from here?

$BTC support zoneCRYPTOCAP:BTC has broken out of a falling wedge and is now consolidating above the key $91K support zone.
- Eyes are now on the All-Time High at $ 109 K.
- Once that breaks, a price discovery rally toward $ 120k+
It is highly likely. 🧠
- The chart looks.
DYRO, NFA

OPUSDT 1D AnalysisOP ~ 1D Analysis
#OP Buy after successfully penetrating this resistant line with a short -term target of at least 15%+ from here.
