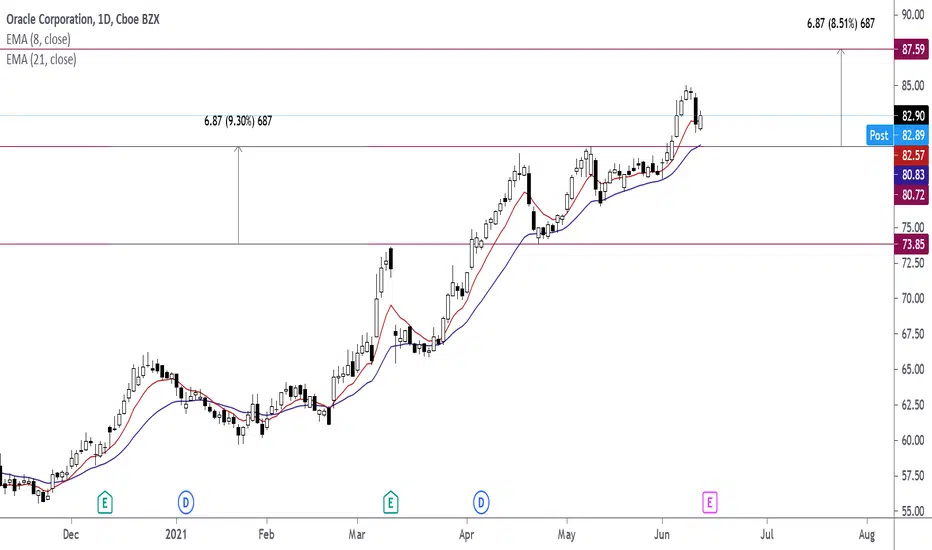
Oracle

Chainlink: 3 Bullish Signs ExplainedIn this idea i will briefly describe 3 reasons why I believe Chainlink (LINK:BTC)
has a high probability of increasing in value from here based on Technical Analysis.
---------------------------------------------------
1. Bull Flag
Click the below image for a educational idea on the Bull Flag Pattern.
Bull Flags are one of the most widely recognised and used chart patterns with a high success rate: and Chainlink has a rather large example of one on the larger time frame charts. Click above image for further educaiton.
---------------------------------------------------
2. Reclaiming Trendline
Click the below images to see two other examples of Diagonal Support & Resistance in action.
It takes 2 touches to draw a Diagonal Trendline and 3 to confirm, in image #2 we can clearly see the price is trying to get back above the previous Diagonal Trendline (Support) marked in green arrows which is a great sign.
If the price failed to get above this area then it would be a potential warning sign. As you can see in the two above examples usually when price pierces through a trendline it can head in that particular direction.
---------------------------------------------------
3. Beginning a new market phase
Click the below image for a educational idea explaining Market Phases & Cycles, one of the most important things you will learn in your career.
"All financial markets go through the same phases and are cyclical. They rise, top out, drop, and then bottom out. When one market cycle is finished, another begins."
ChainLink looks like a great example of a Full Cycle completed a ready to begin its new one. A little more upside here and we have confirmation of the Mark Up Phase. (See above image for further understanding).
-------------------------------------------------
I hope you enjoyed the idea and found it insightful, if you did you can show your appreciation by Liking & Commenting, thank you!
You can see the idea linked below for my last successfull trade idea on Chainlink.

Chainlink in the beginning of the 3rd wave of Elliott?recently I was extremely bearish on the Chainlink chart but after I see the chart of HitBTC, I changed my mind.


LONG $ARES - Ares Protocol LONG $ARES - BOUNCE OF SUPPORT -
ARES could be the chainlink of Polkadot😍
s is an on-chain verifying oracle protocol powered by Polkadot. It provides reliable off-chain data efficiently and in a trustless manner. Ares is built on Substrate and constructed as a parachain to link to Polkadot's ecology and share its security consensus. It is a scalable oracle network that provides decentralized data services to the Polkadot ecosystem and its parachains.

What the heck is Chainlink (LINK) ?Chainlink was founded in 2017 by Sergey Nazarov, with Cornell Professor Ari Jules as a technical advisor. Chainlink itself isn’t a blockchain. Chainlink is an Oracle network which can run on multiple blockchains. So what is an Oracle? In short, Oracles provide a bridge between blockchains and real world data.
Take for example a decentralized sports betting application. The application would operate with smart contracts on a smart contract capable blockchain (such as Etherium). The application would rely on an Oracle to retrieve sports scores from the real world and provide the data to the smart contract. That is the type of role that Chainlink is designed to fill.
Other examples of external sources which Chainlink could pull might be weather data, fiat currency data, commodity prices, or votes in an election. Oracles are absolutely essential in blockchain adoption and mass use, and Chainlink is highly regarded in this space.
Chainlink oracles currently run on the following blockchains:
• Etherium
• Binance Smart Chain
• Solana
• Heco
• Xdai
• Fantom
• Polygon
• Avalanche
One of the biggest adopters of Chainlink is Google, to integrate their BigQuery data analytics platform.
As for tokenomics, LINK has a current circulating supply of 426M coins, with a maximum of 1 billion coins. The current market cap as of this writing is $18B. The LINK token is used to compensate node operators. If a node operator is found to have provided bad data, the tokens from that node are re-distributed among nodes found to provide good data. In this way, providing accurate data is highly incentivized.
Chainlink staking functionality isn’t implemented – though you can stake LINK through node operators. There are plans to enable staking in the near future.
One of the largest criticisms of Chainlink is the large number of tokens still held by the team behind the project – estimated at 30%. This doesn’t include Node operator incentives (35%). These are just tokens held by the team. Despite this, Chainlink has maintained consistent positive price action.. but the allocation is concerning.
For this reason, I have a relatively small percentage of my holdings in LINK. Overall I like the project, and I do expect that it will continue to reward investors for the foreseeable future.

Chainlink to $100Link here looks pretty good even after the BTC dump. If we lose 40 we can see 30s. I'm still very much long here. Link showing strength in BTC pair as well. Lower highs are still being made. Well see how this daily closes.
Buy the dips my frens. Or stay poor.
Don't care about your opinions, the charts don't care either.

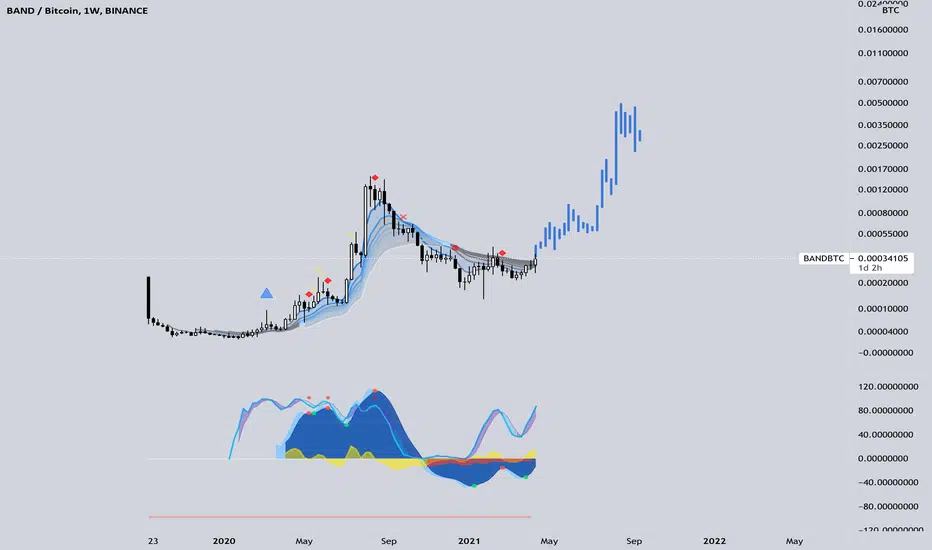
BAND IN A MASSIVE CUP-AND-HANDLE FORMATION & IT'S PATH TO $50!On the daily chart, BAND is living in a picture perfect cup and handle formation. If you pull up this formation in a search engine, you will see what BAND's daily chart looks like.
BAND being one of the most popular protocols aside from LINK & usually holding it's price at around 50% of LINK's price, it is set to go higher. Once it gets through ATH to $25-30, I don't think it will stop until $50-ish.
BAND is also a relatively low cap coin, 10x less supply than LINK (!!!)
And yes, this also means I believe LINK could get to around $100 once the currently often mentioned "Oracle season" takes place, maintaining the approximate 2x price of BAND. While I don't think BAND will overtake LINK, I sure hope it will give it run for its money.
Of course, all of this is subject to the mood swings of the big boss, Mr.Bitcoin.
Full disclosure, BAND is one of my most favorite coins of 2020/2021 since $4-5 and paid my rent many times.
Not financial advise; I am just the dude typing stuff for free :) Don't listen to me - this is my second idea ever!
May we all manifest lots of wealth.

Chainlink (LINK) to test ATH and Beyond 54% Gain: Update Chainlink (LINK) to test ATH and Beyond 54% Gain: Update 07/05/21
58% Gain from Buy Zone 2. Next Stop $57 @ 161.80% Fibonacci extension, 18% Gain from the current price level @ $48. See previous analysis below. Happy Trading :)
Chainlink (LINK) Update: 44% Gained, 10% to New ATH @ 161.80% Fibonacci Level. See previous analysis below. Happy Trading :) Next stop $47 for $LINK
Update from 05 /04/21: Chainlink (LINK) to test previous ATH and Beyond 54% Gain to 161.80% Fibonacci level @ $47. Since reaching a new ATH on the 20th February @ $36.84 Link has been consolidating in this range between 61.80% and 23.60% Fibonacci level ($30 to $24) showing significant profit takers in the market as we have seen the bulls try to push the price above the 61.80% Fibonacci level and failing to break past this key resistance level 3 times over the past 42 days. On the 29th March our Swing Call script triggered a strong buy signal just above the 38.20% Fibonacci level and we actually saw the price push past the key area of resistance for the first time since setting the new ATH . Since then we have retraced back down touching the 50 SMA (a clear fake out from LINK). From here we expect another test of the 50 SMA before the LINK can truly break out of this key area of resistance to push past the 78.60% Fibonacci level and a test of the previous ATH which we can expect to be tested @ $36.84. This run from LINK has been long awaited with a lot of solid fundamental news around the project. If we see a break above $33 we can expect a probable 54% Gain to the 161.80% Fibonacci level and our price target of $47. Be patient, wait for further confirmation from price action, use buy zone to map out your buys whether you are already in LINK and want to DCA or are planning to make an entry. Happy trading :) $LINK

UMA / USDT UMA has broken strong resistance at 30 USDT area.
At this moment it's having a pull-back to reconfirm. Either resistance becomes a support, or it tests the previous trend line.
Oracles are popular right now, so should be a nice long if market conditions are favourable.

$BAND will enable you to delete your LinkedIn this year.Chart says it all, everything lining up perfectly.
BAND Undervalued ? Ascending Triangle FormationBAND is another one of those coins that I feel is quite undervalued still, It is a cross chain data oracle for the web 3.
I see the importance and aim it takes for cross chain implementation is superior to LINK, especially with more ecosystems such as Binance Smart Chain, Huobi ECO, Polkadot, etc. The potential for BAND is much greater than LINK I believe.
With LINK sitting at a 17 Billion $ Market Cap, and BAND at a 500 MILLION $ Market Cap.
Even a 20x of Market Cap would have BAND sitting at a 10 Billion $ MC, meaning a price of almost 400$. Fundamentally speaking this is one of the coins I suggest having in your portfolio if anything, for the MID-LONG term.
Technical analysis side shows BAND following an ascending triangle pattern on the 1D chart, It is about break above the 20$ resistance level which has acted as resistance previously (two red arrows indicating it).
Maybe a scenario displayed by the blue path line could be the playout in the short term potentially (could play out much earlier though with current market sentiment), ideally I would like to see a break above the 20$ resistance and a run up to 25$ - 30$, before it comes back down to confirm a S/R flip.
Thanks for reading!

Shark harmonic pattern shows 2.7 20$ isn't support, It is the future strong resistance. I start to buy from 4.3.
AB=0.38 XA
BC=1.6 AB
CD=1.6 BC

Dump and Pump!with the shark harmonic pattern on the 5th wave could drop to 2.7 or 1 and then pump to 80.

sell Chainlink and buy again at price zone of ($3-$5)Link has an awful negative divergence on the weekly timeframe and forms a recognizable shark harmonic pattern on the 5th wave of Elliott.

Dia the futur LInkHe break the resistance, next resistance 1000 sat.
Here we go.
Market Cap
$91,525,638
Circulating Supply
28,271,916 DIA
He's in the Binance Smart Chain (BCS) now :)
medium.com


ChainLinkBlockchain oracles are third-party services that provide smart contracts with external information. They serve as bridges between blockchains and the outside world. Blockchains and smart contracts cannot access off-chain data (data that is outside of the network).
Chainlink is the leader among the oracles, has now formed a very bullish formation, I think you will reach the 61.8% fibonacci level and then higher
Best regards EXCAVO

NEST — Your Secret GEM, that wont be a secret for much longer.. Hello Traders,
Alright here it is, we are moving through spring time, getting ready for another bullish part of the year. April usually bring crypto showers for May’s bank account flowers.
You’ve been searching, scouring, obsessed over finding the next true hidden gem. Well I believe if you were lucky enough to stumble upon this writing you may now be prompted to do your own research into the NEST Protocol.
I believe this one will rival the likes of BAND & LINK.
The current $110 Mil market cap is a fraction of the band and link market caps.
Growing to even a 850 Mil Market Cap would bring us close to 700% gains from it’s current price.
The words can’t be typed fast enough, I’m not fomoing in by I’m definitely getting in on this project and I will be buying every opportunity that presents itself on this one.
You can learn more about this project by checking out this article: coinmarketcap.com
Buy, Hold, Realize gains!
Good luck!

API3 - Price Prediction! 40%+ Gains Possible, Maybe 5,458%+Hello Traders,
Here comes Chainlinks competitor! Lock and loaded, this one is showing some major strength and now has confirmed its reversal to the upside.
We passed the 255/200/100 EMA.
We have a bullish pennant that has formed and I expect at any moment here we will break further to the upside.
My target is the recent ATH's (make sure to secure profit along the way though).
Long-term: If API3 can even grab a 3rd of the market cap that Chainlink has, we would be sitting around $4,232,892,577. Times that by the current circulating supply of 13,847,549 (drum roll, please)... Price would be: $300+. Yes, that is right, $300. That would be a 5,458% increase.
Folks this is one to keep an eye on. For number's sake, $500 could turn into a cool $27,290. Not bad and not out of the question.
Good luck!

BAND/USDT Long Term PictureSitting at ~300 mil mcap, BAND has underperformed the market since January along with the entire oracle sector, and because of that it's really not been mentioned much.
Zooming out though we can see it's been ranging within an accumulation range, close to the previous ATH. Accumulation, in a bull market, at an ATH is when you want to buy; as this is when large players are building their positions.
TA wise a bullish divergence is forming, stoch has reset, and ichimoku is bullish. We can also see there is a clear long term parabola in formation.
I have high confidence that this parabola will play out, and as such I've taken a large position. However, it's important to understand that when you're trading charts on high time frames you often will be waiting extended periods for a breakout and may be forced to be underwater for a bit.
Don't be concerned with the intraday price action. This coin could easily trade up to a $3 billion mcap which would be a 10x from here
Good luck.

BUY THE DEEP of DIP 📣 (CHAINLINK/KING UPDATE)Another 📐 in 📐 👀
that will be explosive,,,
ALWAYz DYOR,,,
💚
